
Q1 - Q3 2016 China Net Gold Import Hits 905 Tonnes

 Koos Jansen
Withdrawals from the vaults of the Shanghai Gold Exchange, which can be used as a proxy for Chinese wholesale gold demand, reached 1,406 tonnes in the first three quarters of 2016. Supply that went through the central bourse consisted of at least 905 tonnes imported gold, roughly 335 tonnes of domestic mine output, and 166 tonnes in scrap supply and other flows recycled through the exchange.
Core Supply & Demand Data Chinese Gold Market Q1-Q3 2016
Chinese gold demand is still going strong this year, albeit less than in 2015. The most likely reason for somewhat lower demand has been the strength in the price of gold in the first three quarters of this year, to which the Chinese reacted by subduing purchases. From 1 January until 30 September 2016, the gold price went up 24 % in US dollars per troy ounce, from $1,061.5 to $1,318.1; measured in renminbi the price went up 28 % over the same period.
Now I have proven the gold on Chinese commercial bank balance sheets has little to do with physical gold ownership of these banks, but mainly reflects back-to back leases and swaps, we can be positive that data on withdrawals from the vaults of the Shanghai Gold Exchange (SGE) roughly equals Chinese wholesale demand. For now that is, as future developments can always alter our metrics.
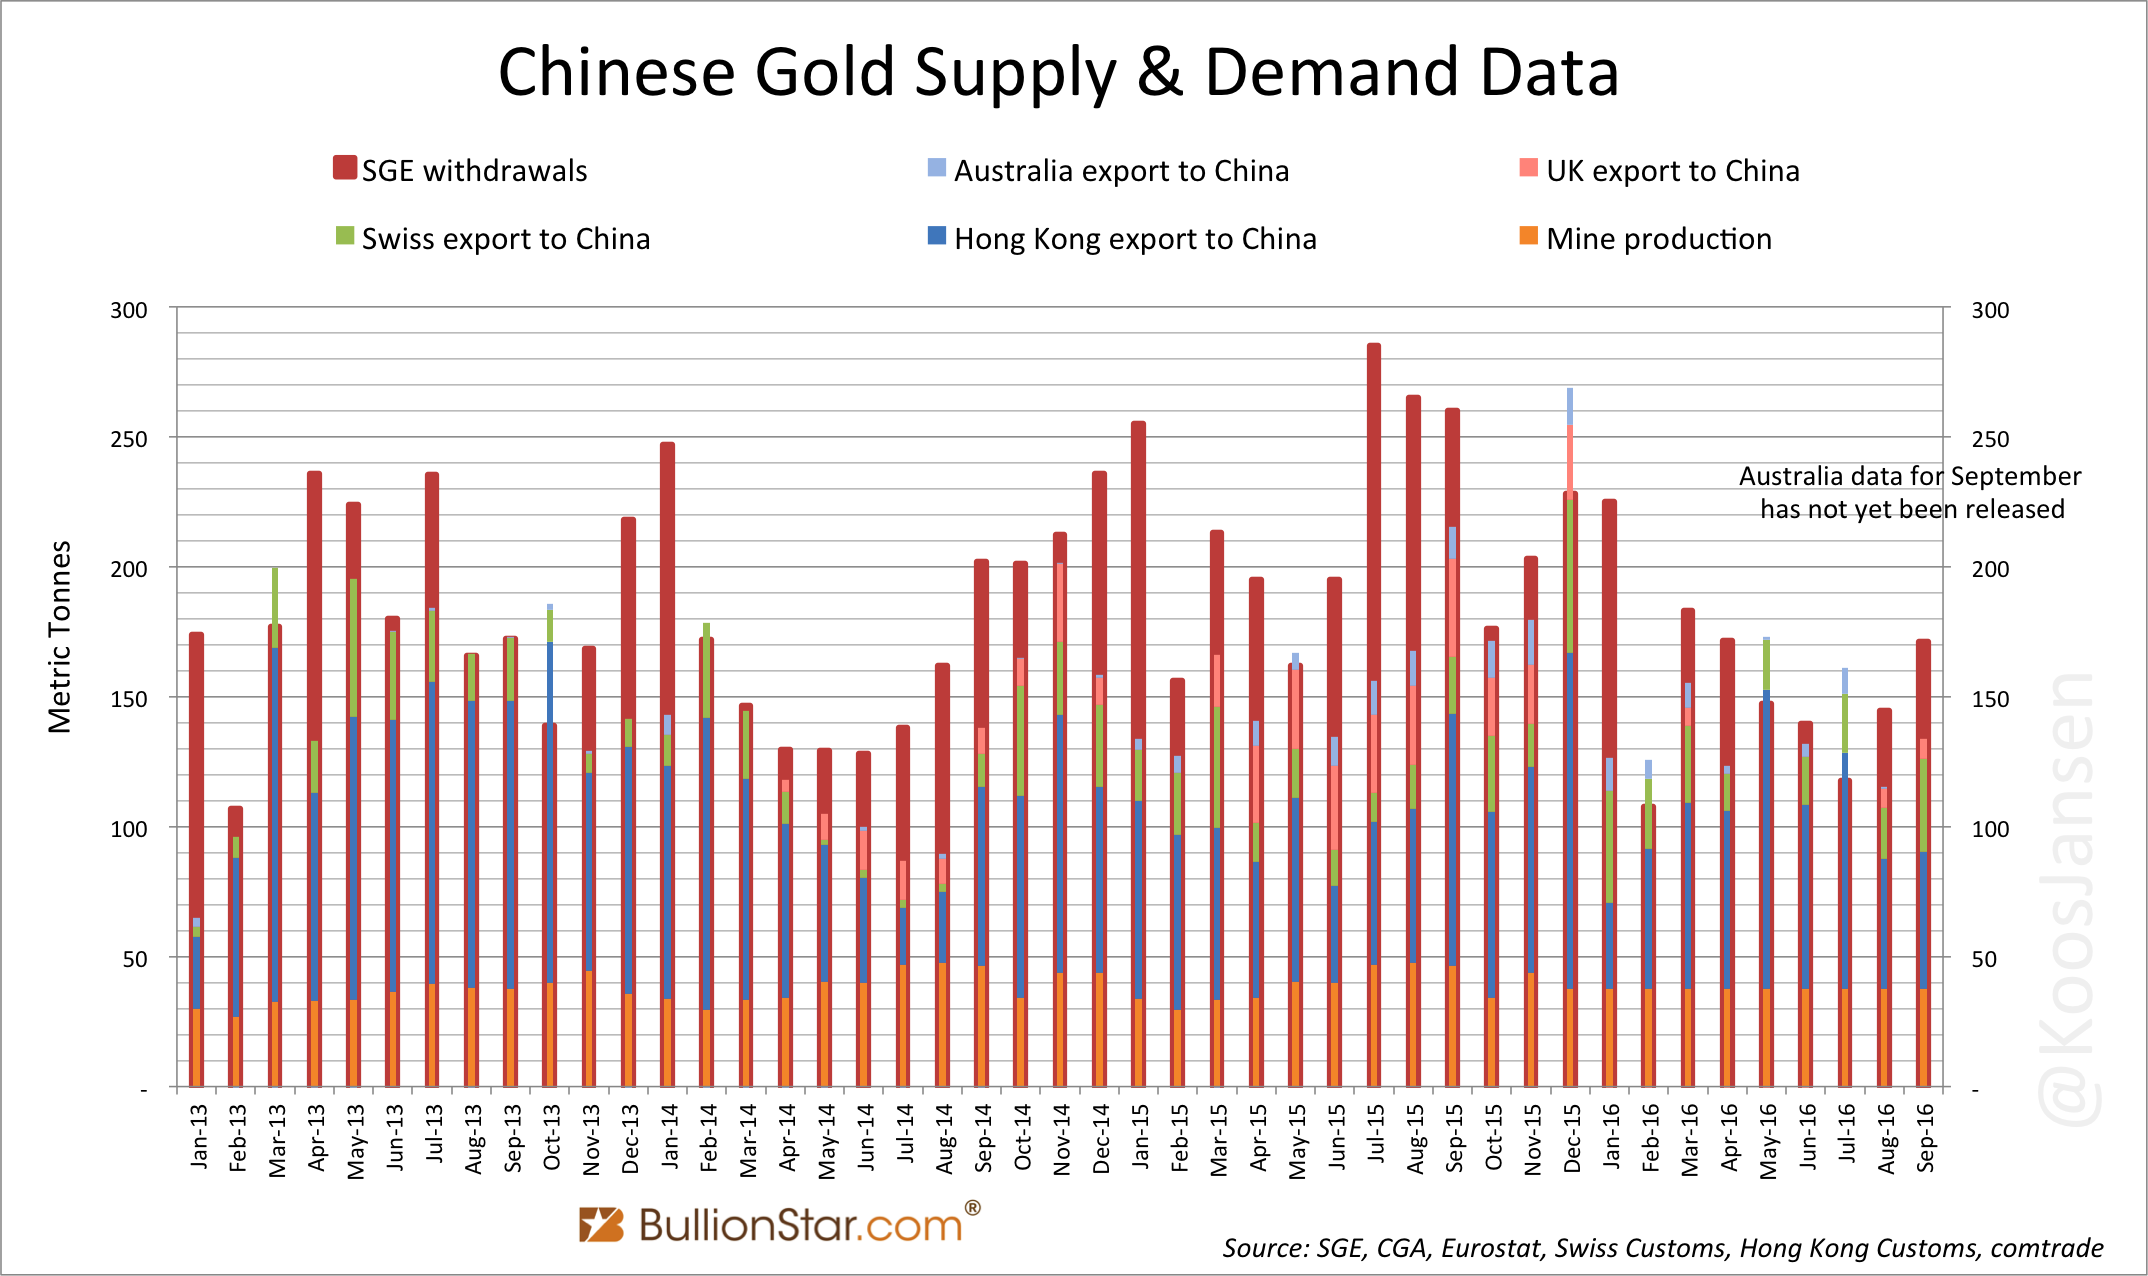
Below is a chart showing withdrawals from the vaults of the SGE and the price of gold in yuan per gram. The most significant trends of recent years are still in effect; in the short term, when the gold price is falling Chinese demand increases (2013 and 2015), when the gold price is rising Chinese demand declines (2016). This trend is supported by SGE premiums that have an inverse correlation with the price of gold, when the price of gold declines, SGE premiums escalate and vice versa – I will show charts below. Furthermore, in the long term we can observe consistent growth in Chinese gold demand due to the opening up and development of the domestic market.
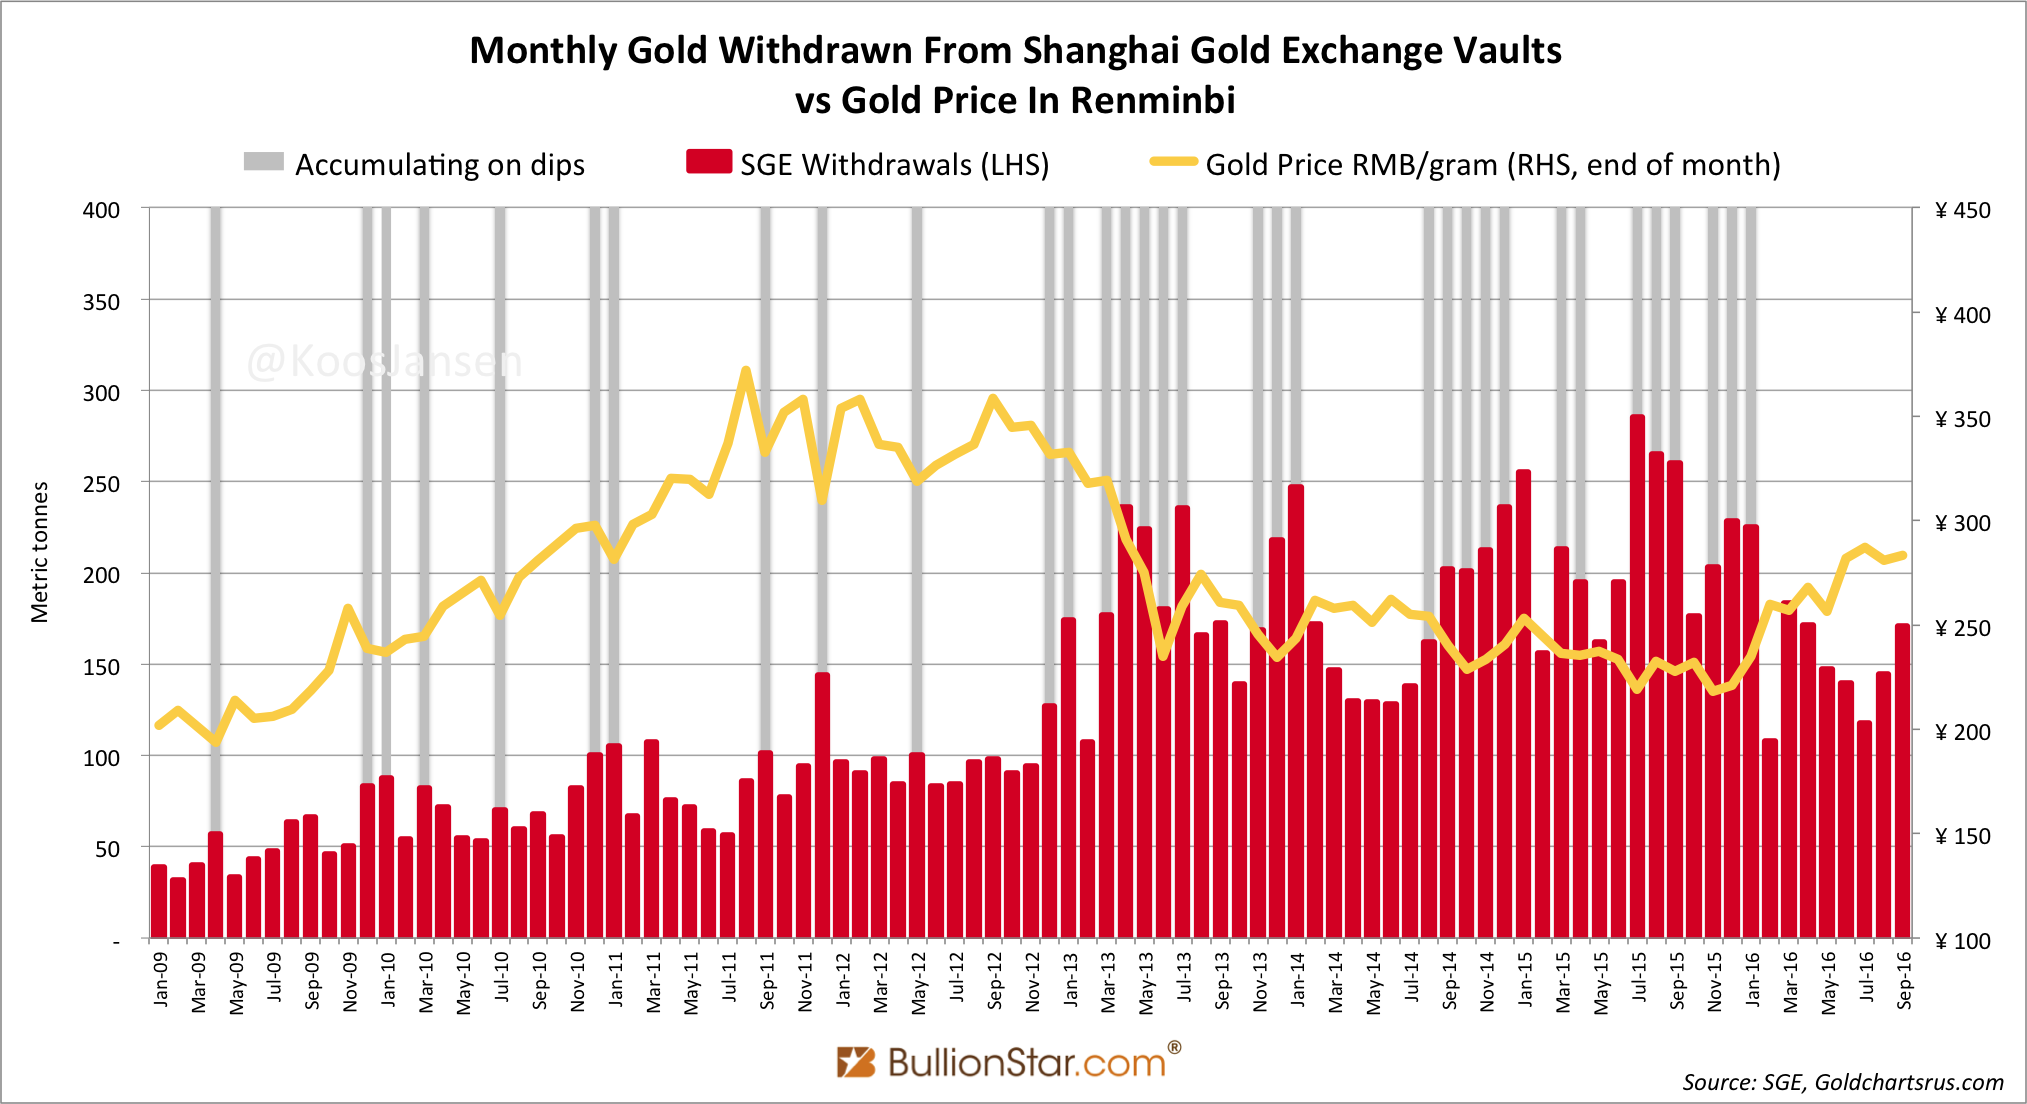
SGE withdrawals in the first three quarters of 2016 accounted for 1,406 tonnes – still impressive – down 29 % from 1,986 tonnes in 2015, which was a record year. Annualized SGE withdrawals are set to hit 1,877 tonnes in 2016.
Notable, “known net import” by China is relatively strong compared to SGE withdrawals in 2016. Total net import in the first three quarters of this year has aggregated to 905 tonnes – annualized 1,206 tonnes – or 64 % of SGE withdrawals, versus an import/withdrawals ratio of 53 % in 2015. As mine supply to the SGE is fairly constant, recycled gold through the SGE must be lower this year than last year. As a rule of thumb, we use the equation:
SGE withdrawals = domestic mine output + import + recycled
For Q1-Q3 2016 that gives:
1,406 tonnes = 335 tonnes + 905 tonnes + 166 tonnes
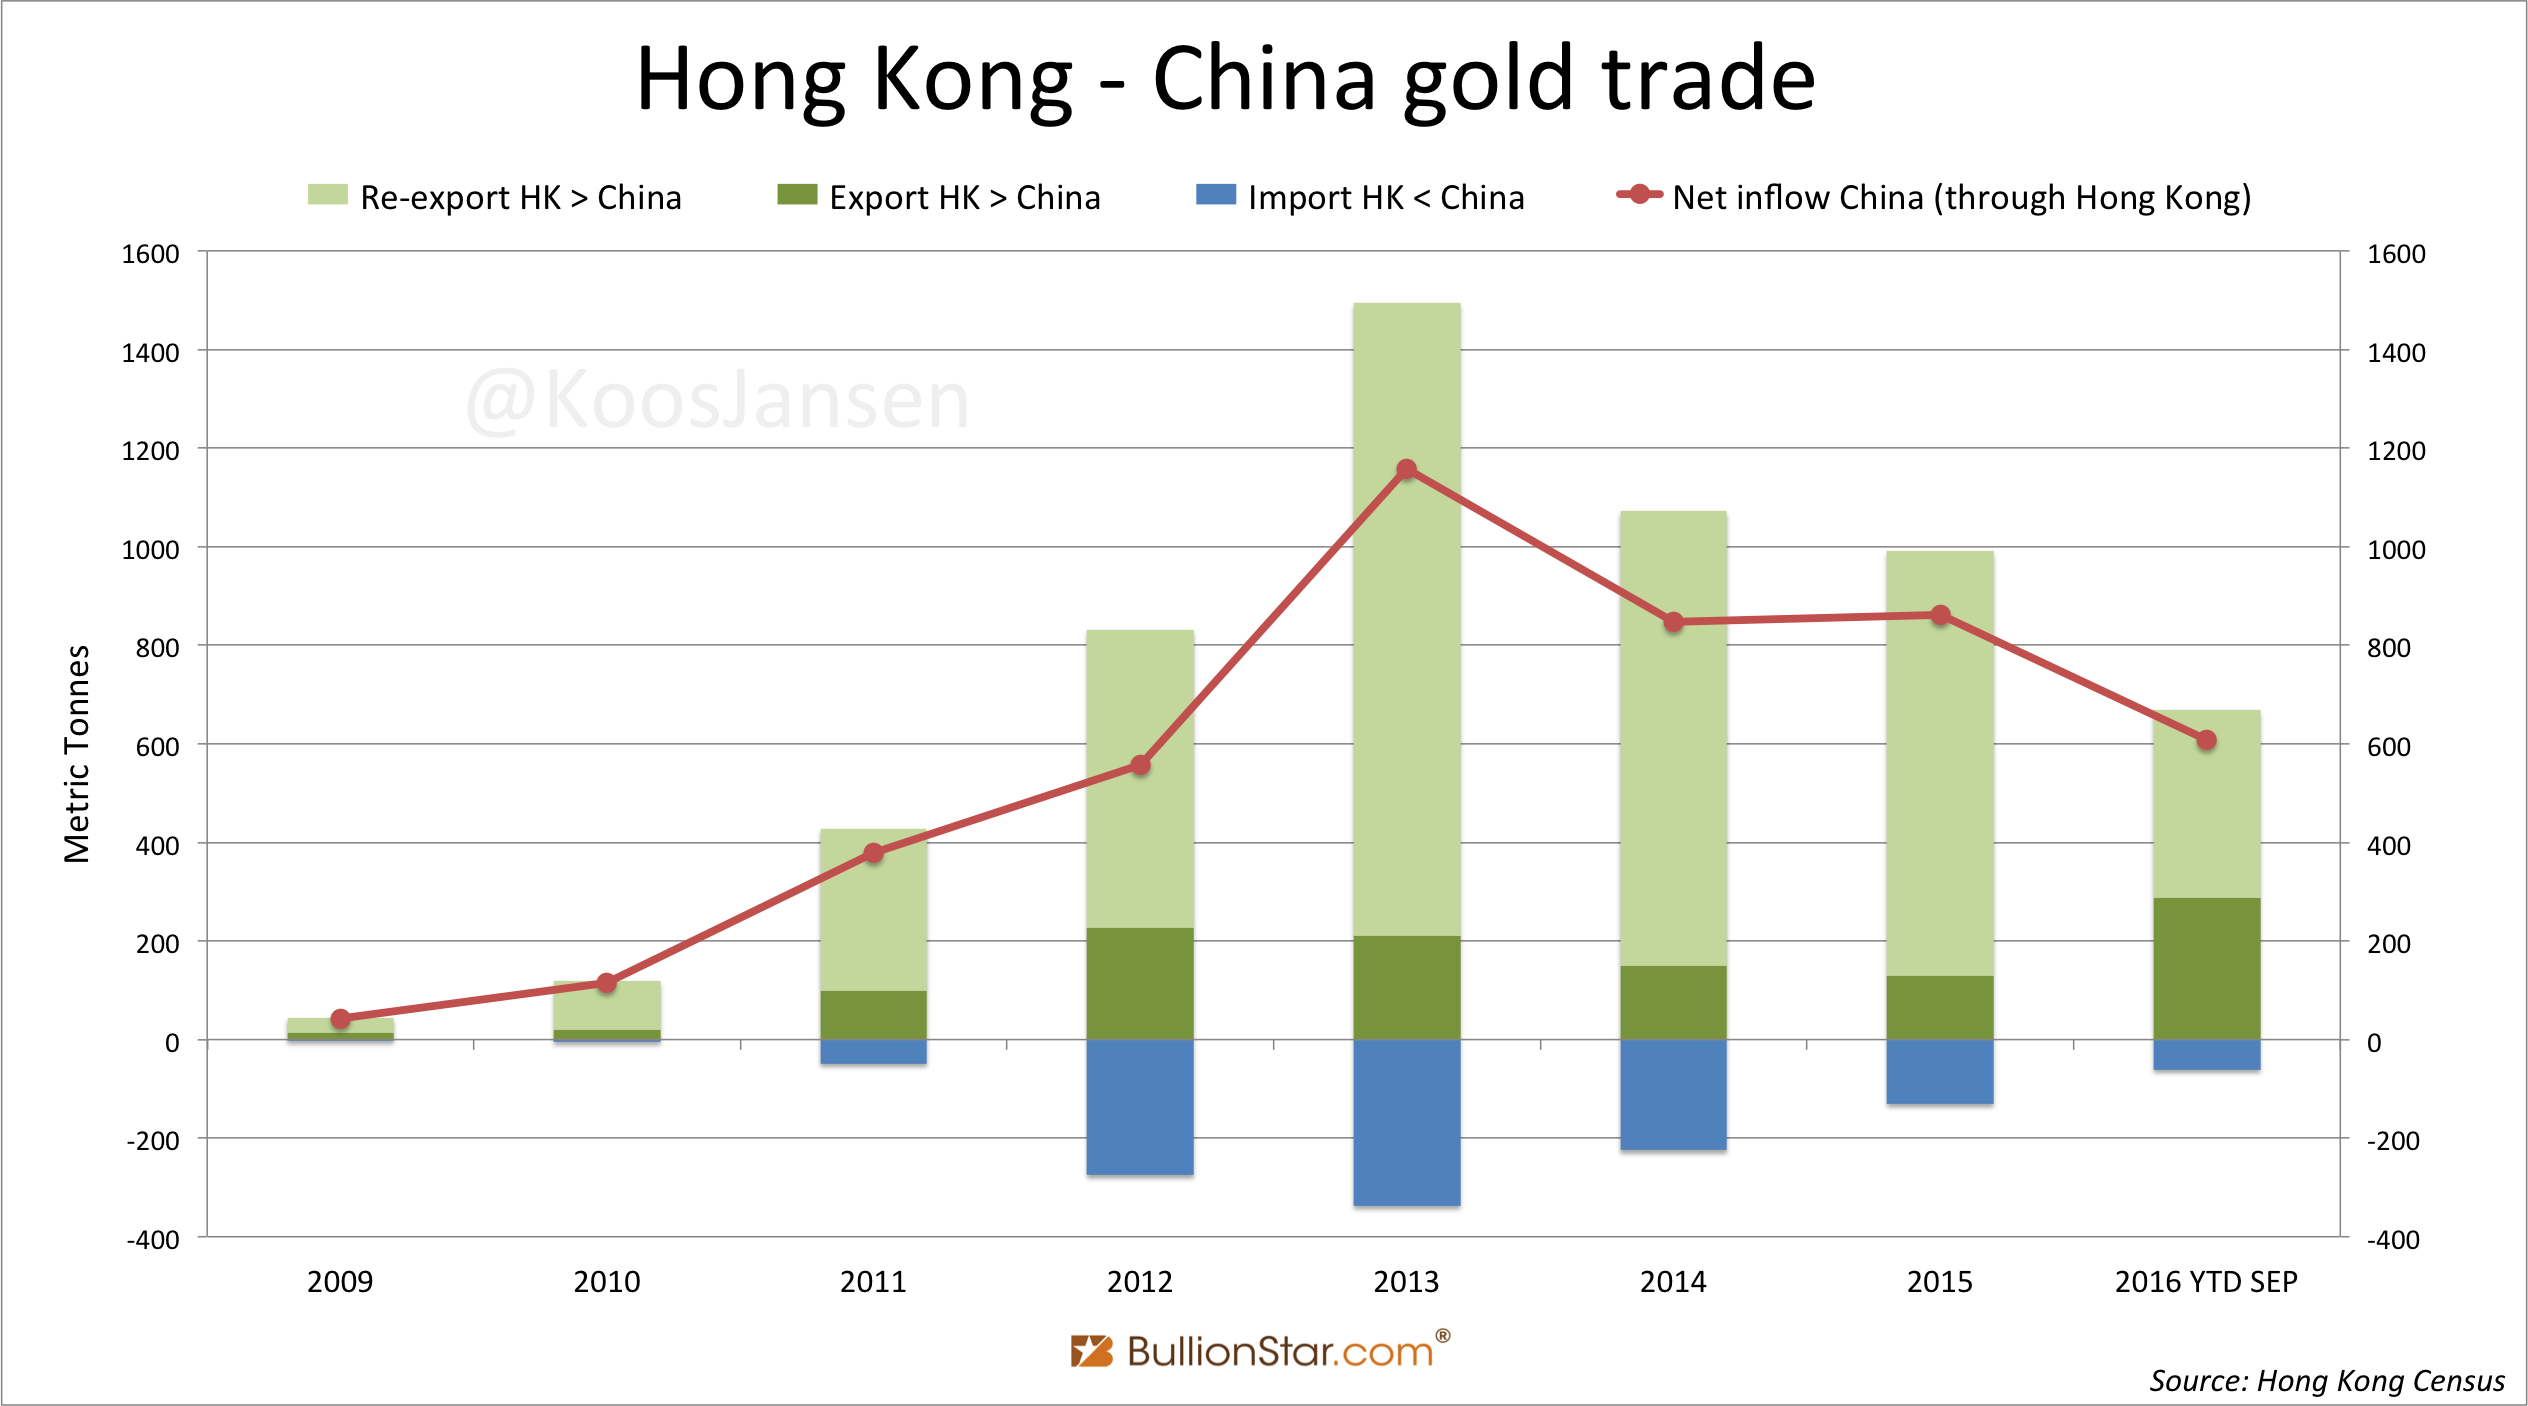
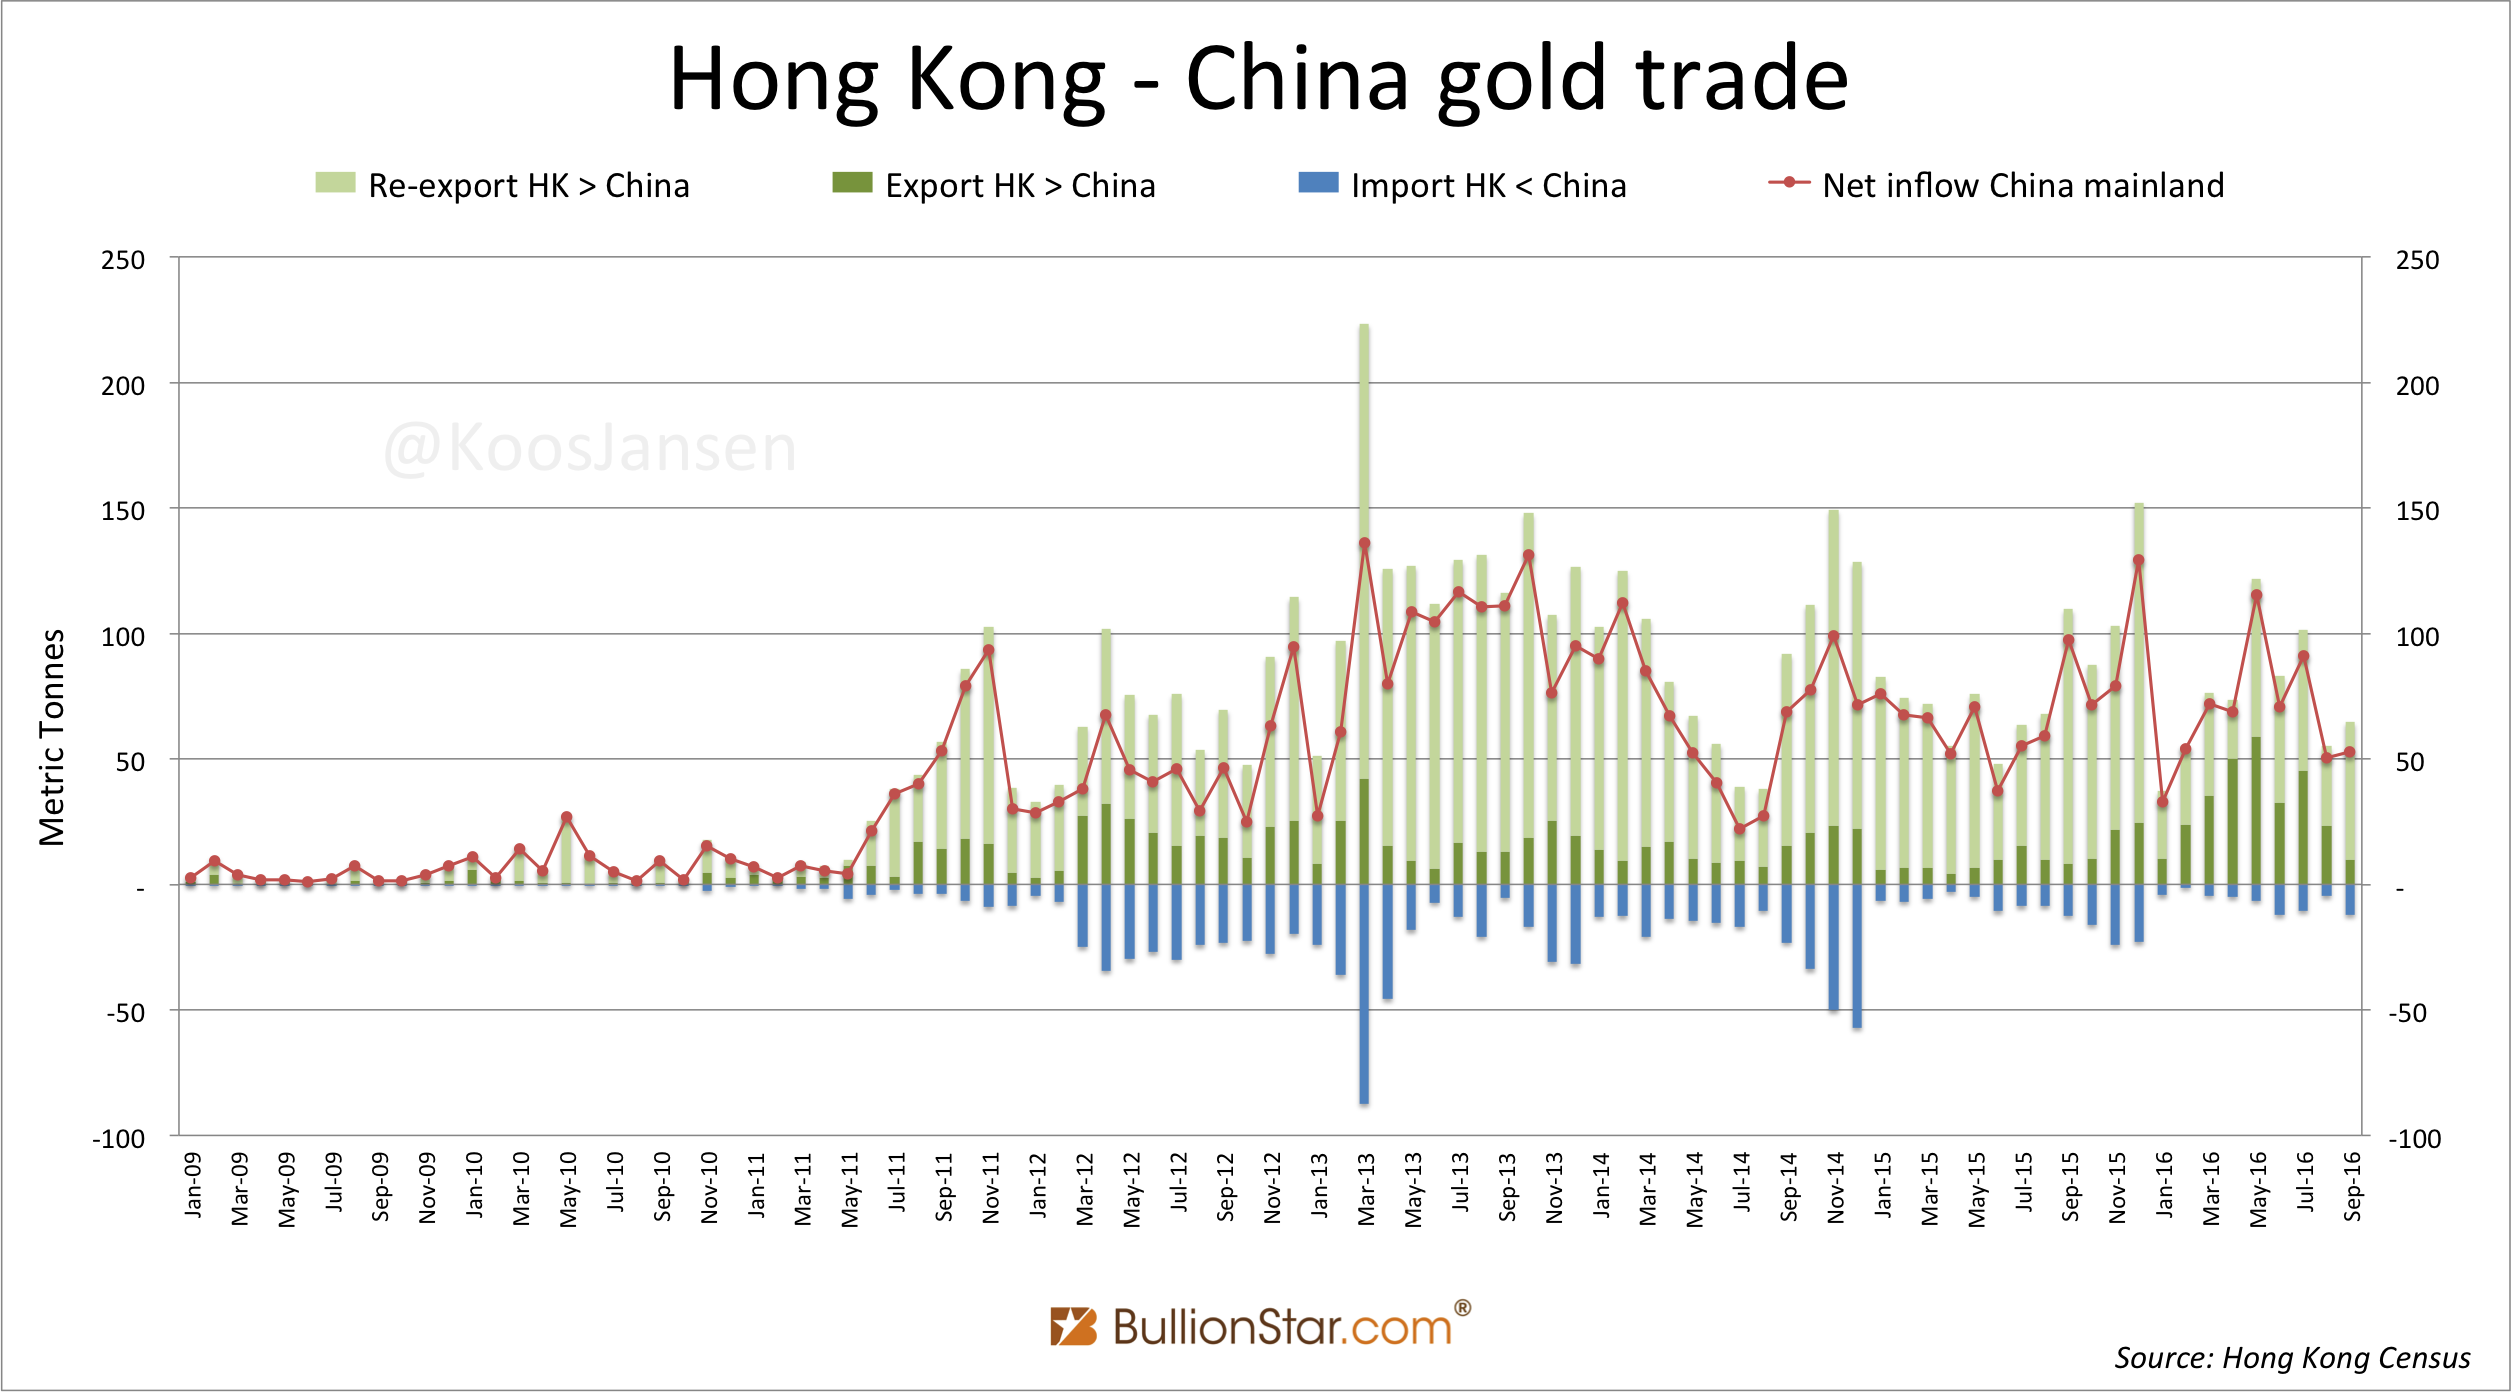
The largest net exporter to China is still Hong Kong, having transhipped 608 tonnes to the mainland from January until September 2016, up 5 % compared to 2015. The volume Hong Kong exports to the mainland has been quite constant since 2014, while in 2013 China’s special administrative region was a substantial larger supplier.
(There have been rumors that Hong Kong ’s export to China is overstated in the official data by the Hong Kong Census & Statistics Department, caused by fake exports. In the chart below you can see that the share of exports relative to re-exports from Hong Kong to China this year has increased from previous years. Potentially this signals fake exports, as it’s easier to over invoice an export than re-export, though I haven’t found hard evidence for this scheme. When I do I will report accordingly.)
The second largest exporter to China is Switzerland, having supplied a net 229 tonnes so far this year, which is 22 % more than last year. Clearly, direct shipments from Switzerland to China have replaced shipments via Hong Kong.
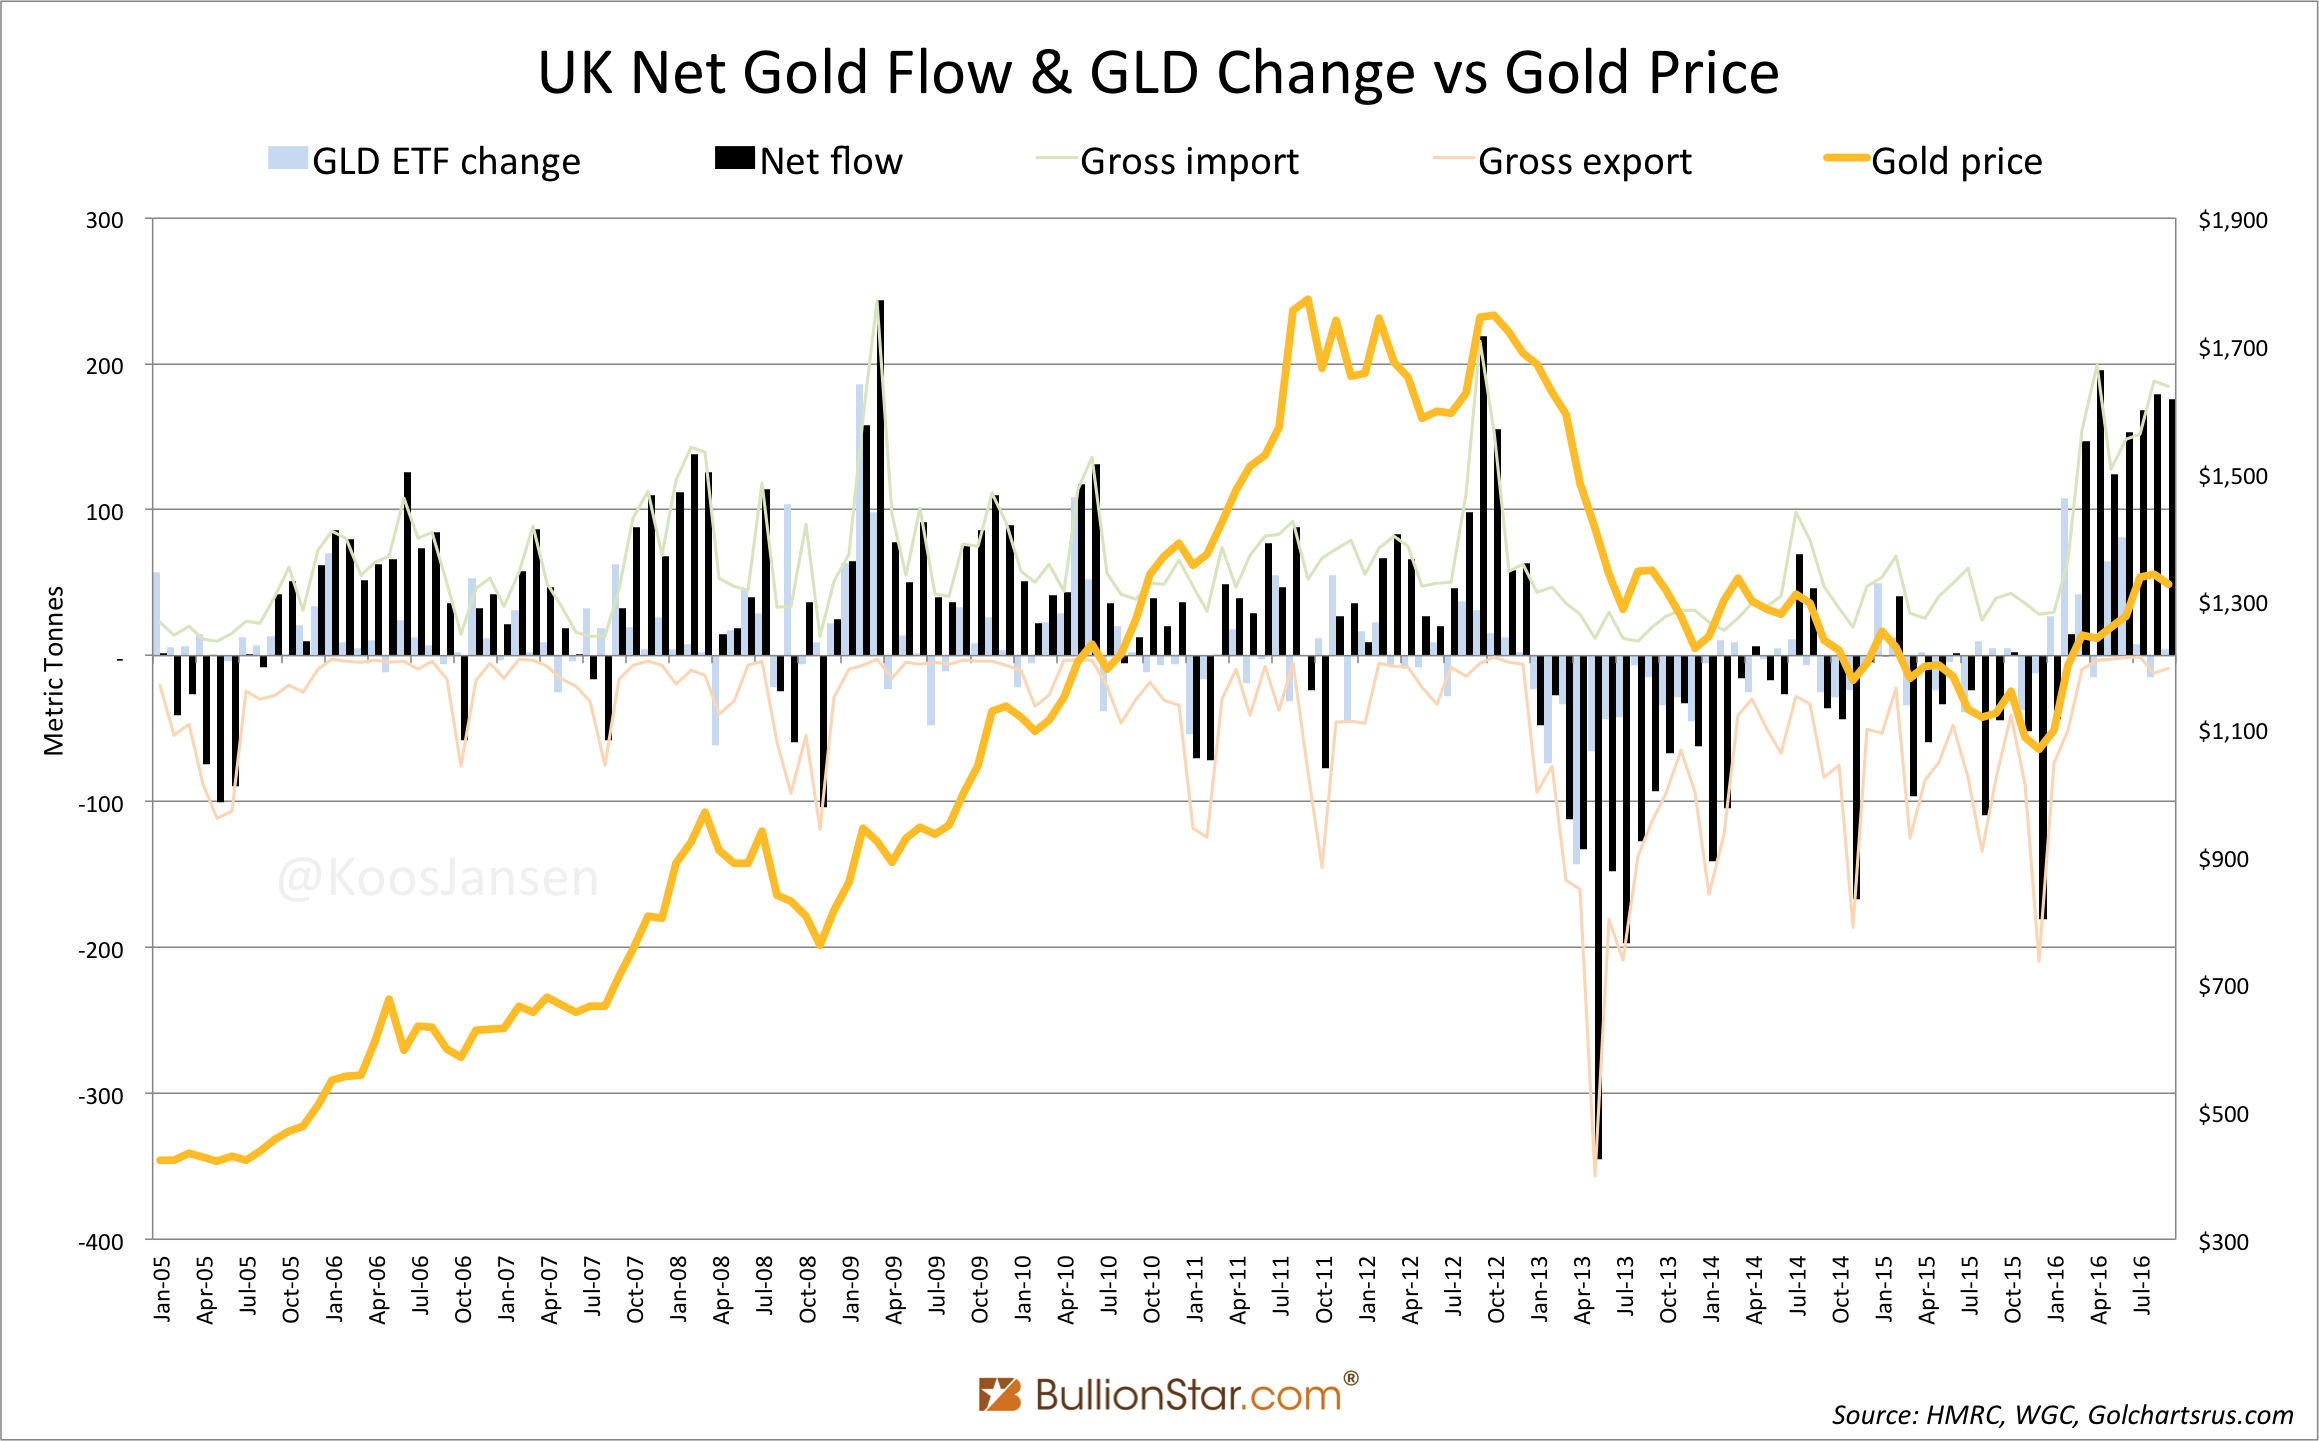
Direct net exports by the UK to China mainland have collapsed by 92 % this year compared to 2015, from 210 tonnes to a mere 18 tonnes. The reason being, the UK has been the largest net importer globally this year, which is related to the strength in the gold price early this year. UK net gold trade is a proxy for Western institutional supply and demand.
Australia’s direct export to China is down this year as well (in the first eight months, data for September has not yet been released). I’ve computed the data as described in my post Australia Customs Department Confirms BullionStar’s Analysis On Gold Export To China. Following this method, the land of down under has sent 50 tonnes of gold directly to China during the first eight months of this year, down 23 % from 65 tonnes in 2015.
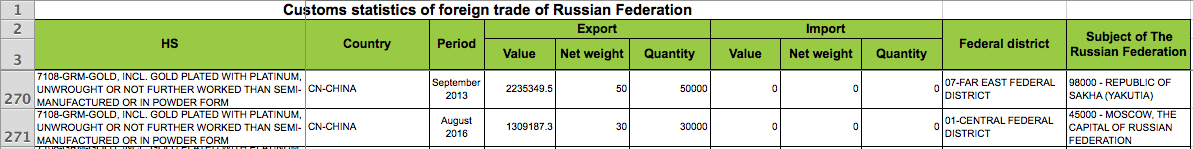
Despite press releases suggesting Russian gold enterprises are strengthening ties with the SGE, I have identified only one shipment of 30 Kg by the Russian Federation directly to China in 2016. In 2013 the Russians directly net exported 50 Kg to China.
Data on gold export from South Africa to China is not publicly available.
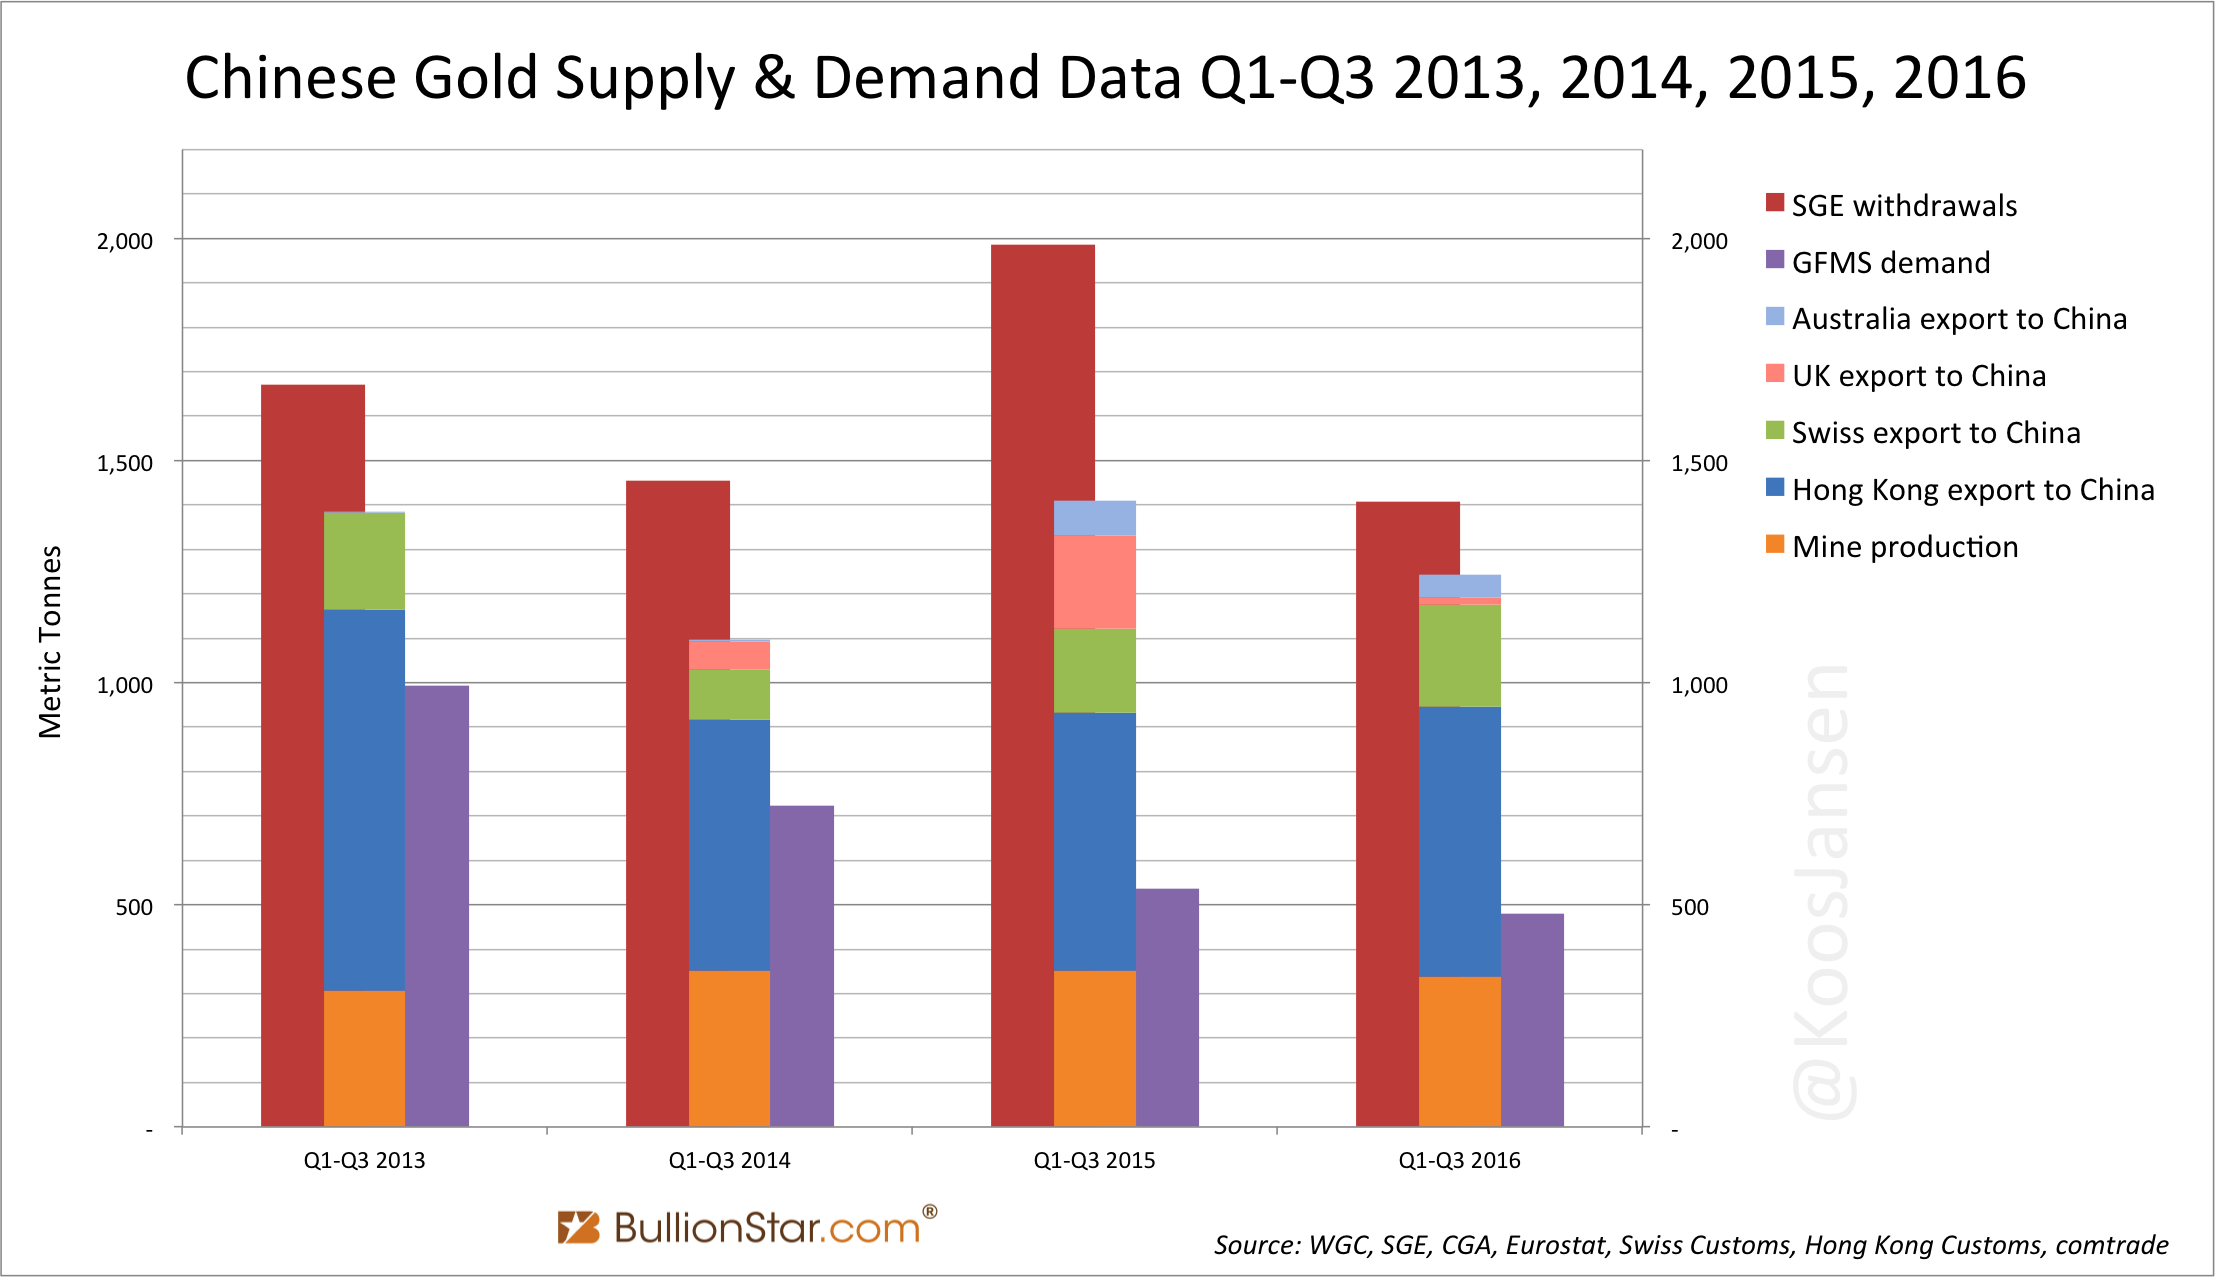
In exhibit 7 we can see that, although the level of SGE withdrawals in 2016 is lower than in 2013, 2014 and 2015, net imports are higher than in 2014. It’s very difficult to know the exact explanation for relative high imports this year. Though, in my opinion, it’s connected to increased Chinese ETF demand, which grew by 34 tonnes and is all required to be stored in SGE vaults, and less gold being recycled through the SGE.
Since 2014, when the Shanghai International Gold Exchange (SGEI) was erected, there is a possibility “SGE withdrawals" are inflated by withdrawals from vaults in the Shanghai Free Trade Zone; gold that is allowed to be exported abroad – the free trade zone is not part of the domestic market. But as far as I know any activity on the SGEI lacks foreign enterprises that buy gold to withdraw and export. A couple of months ago a source at a large Chinese bank told me the SGEI is mainly used by Chinese banks to import gold into Chinese domestic market. In addition, I haven’t bumped into any large importers from China. Occasionally India imports a few hundred Kg, but that’s it.
The emblematic difference between “Chinese gold demand as disclosed by GFMS” and SGE withdrawals – displayed in exhibit 7 – is due to GFMS’ incomplete metrics. For decades this consultancy firm has been denying the existence of institutional supply and demand in above ground gold, which is far more important to price formation than retail sales and mine supply, the predominant flows published by GFMS. The essence of this swindle can be read in my blog post The Great Physical Gold Supply & Demand Illusion. I also have a few more blog posts in the pipeline that discuss GFMS’ most recent gold supply and demand data.
SGE Premiums November Highest Since 2013
I expect November to be a very strong month for SGE withdrawals. Mentioned in the introduction segment of this post, there is a trend in Chinese wholesale gold demand in relation to the gold price. Whenever, the gold price is climbing, Chinese demand is subdued, accompanied by low SGE premiums; when the gold price is decreasing, SGE withdrawals and premiums in China shoot up. The relationship between the gold price and SGE withdrawals can be viewed in exhibit 1. Below in exhibit 8 & 9, readers can see the relationship between “SGE end of day prices and premiums”.

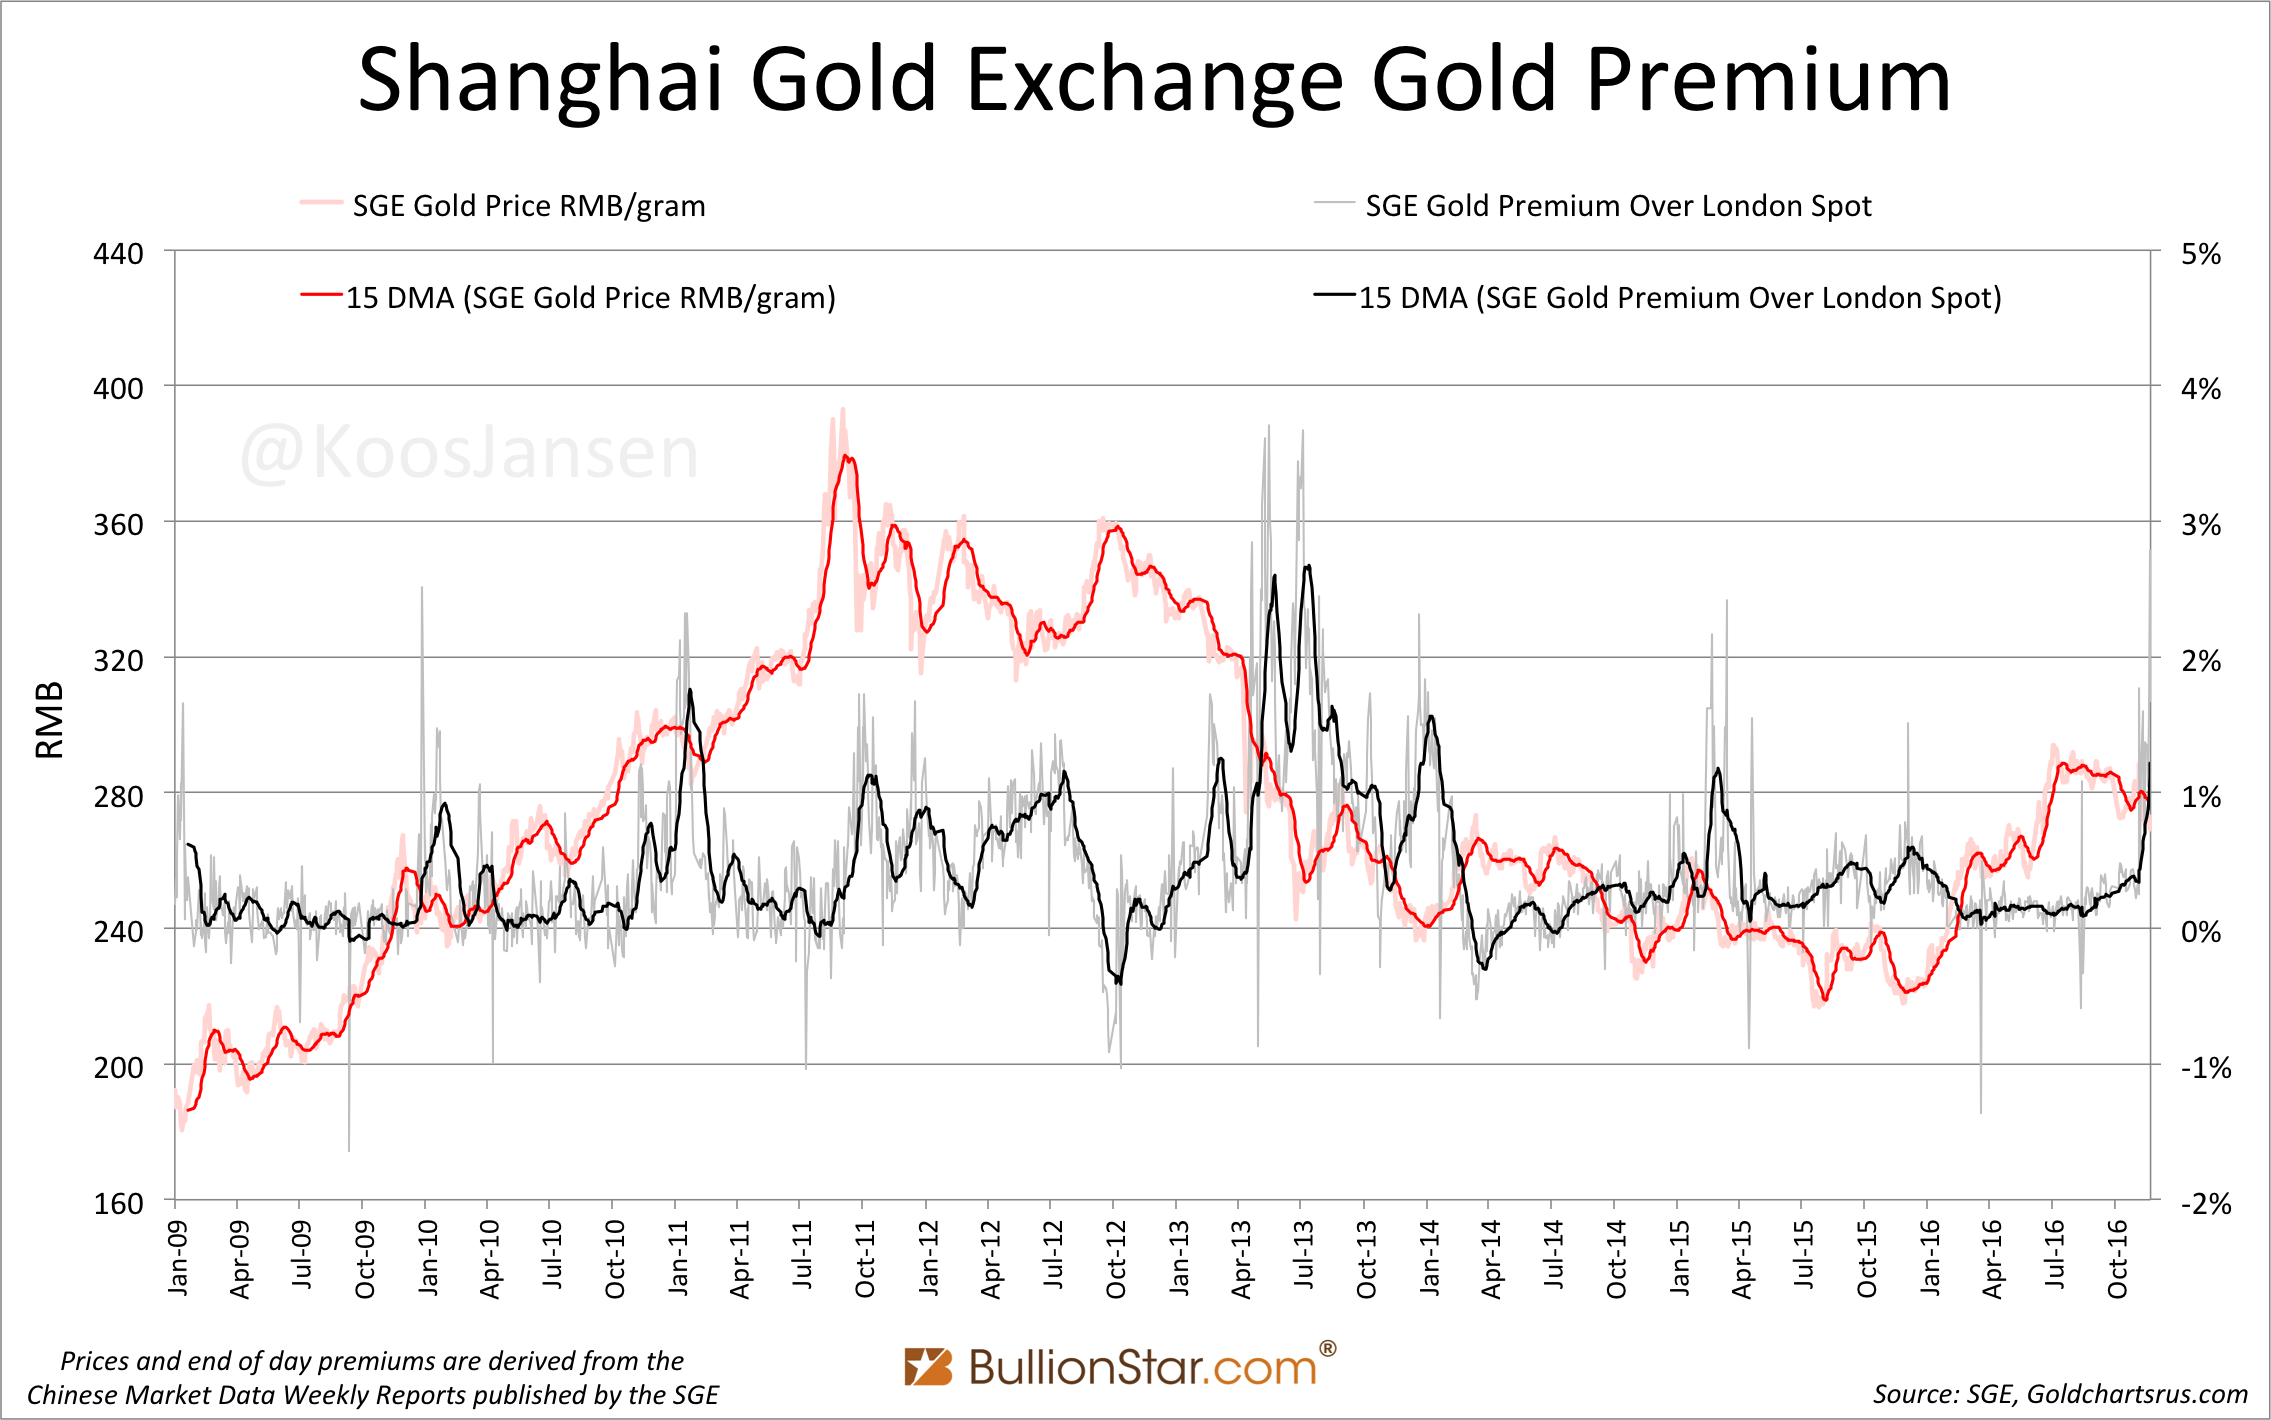
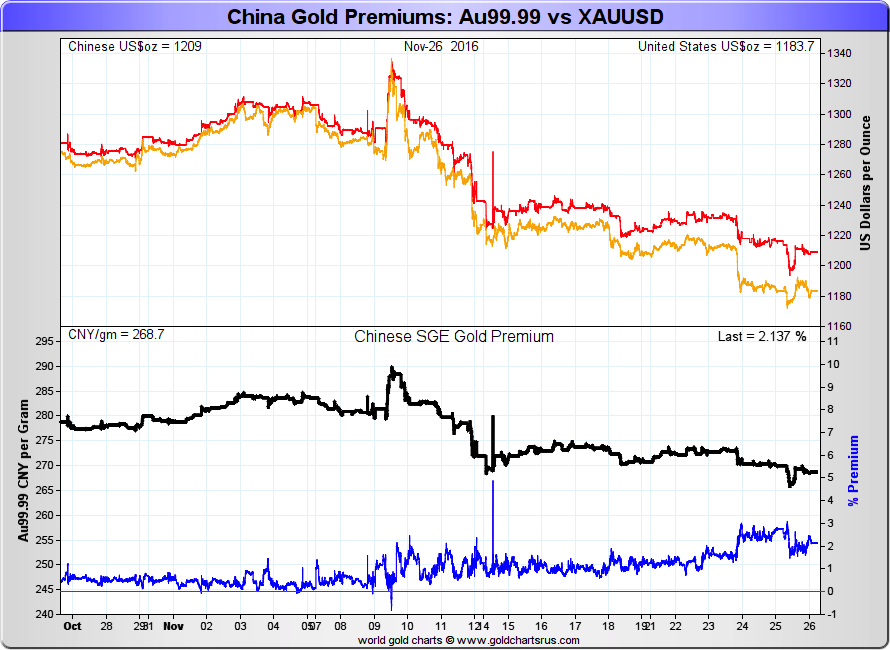
Note, the gold price on the SGE and the premium have an inverse correlation.
I already mentioned that SGE withdrawals in the first nine months of 2016 have been subdued due to a rally in the gold price. However, high premiums at the SGE in November forecast elevated withdrawals for the month. Since Trump got elected on November 9, and price of gold started tumbling, SGE premiums have broken a three-year record. This signals strong demand.
In the next chart from Goldchartsrus.com we can see the premium on the SGE’s most traded physical contract Au99.99 has risen since November 9 and reached 3 % by 24 November. Levels not seen since 2013 (exhibit 8).
Although the relationship between the gold price and SGE premiums has been in place for years, Reuters reports the high premiums in November are caused by worries on import restrictions. From Reuters:
Gold premiums in top consumer China jumped to the highest in nearly three years this week on worries over a supply shortage that traders said were due to Beijing’s efforts to restrict import licenses.
…
“While we don’t have the exact numbers, we hear that they (Chinese government) have limited the number of importers," said Dick Poon, general manager at Heraeus Precious Metals in Hong Kong.
To me this statement doesn’t make sense. At this moment that are 15 banks approved by the PBOC to import gold. Limiting the number of importers would cause less importers to import more gold in order to balance the domestic market (supply gold from abroad when necessary). In the Measures for the Import and Export of Gold and Gold Products drafted by the PBOC in March 2015 it states:
… An applicant for the import … of gold … shall have corporate status, … it is a financial institution member or a market maker on a gold exchange [SGE] approved by the State Council.
… The main market players with the qualifications for the import … of gold shall assume the liability of balancing the supply and demand of material objects on the domestic gold market. Gold to be imported … shall be registered at a spot gold exchange [SGE] approved by the State Council where the first trade shall be completed.
The Chinese government could lower imports by distributing less “import licences" to approved banks. As, every approved bank still needs to submit for a license for every gold import batch. Logically, lowering imports would be done by the PBOC through handing out less licences.
There shall be one Import … License of the People’s Bank of China for … Gold Products for each batch … and the License shall be used within 40 work days since the issuing date.
If the PBOC wanted to lower imports, it would simply hand out less licences. No need to “limit the number of importers".
Either way, I expect SGE withdrawals to be strong for November.
Popular Blog Posts by Koos Jansen
 China’s Secret Gold Supplier is Singapore
 Audits of U.S. Monetary Gold Severely Lack Credibility
 China Gold Import Jan-Sep 797t. Who’s Supplying?
 The Gold-Backed-Oil-Yuan Futures Contract Myth
 Estimated Chinese Gold Reserves Surpass 20,000t
 PBOC Gold Purchases: Separating Facts from Speculation
 U.S. Mint Releases New Fort Knox Audit Documentation
 China Net Imported 1,300t of Gold in 2016
 Why SGE Withdrawals Equal Chinese Gold Demand and Why Not