
China’s Secret Gold Supplier is Singapore

 Koos Jansen
Since 2013 China continues to absorb physical gold from the rest of the world at a staggering pace. Worth noting is that gold imported into the Chinese domestic market is not allowed to be returned in the foreseeable future. Because ownership and the disposition of these volumes of gold likely will be of great importance next time around the international monetary system is under stress, it’s well worth tracking China’s progress of imports – especially because the mainstream media and most consultancy firms are in denial of these events.
Click on this link for an in-depth analysis of the structure of the Chinese gold market.
Below we’ll discuss what countries supplied gold to China in 2017, Singapore’s role not only in 2017 but in the past few years, and physical flows through the vaults of the Shanghai Gold Exchange International Board in the Shanghai Free Trade Zone (SFTZ). We’ll see that Singapore has been a major gold supplier to China since 2013, which was previously not publicly known. In addition, my theory is that physical flows through the SFTZ have recently increased, signaling the slow birth of an international gold trading hub in Shanghai.
Most readers will be aware that the easiest way to gauge Chinese wholesale gold demand is by the amount of metal withdrawn from the vaults of Shanghai Gold Exchange (SGE). The problem is that withdrawals from the SGE Main Board in the domestic market and withdrawals from SGE International Board (SGEI) in the SFTZ are published as a single figure: SGE(I) withdrawals. Accordingly, SGE(I) withdrawals are a handsome indicator for physical turnover in China, but don’t inform us on the details of what unfolds in the domestic market separately from the SFTZ. Any metal in the SFTZ is allowed to be exported and thus part of the world’s floating supply. To get the best understanding of physical flows in and through China we have to study international merchandise trade statistics, and add a few other data points, before we can put all pieces together.
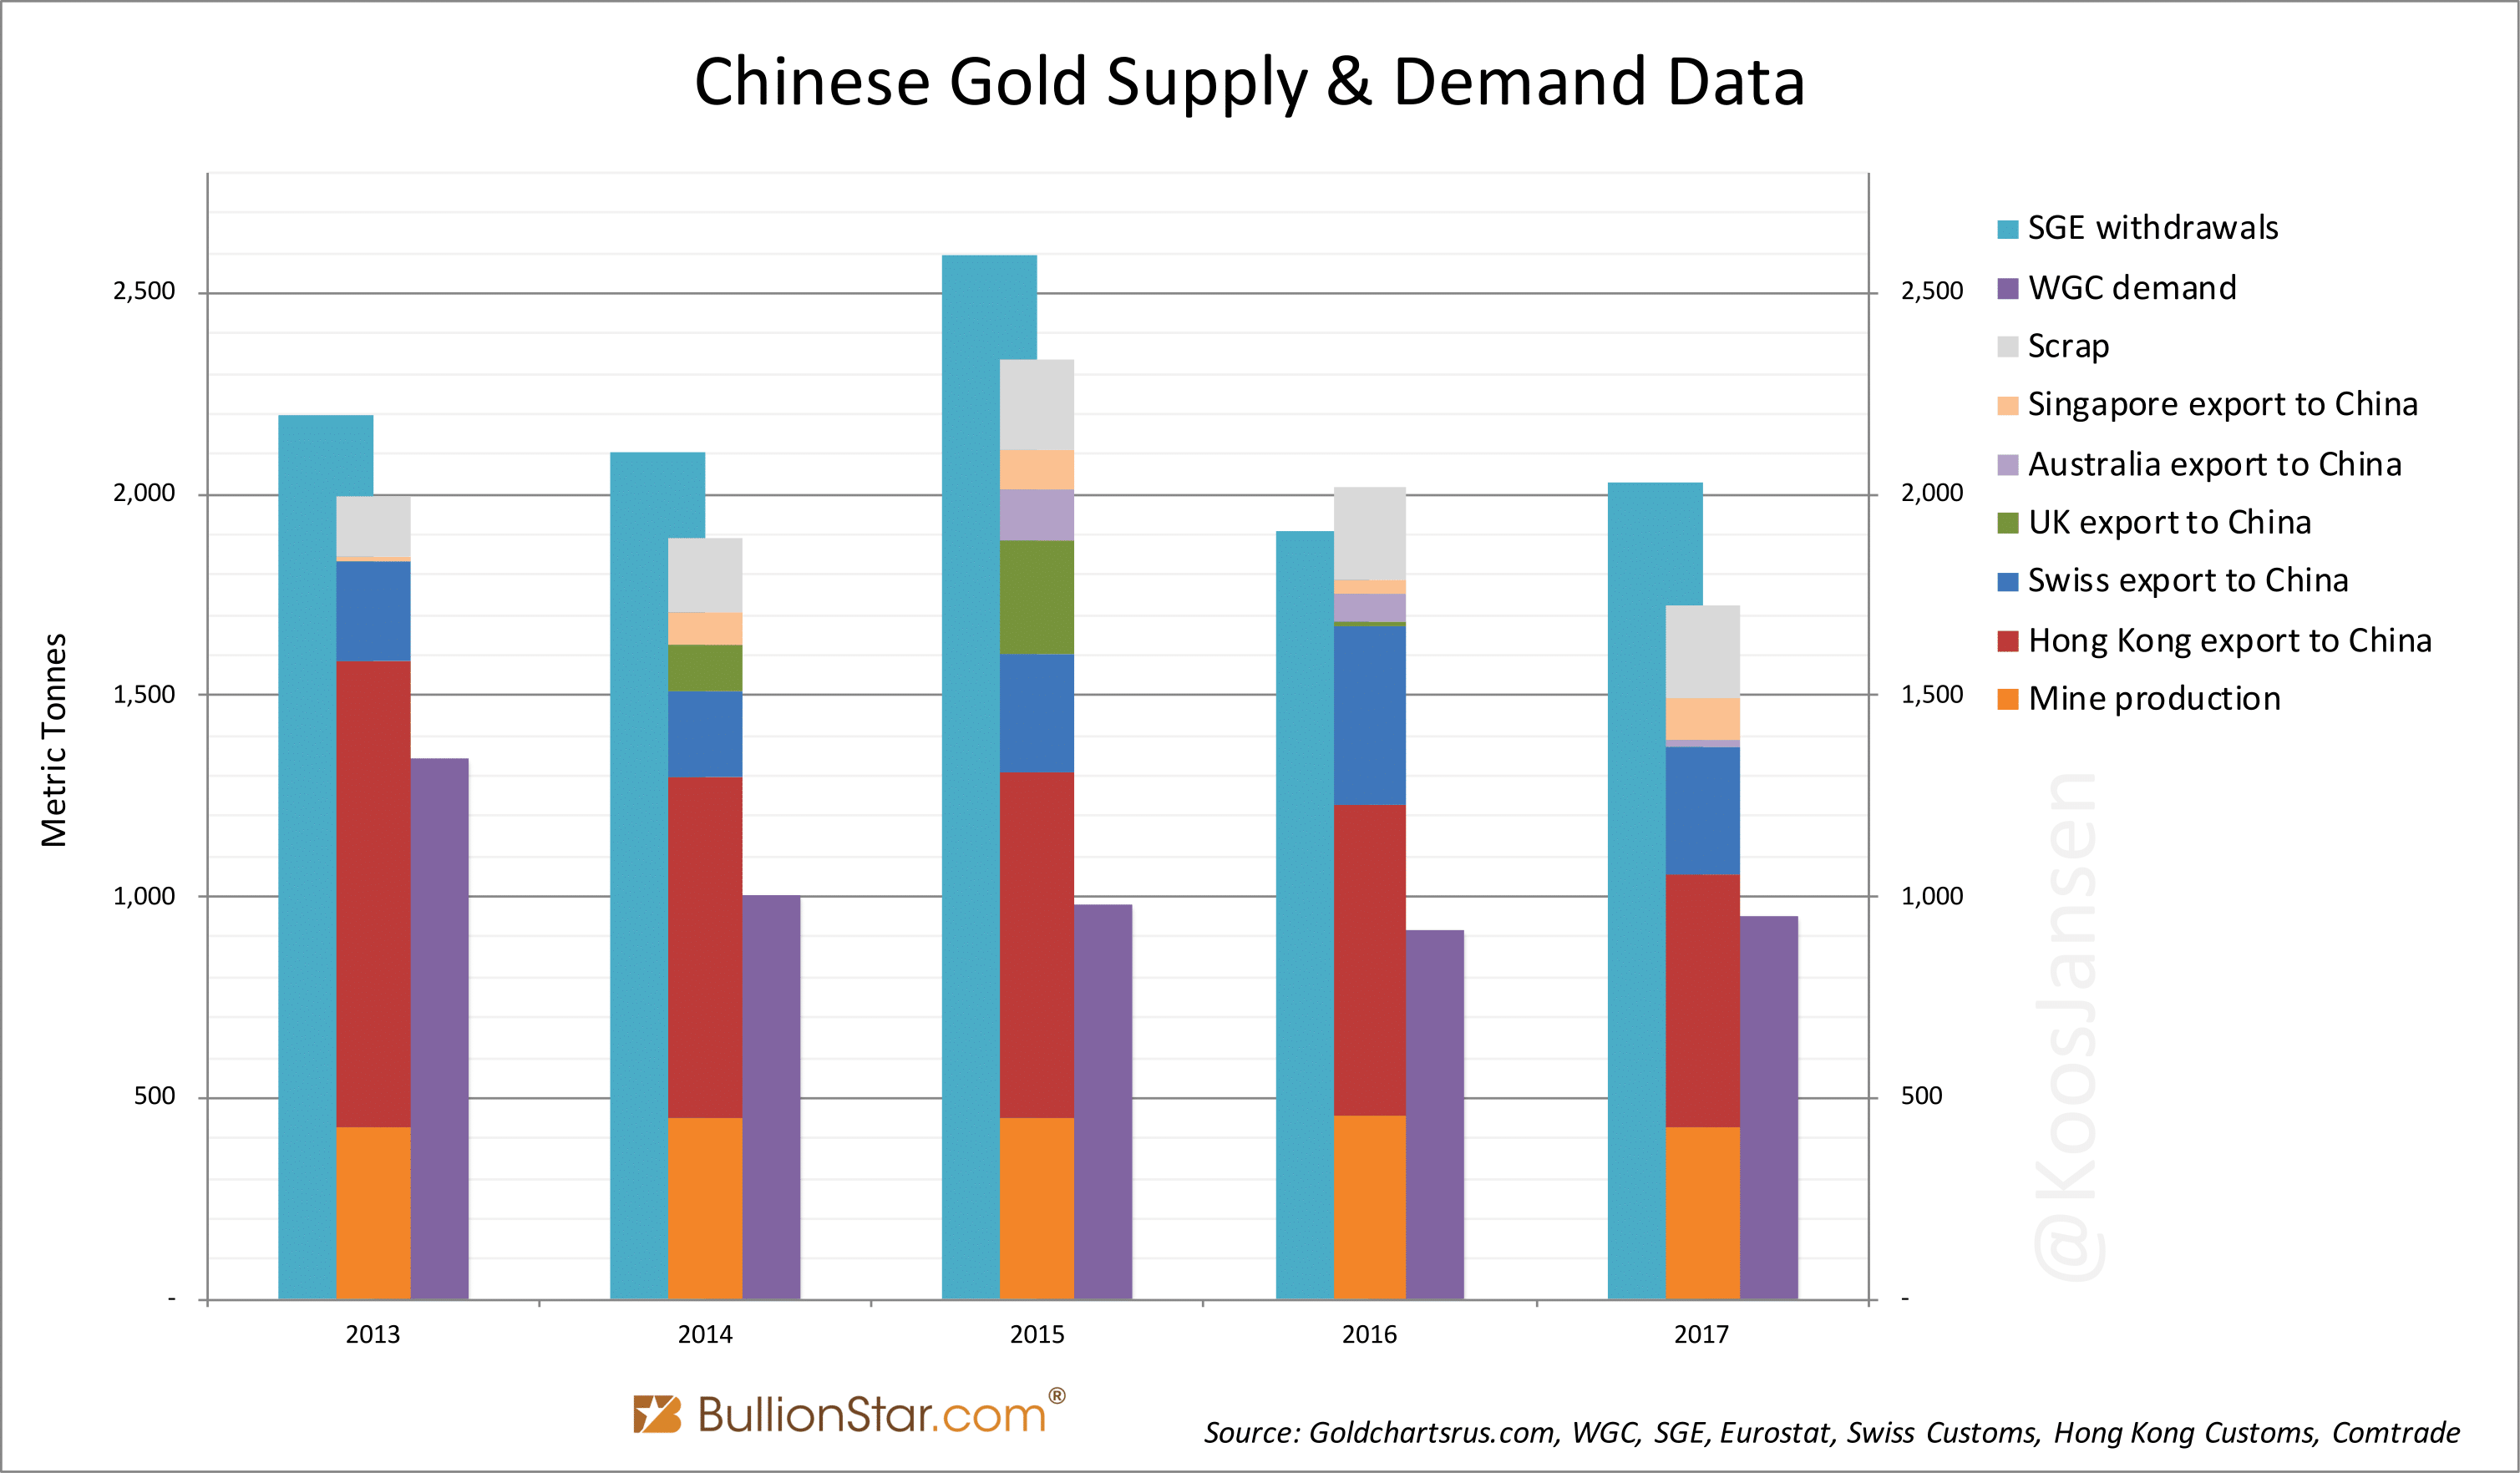
SGE(I) withdrawals in 2017 accounted for 2,030 tonnes, which was up 6 % from 2016; my (provisional) estimate of Chinese net gold import for 2017 is 1,082 tonnes, down 19 % from 2016; the China Gold Association has disclosed domestic mine production at 426 tonnes, which was 6 % less than the year before. Effectively, in 2017 SGE(I) withdrawals increased while imports and mine supply declined. Either there was an increase in recycled gold flowing through the Main Board, or more metal was withdrawn and exported from the International Board. Let’s have a closer look at Chinese imports and exports.
Chinese cross-border gold trade is notoriously difficult to measure as these numbers are omitted from China’s customs data. The best approach is to sum up all the flows of the countries that trade gold with China. Traditionally, Hong Kong has been the main conduit to the mainland. Not many years ago most analysts simply used Hong Kong net exports to China as a proxy for total Chinese imports. Since 2013, however, Hong Kong’s market share has steadily declined. In 2017 Hong Kong net exported 628 tonnes to China, which was about 58 % of what the mainland net absorbed.
The second largest net exporter to China in 2017 was Switzerland. The Swiss delivered (29 % of the cake at) 316 tonnes, nearly 30 % less than in 2016. Needless to say, Switzerland is one the largest gold trading hubs globally and gold moving from the Swiss refineries directly to the mainland is supplied from a host of other sources.
Direct gold export from Australia has been released up until June by free data provider COMTRADE. Though provisional, Australia’s shipments account for 20 tonnes (which is 40 tonnes annualized).
This is the first time that I report on Singapore’s gold trade data, despite Singapore’s significant growth in market share in recent years. When BullionStar first purchased trade statistics from Statlink Singapore in 2015, the data contained mismatches between the value and the weight reported, which made us unsure about the accuracy of the numbers. And hence we refrained from publishing them. However, these figures have now been revised and we can finally analyze what happened all the way back to 2013.
I’ll start by showing the previous mismatches and then explain what has changed. The numbers we got in 2015 disclosed that Singapore exported gold worth 108 million Singapore dollars (SGD) and weighing 101 tonnes to China in 2014. 108 million SGD translates into 85 million US dollars, which can be computed into 2 metric tonnes when divided by the annual average USD gold price. The mismatch between the value and weight reported was thus 99 tonnes (101 – 2 = 99).
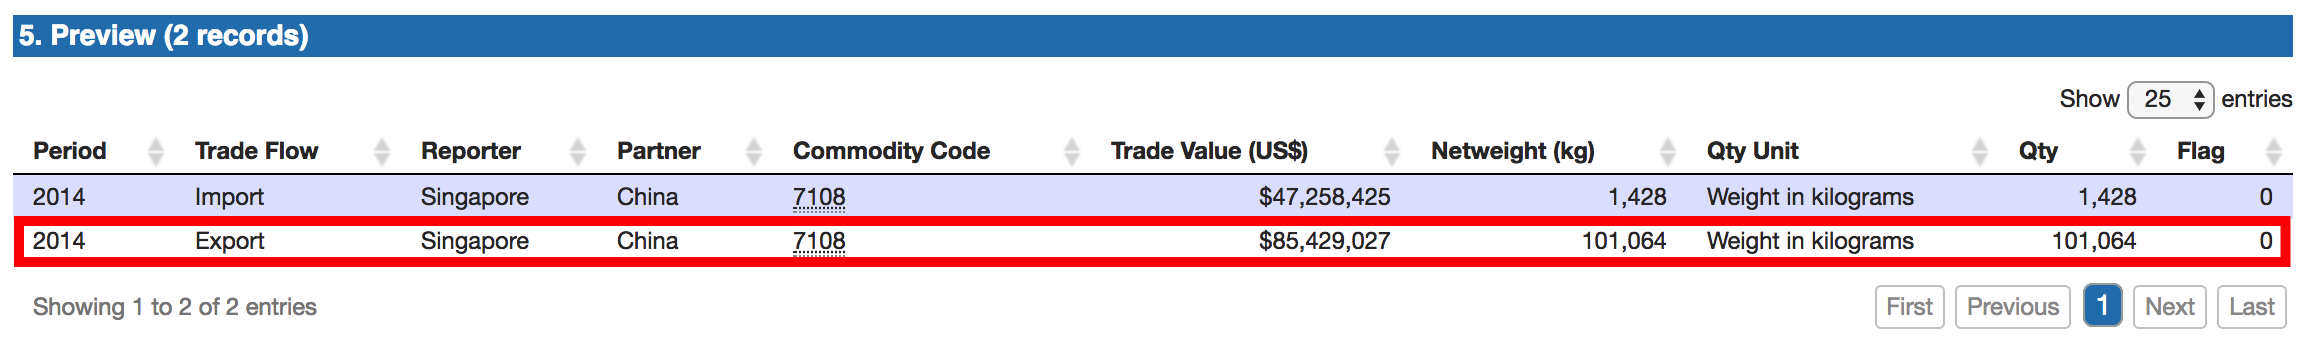
At free trade data provider COMTRADE the mismatch is still visible (late March 2018). About 85 million USD versus 101 metric tonnes. Mismatches of this magnitude render the data useless.
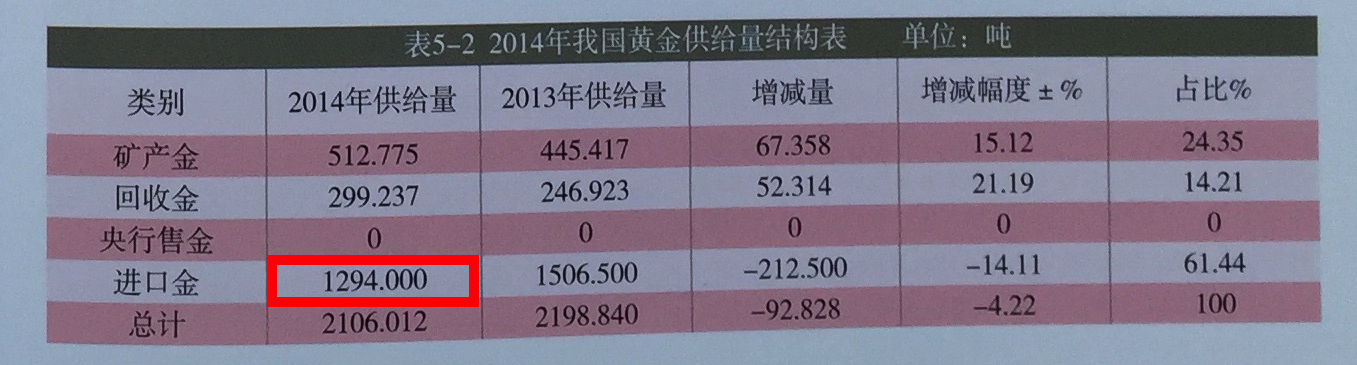
Although a report I got my hands on by the China Gold Association (CGA) disclosed China net imported 1,294 tonnes in 2014, and all data from gold exporters to China aggregated to 1,194 tonnes, I couldn’t proof how much came from Singapore.
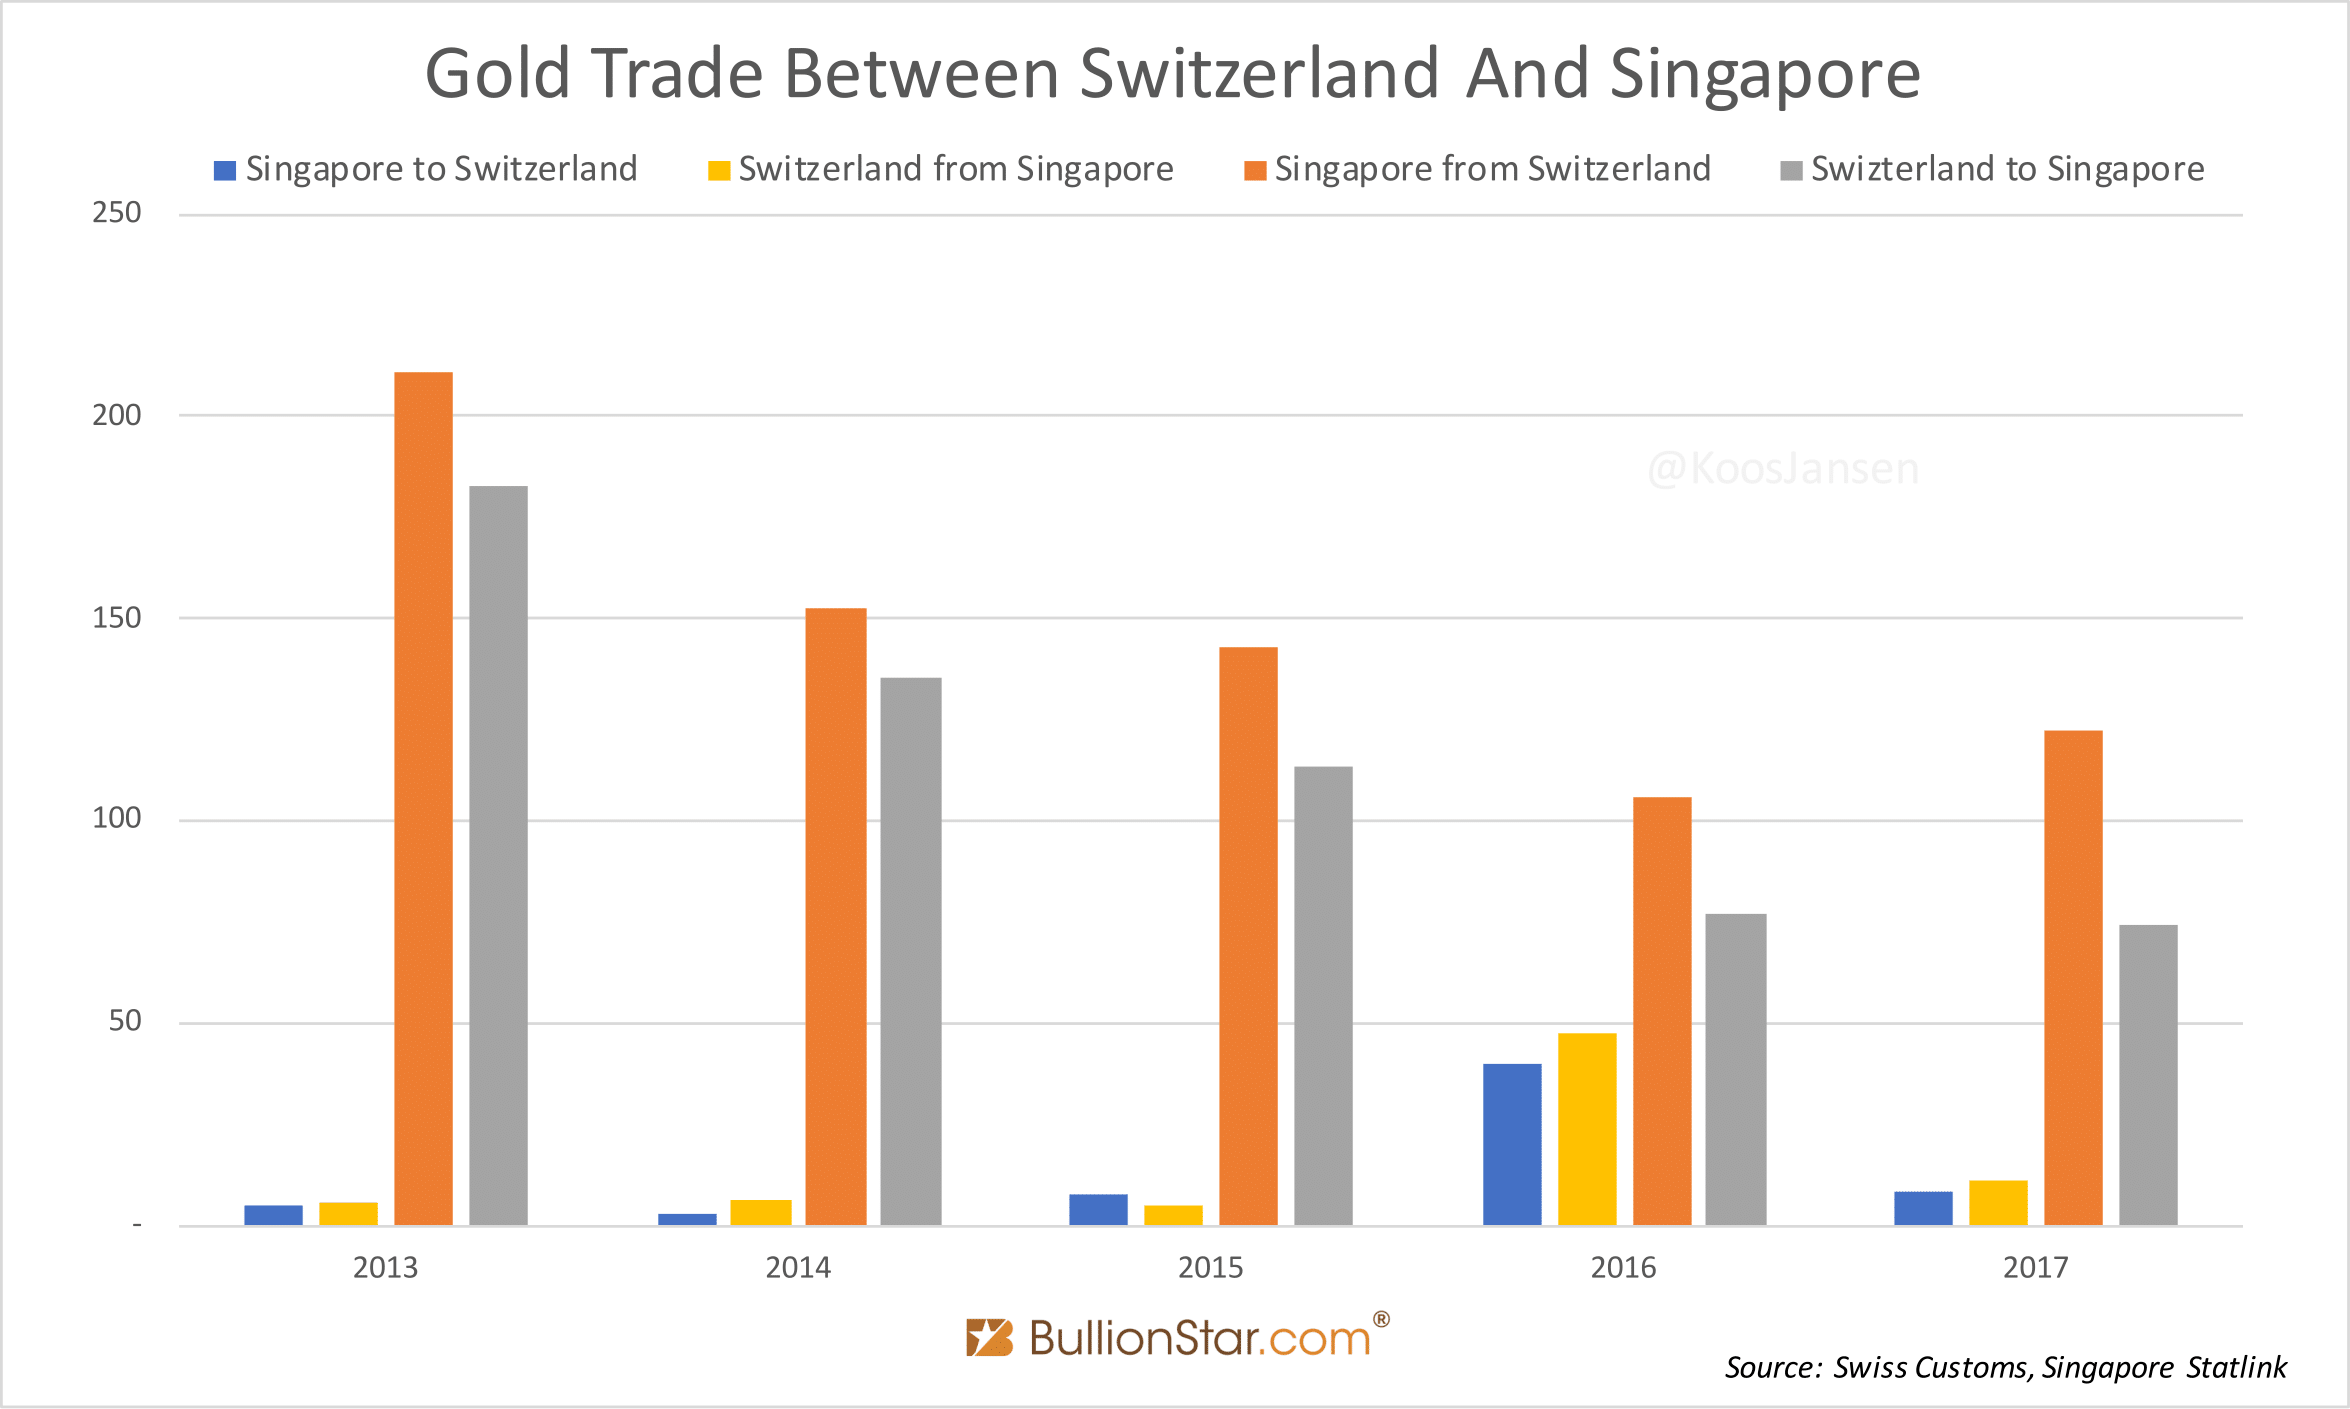
Thereby, the data from Singapore in no way matched with the data from, for example, Switzerland. What the Swiss reported to have sent to Singapore didn’t match what Singapore reported to have received from Switzerland. Several inquiries from BullionStar at Singapore Statlink produced no results.
Earlier this year (2018) I read a comment by Thomson Reuters GFMS on the physical gold flows through Singapore. The report mentioned elevated throughput, especially to China, so I decided to purchase the Statlink numbers once again. What I found is that they revised their gold trade numbers denominated in SGD (while the revised data doesn’t include weights). From the looks of it everything makes a lot more sense now. If we compare the revised gold trade data from Singapore with Switzerland now the match is as good as it gets.
The revised data from Statlink with respect to Singapore’s exports to China looks reliable as well. When computing the tonnage from the SGD values, the new data suggests Singapore net exported 78 tonnes to China in 2014. When added to the net exports from other countries, the total (78 + 1,194 = 1,272 tonnes) comes close to what’s disclosed by the CGA as total imports (1,294 tonnes, exhibit 3). The residual gold can have been imported as a by-product in base metal ores and concentrates.
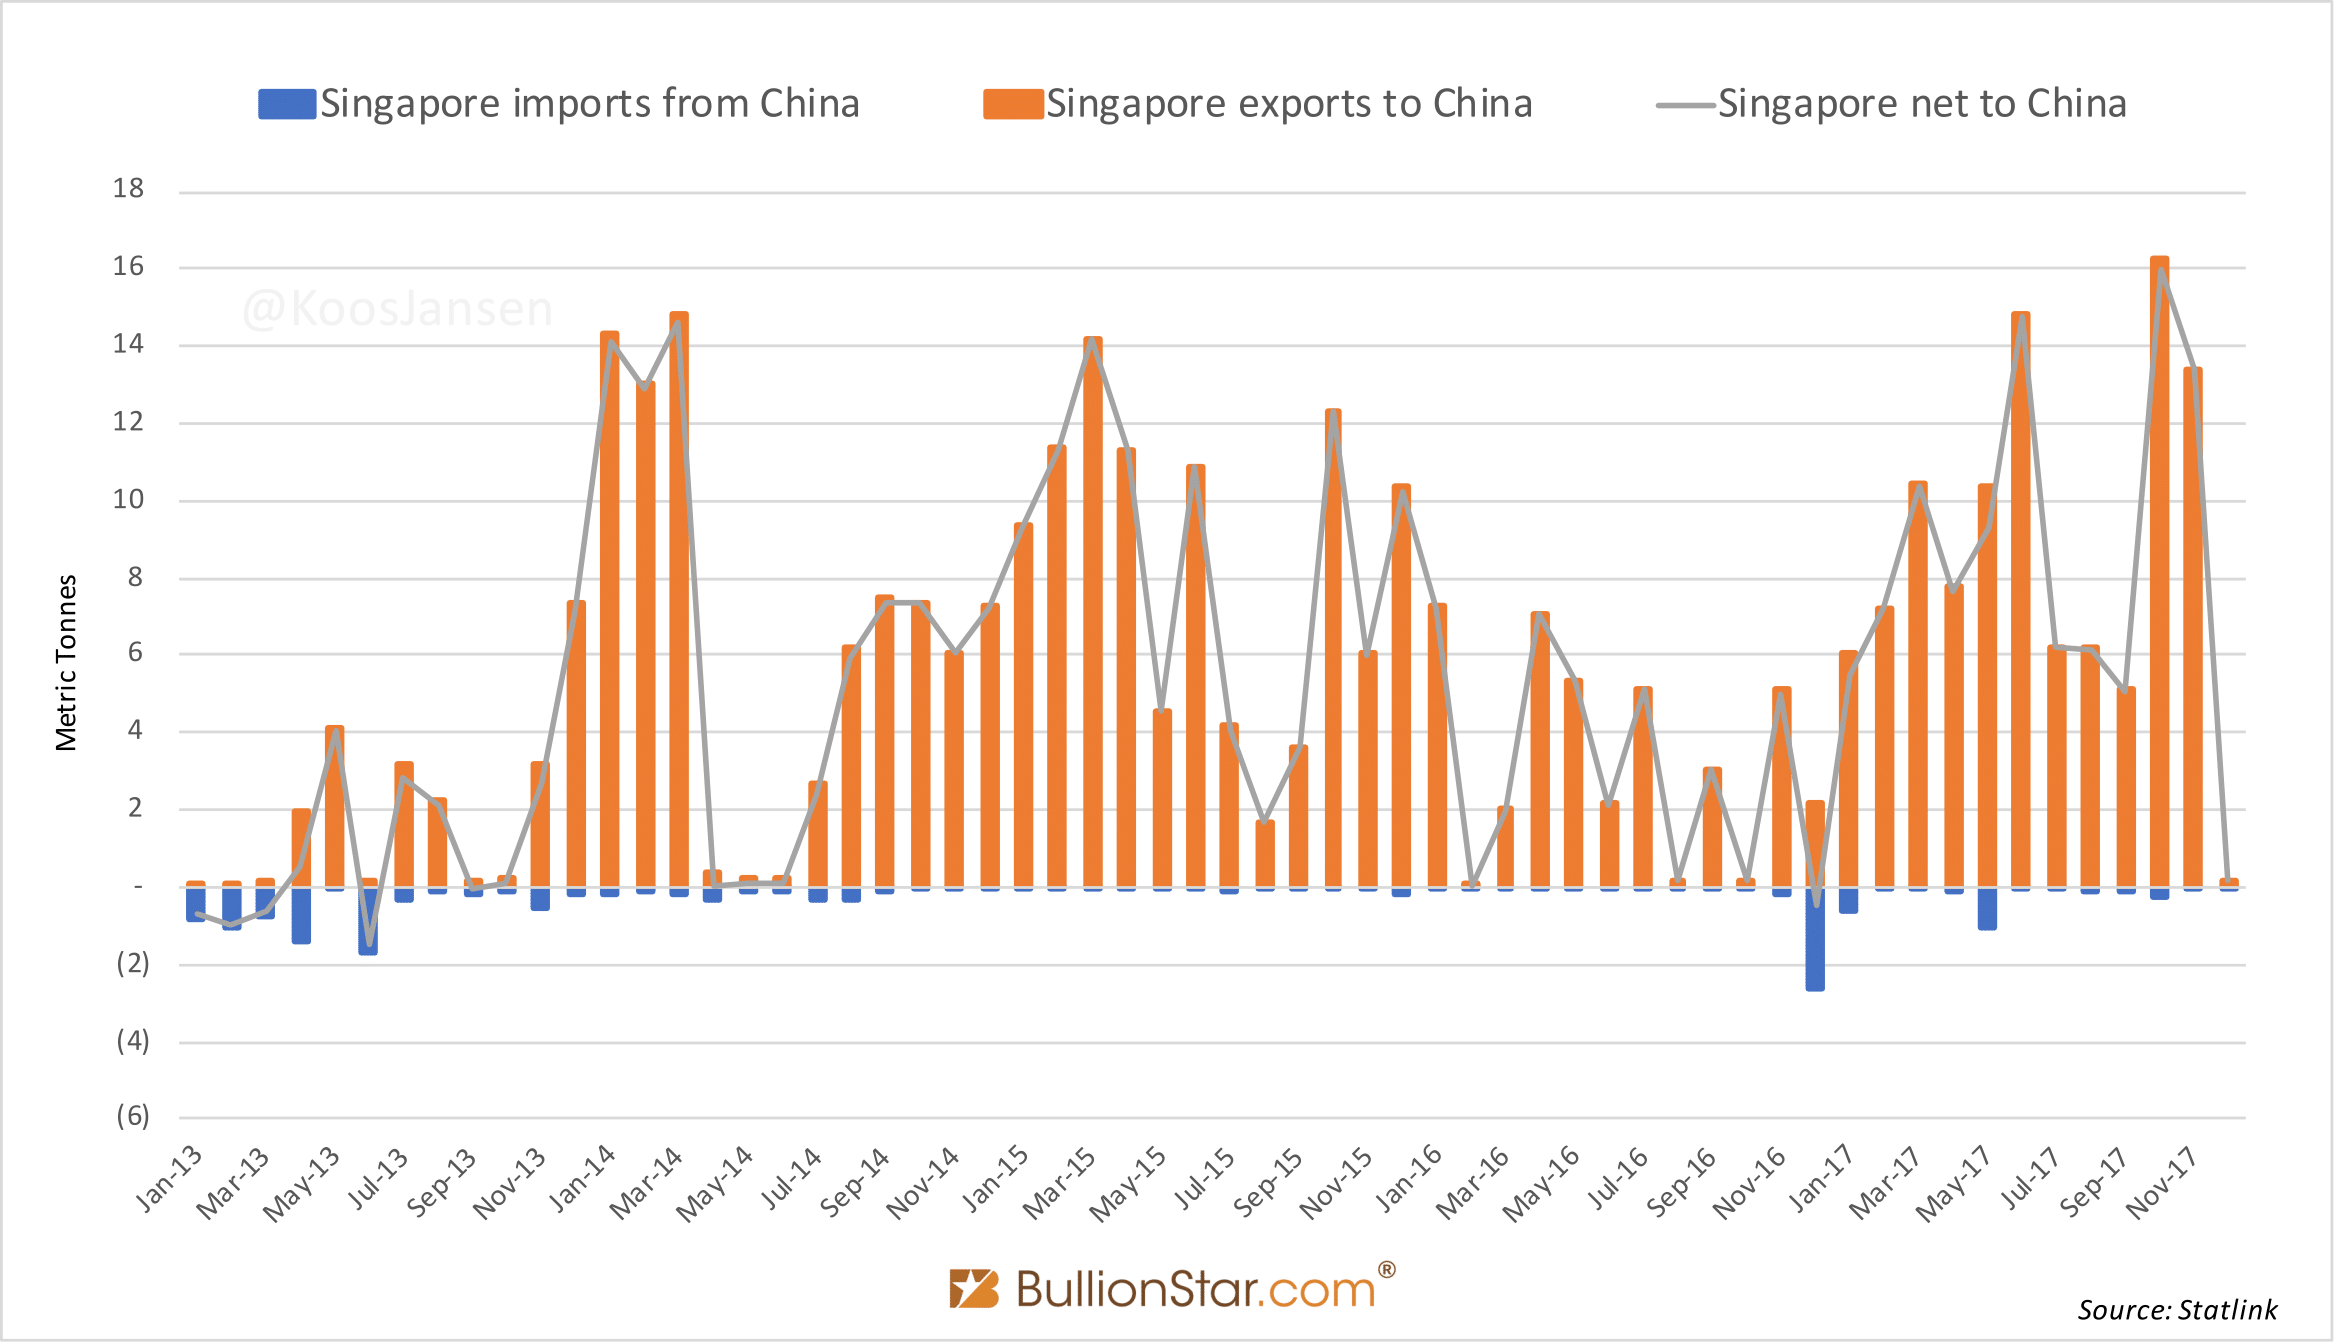
The revised numbers from Singapore shine a new light on Chinese imports. Tellingly, Singapore has been a massive exporter to China since 2013. According to Statlink, Singapore net exported 102 tonnes to China in 2017, a record year and up 177 % from 2016.
Chinese domestic mine output (426 tonnes) plus net imports (1,082 tonnes) plus scrap (estimated at 233 tonnes) for 2017 nearly match SGE withdrawals, as can be seen in the chart below. My theory is that the remaining deficit – in the chart displayed by the difference in heights of the left and middle columns – is related to the surplus in 2016. Allow me to explain.
One of the largest direct net exporters to China in 2014 and 2015 was the UK. Before that, the UK (LBMA) supplied gold to China only indirectly via Switzerland and Hong Kong. In April 2014 bullion banks commenced shipping bullion directly to China mainland, though in 2016 the flow not only stopped, it went into reverse. 2017 was the first year wherein China was a net exporter to London! No staggering numbers, but still, 11 tonnes were moved to the UK last year. To me this indicates activity at the SGEI.
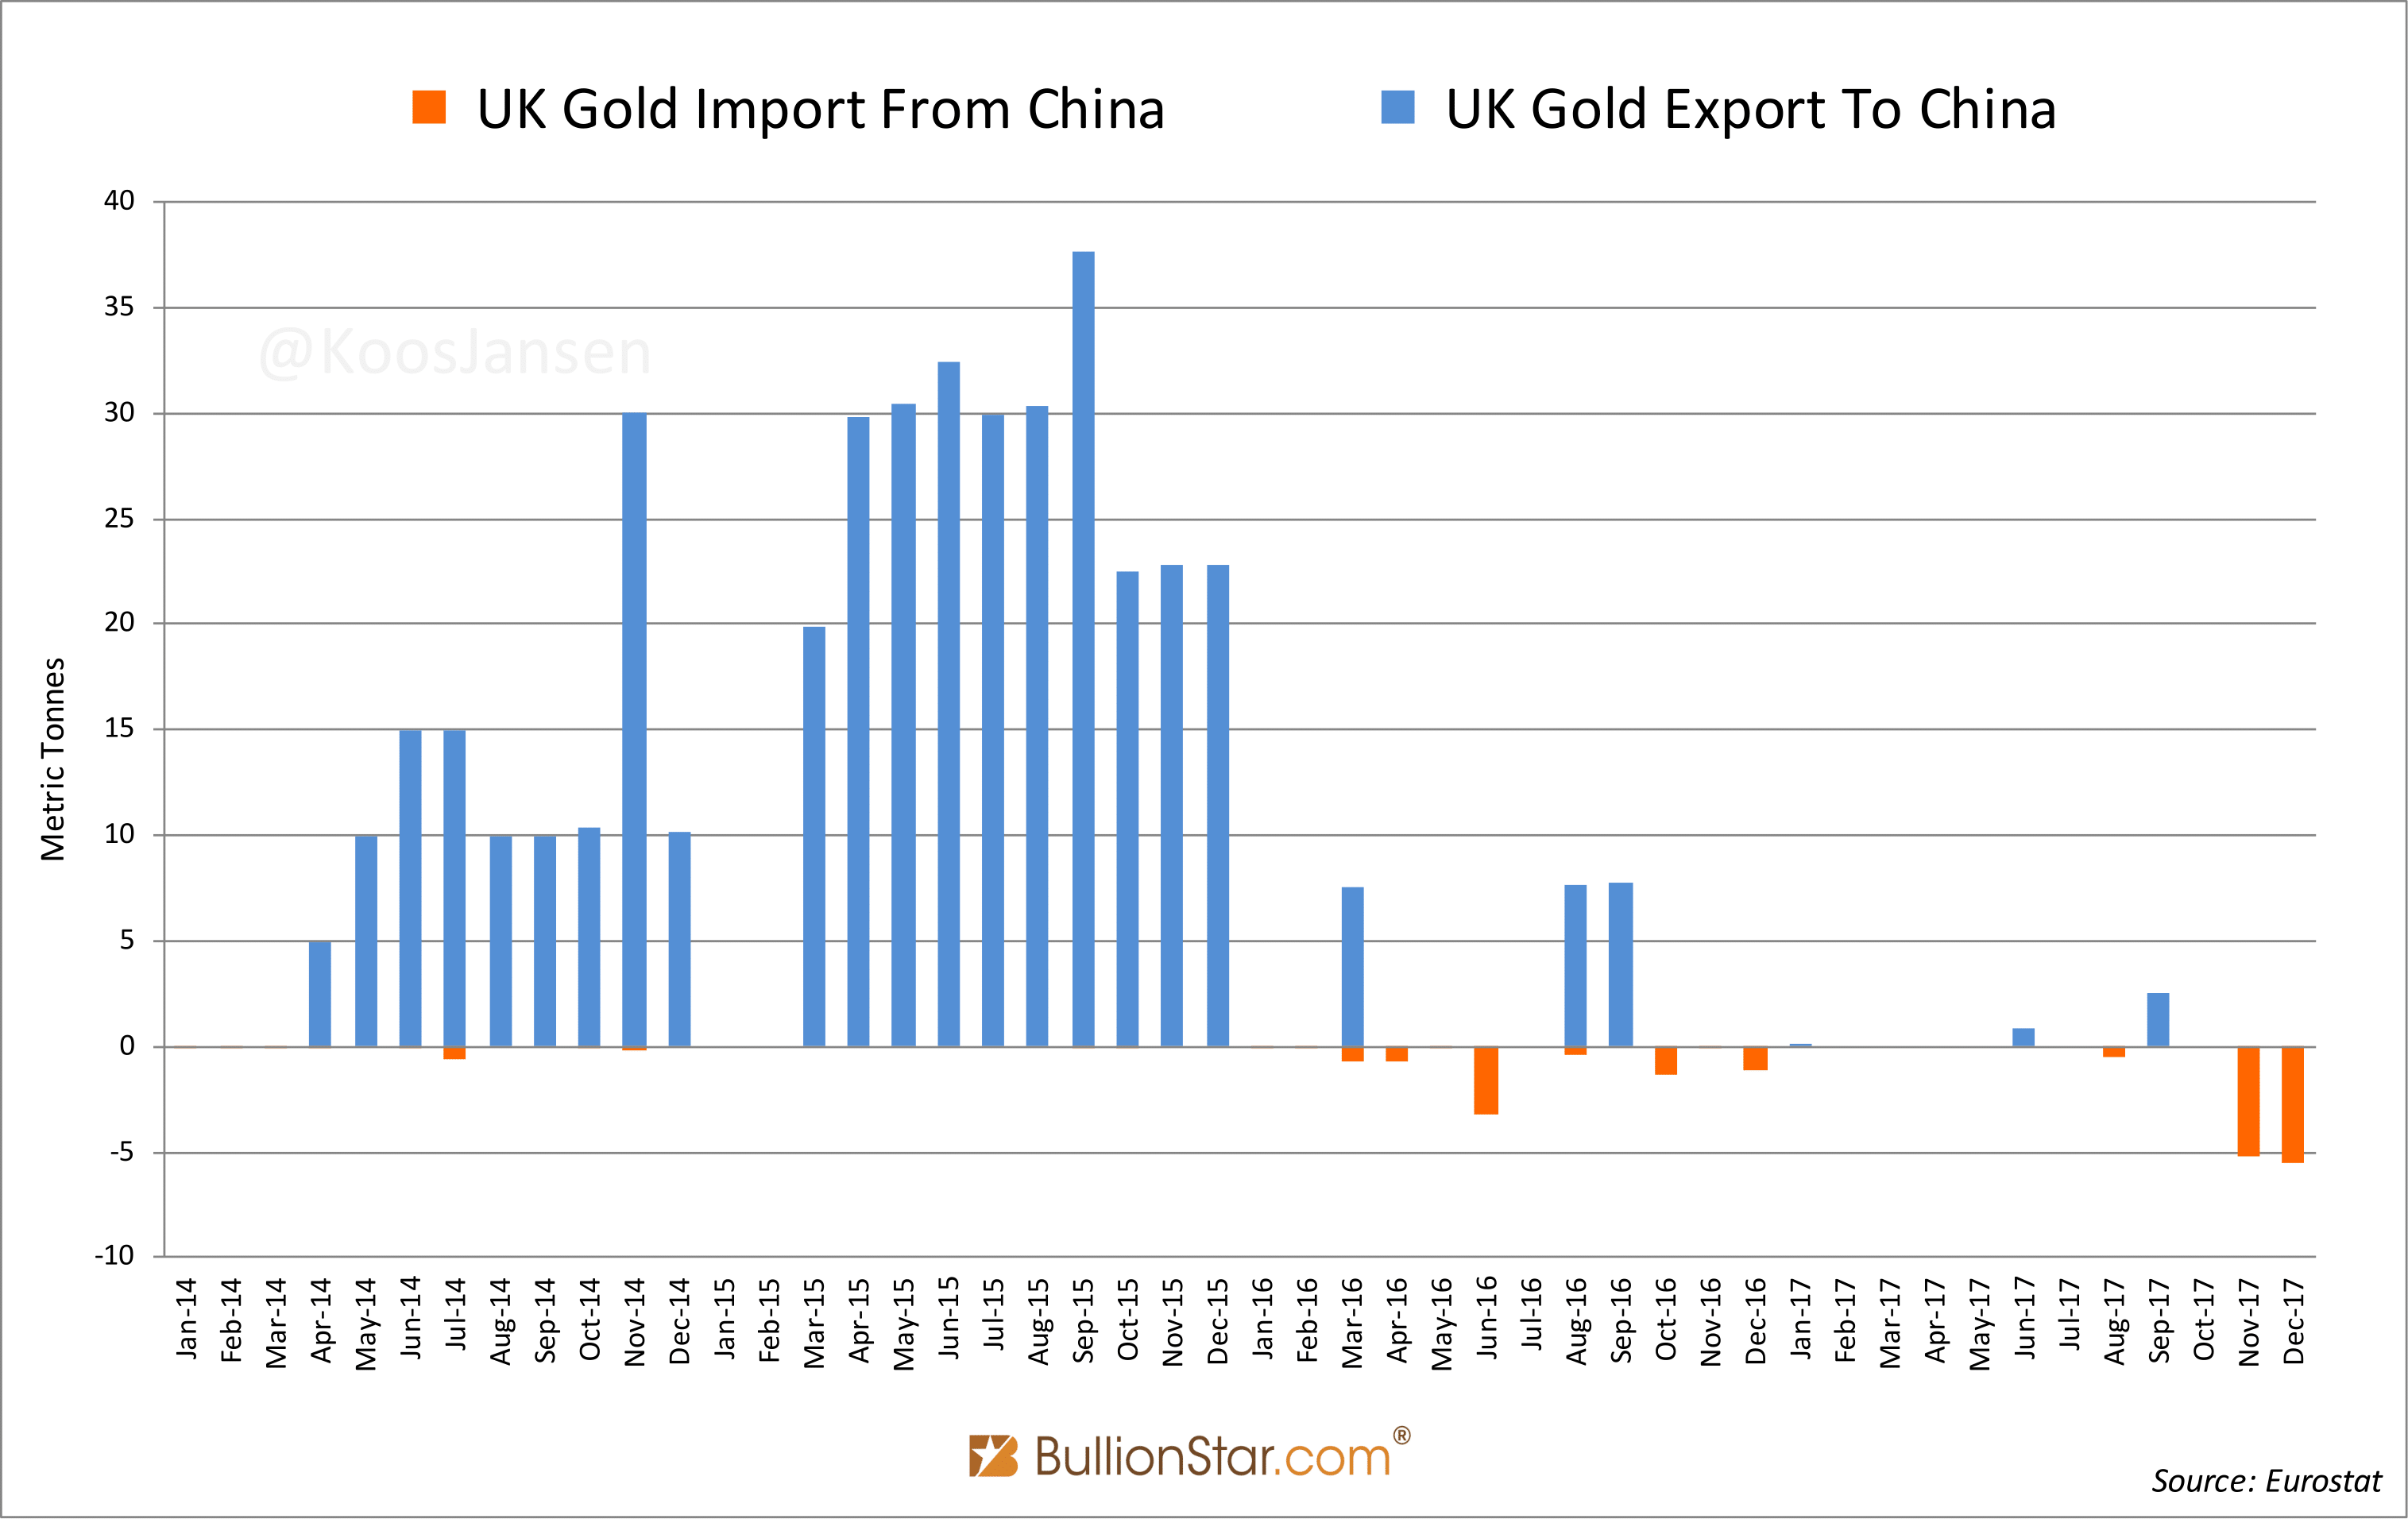
Because gold can only be exported from Free Tarde Zones in China my guess is that since 2016 inventory in SGEI vaults has mushroomed (exhibit 5). Subsequently, in 2017 metal has been withdrawn from SGEI vaults as demonstrated by, (i) net exports to the UK and, (ii) a deficit between SGE(I) withdrawals and total supply somewhat larger than in 2013, 2014 and 2015, but right after a supply surplus in 2016 (exhibit 5). I also don’t rule out China is exporting small tonnages from the SFTZ to countries in Asia, trades that might not show up in global customs data.
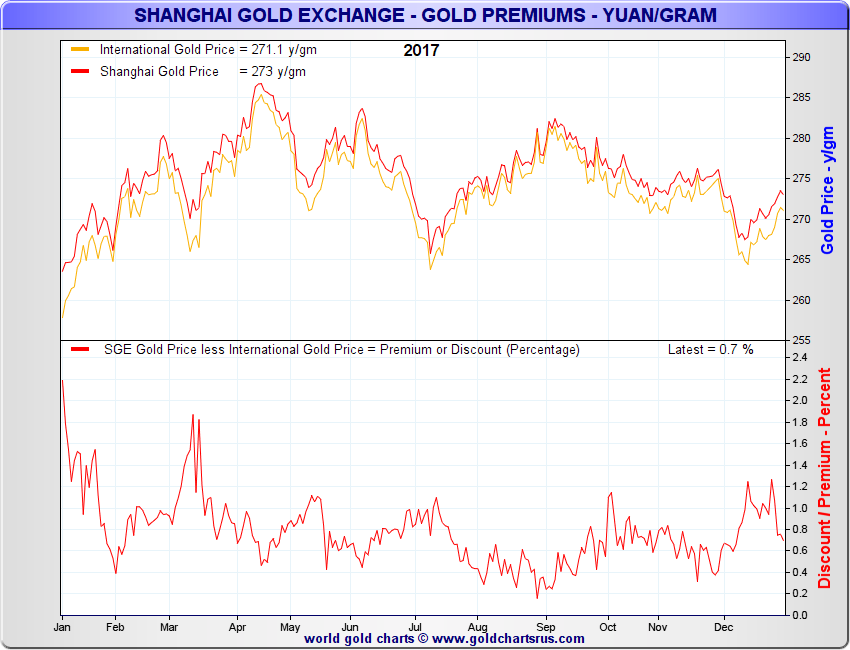
I’m not expecting any explosive exports from the SFTZ, as the premium in Shanghai over London is mostly positive so it makes sense to ship it from West to East, not the other way around. In the next chart by Goldchartrus.com we can see the end of day premiums which have been positive all through 2017 (needless to say, intraday discounts can have occurred).
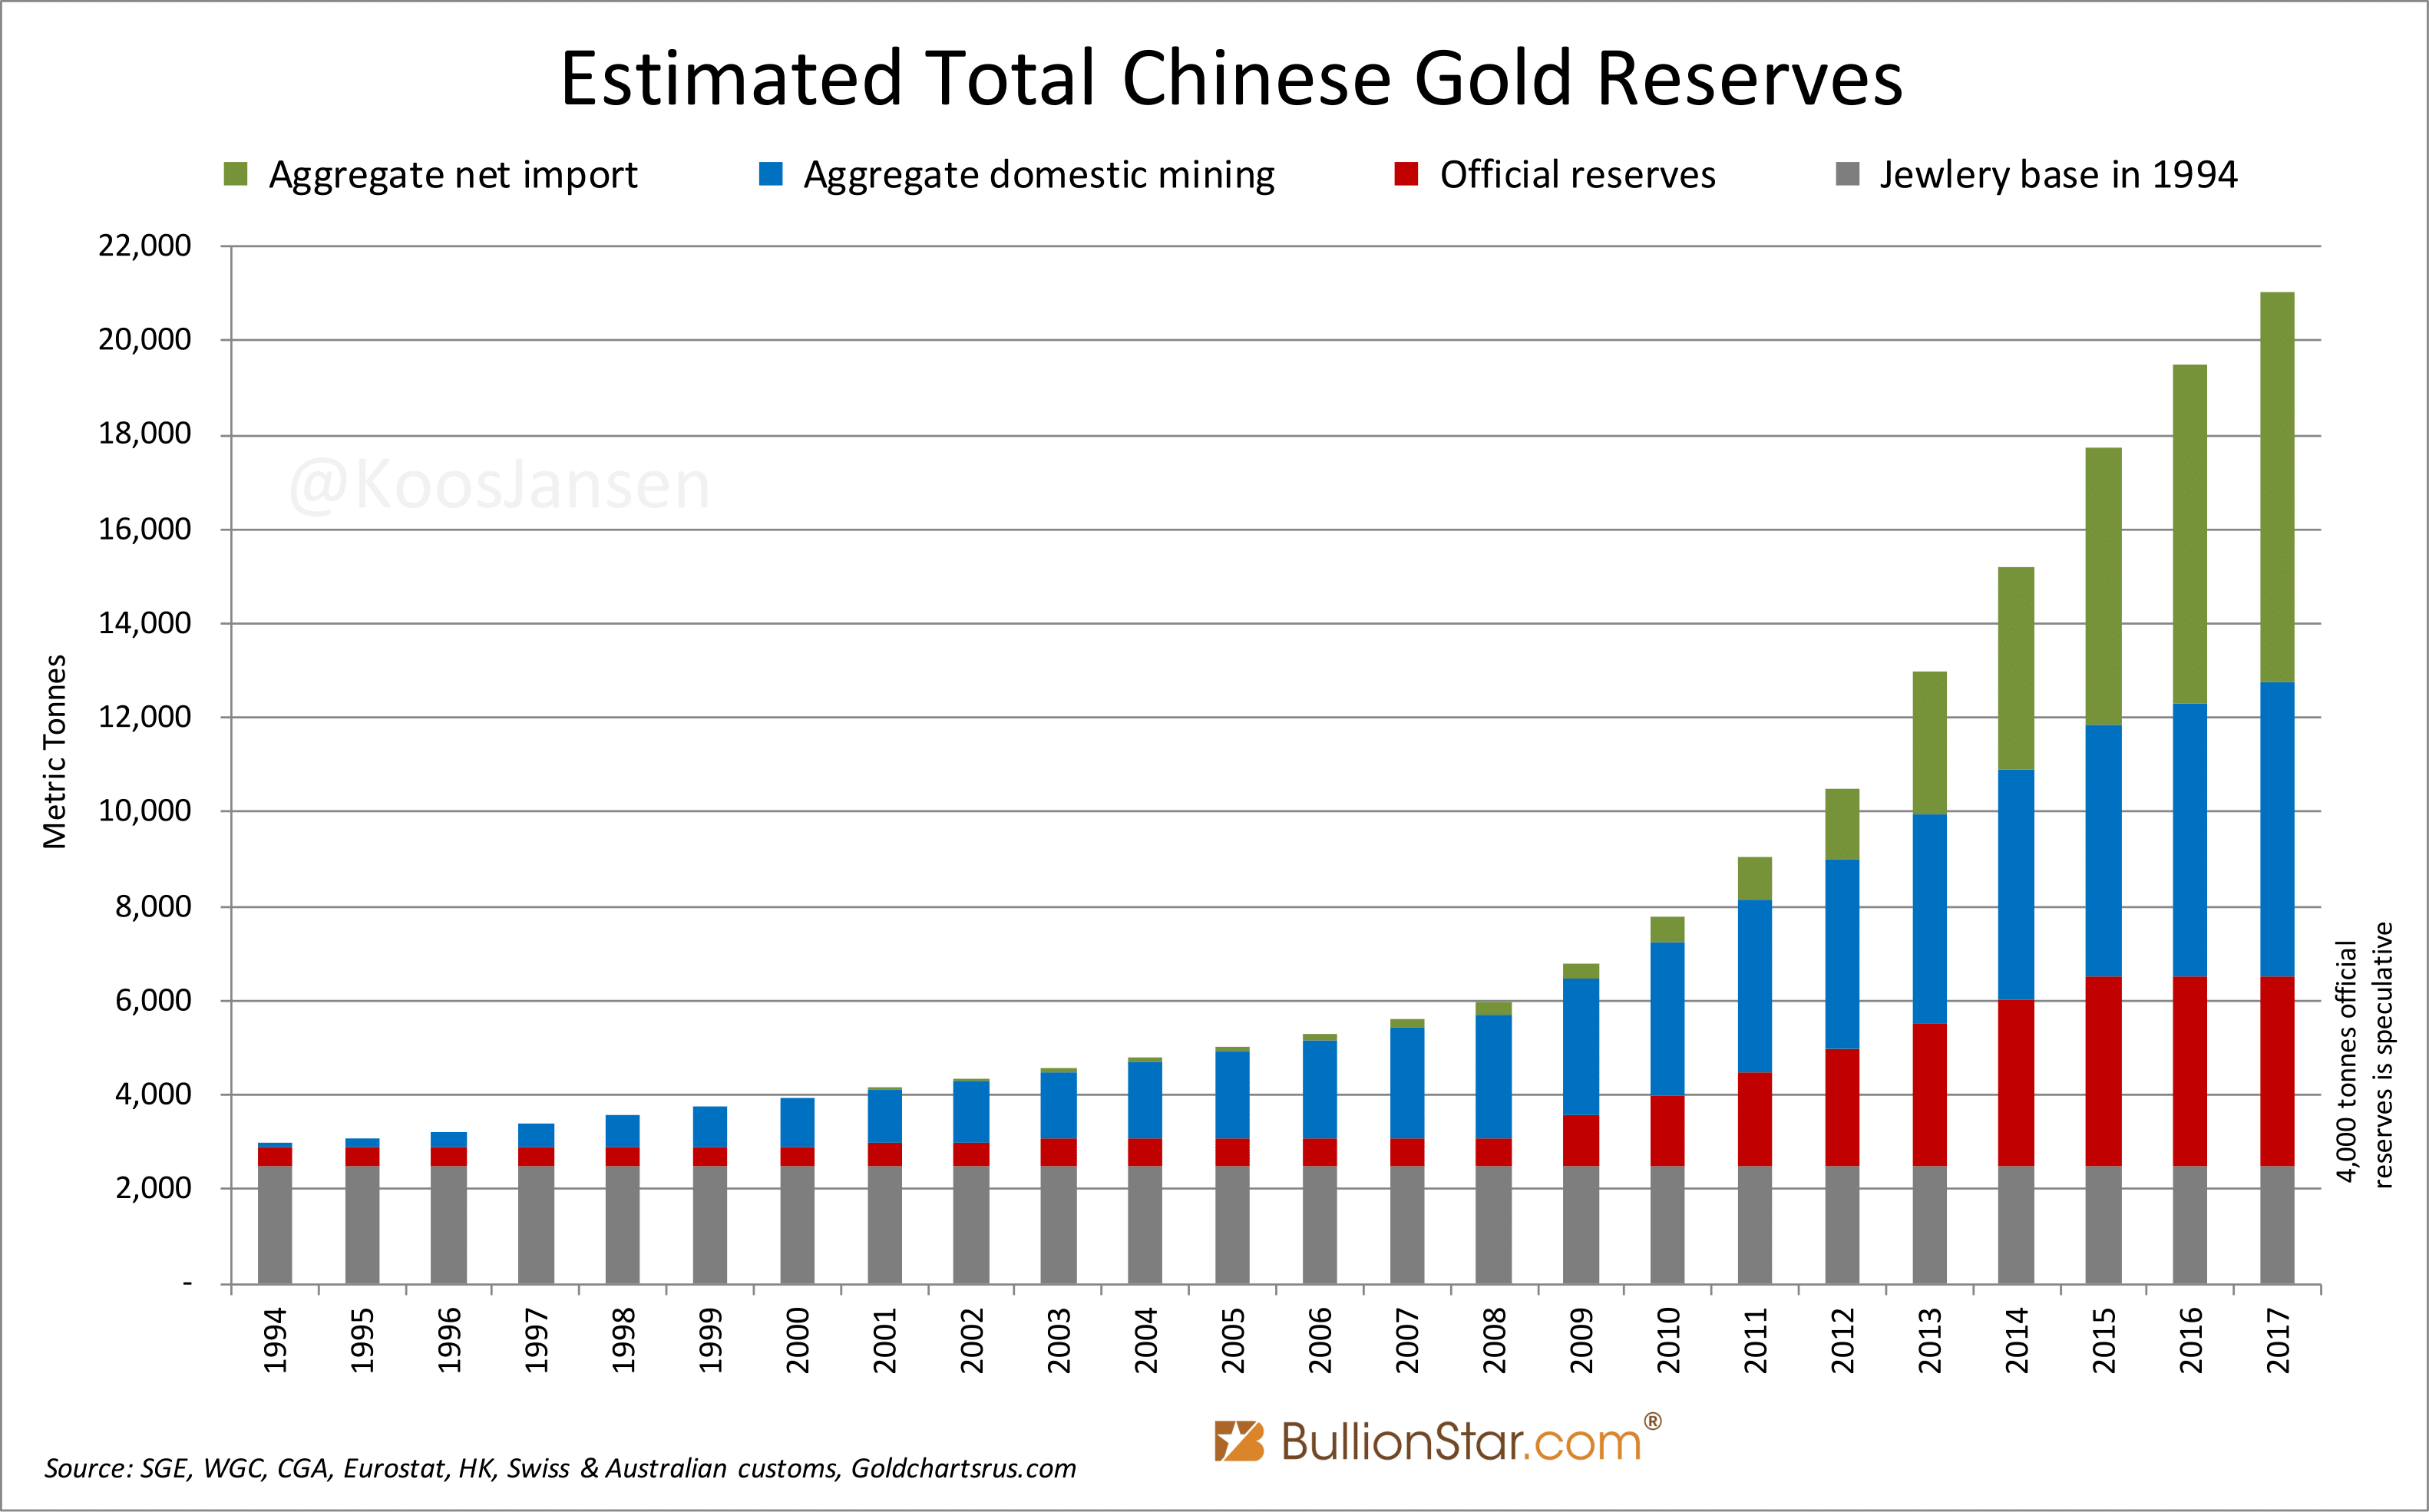
All in all, I would assess total Chinese gold demand in 2017 a tad lower than SGE(I) withdrawals, say at about at 2,000 tonnes, because there’s likely some inventory in the SFTZ. Although it’s unknown how much is in the SFTZ, my estimate for total above ground gold within the mainland stands at 21,021 tonnes as of December 31, 2017. This includes approximately 4,000 tonnes owned by the Chinese central bank. In this article I’ve demonstrated how I’ve computed these figures.
Trading volume at the SGE(I) continues its steady growth. In 2017 total gold trading volume, including OTC trading, accounted for 27,145 metric tonnes, 12 % more than the year before.
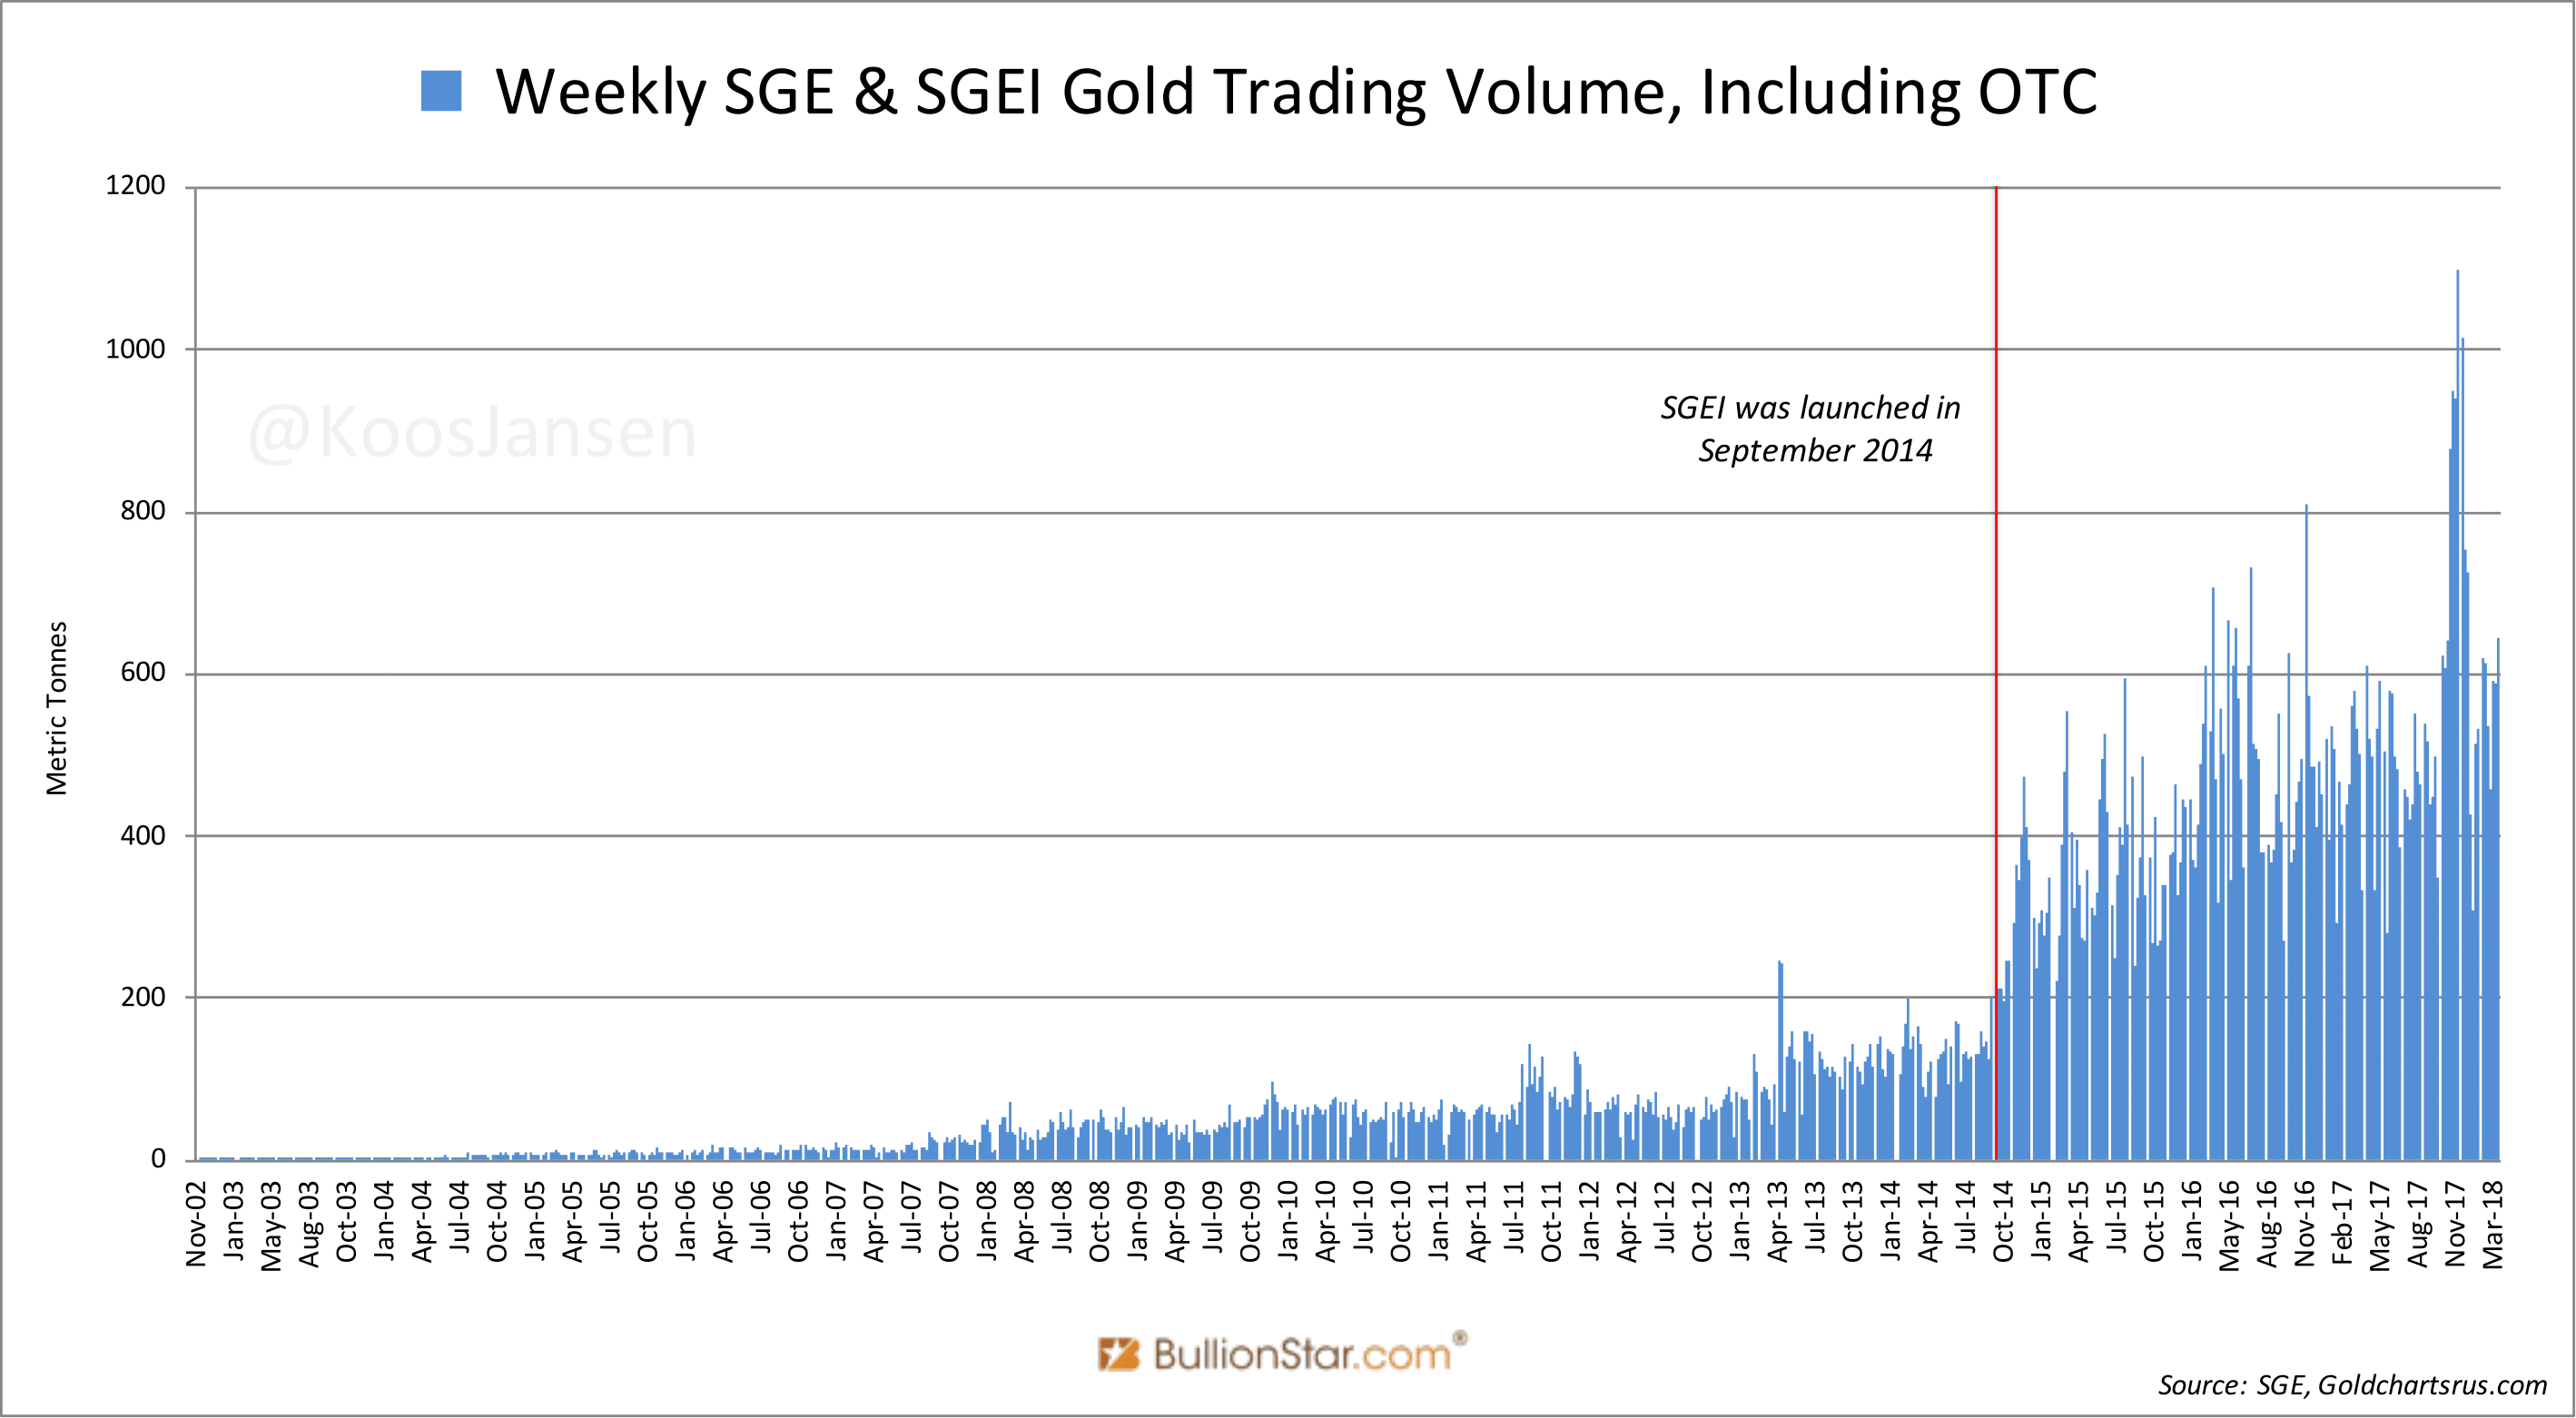
The launch of the SGEI in 2014 has greatly boosted total trading volume. Not because many foreigners are trading the International Board contracts, but because they choose to trade the Main Board contracts which are more liquid (foreigners are allowed to trade Main Board contracts but obviously are not allowed to withdraw metal from the vaults and/or export).
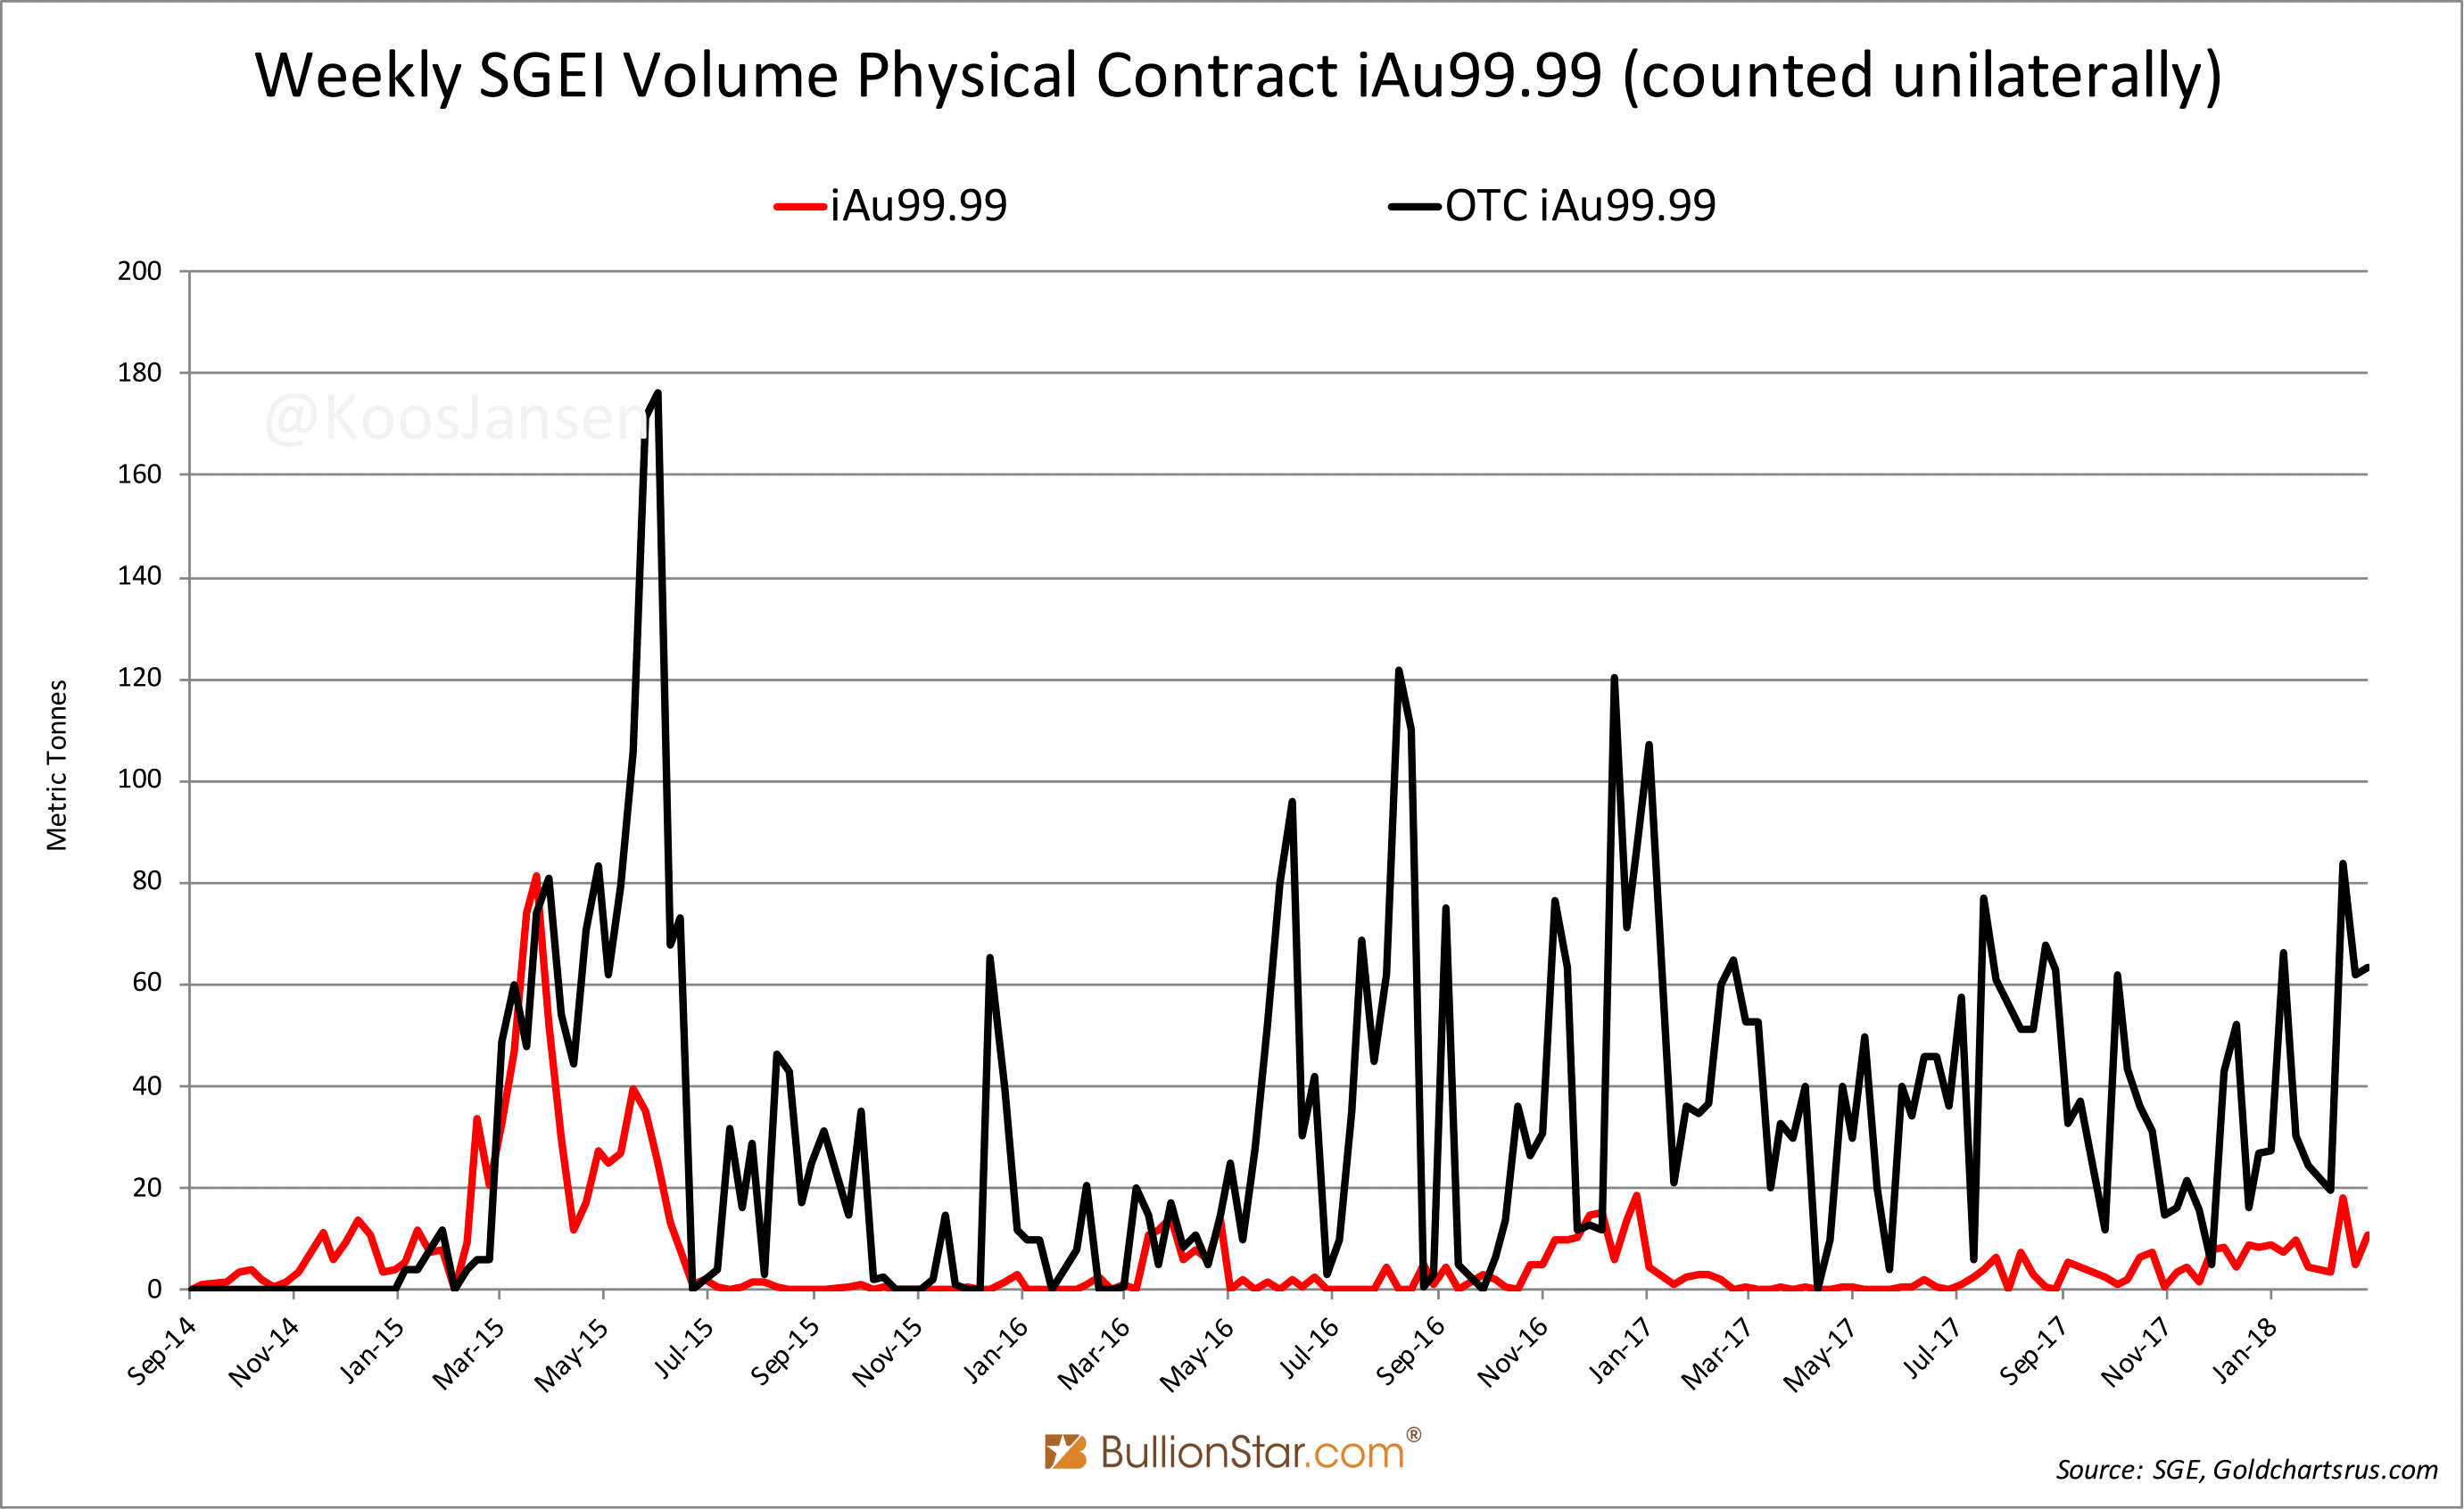
In the chart below you can view trading volume in the most popular International Board contract iAu99.99. Volume at the SGEI is not growing.
Popular Blog Posts by Koos Jansen
 China’s Secret Gold Supplier is Singapore
 Audits of U.S. Monetary Gold Severely Lack Credibility
 China Gold Import Jan-Sep 797t. Who’s Supplying?
 The Gold-Backed-Oil-Yuan Futures Contract Myth
 Estimated Chinese Gold Reserves Surpass 20,000t
 PBOC Gold Purchases: Separating Facts from Speculation
 U.S. Mint Releases New Fort Knox Audit Documentation
 China Net Imported 1,300t of Gold in 2016
 Why SGE Withdrawals Equal Chinese Gold Demand and Why Not