
The Great Physical Gold Supply & Demand Illusion

 Koos Jansen
Gold supply and demand data published by all primary consultancy firms is incomplete and misleading. The data falsely presents gold to be more of a commodity than a currency, having caused deep misconceptions with respect to the metal’s trading characteristics and price formation.
Numerous consultancy firms around the world, for example Thomson Reuters GFMS, Metals Focus, the World Gold Council and CPM Group, provide physical gold supply and demand statistics, accompanied by an analysis of these statistics in relation to the price of gold. As part of their analysis the firms present supply and demand balances that show how much gold is sold and bought globally, subdivided in several categories. It’s widely assumed these balances cover total physical supply and demand, which is incorrect as the most important category is excluded. The firms though, prefer not to share the subtle truth or their business models would be severely damaged.
The supply and demand balances by the firms portray gold to be more of a commodity than a currency, as the gist of the balances reflect how much metal is produced versus consumed – put differently, the firms mainly focus on how much gold is mined versus how much is sold in newly fabricated products. However, in reality gold is everlasting and cannot be consumed (used up), all that has ever been mined is still above ground carefully preserved in the form of bars, coins, jewelry, artifacts and industrial products. Partly because of this property the free market has chosen gold to be money thousands of years ago, and as money the majority of gold trade is conducted in above ground reserves. Indisputably, total gold supply and demand is far in excess of mine production and retail demand.
As most individual investors, fund managers, journalists, academics and precious metals analysts consider the balances by the firms to be complete, the global misconception regarding gold supply and demand is one of epic proportions. Physical gold is a profound anchor in our global financial system and thus it’s of utmost importance we understand the fine details of its trading characteristics.
Supply & Demand Metrics By The Firms
The firms can argue that the difference between what they present as supply and demand (S&D), as opposed to what I deem to be a more unadulterated approach of S&D is due to contrasting metrics. Accordingly, we’ll discuss their metrics to reveal their infirmity. In a nutshell, the firms only count the physical gold S&D flows that are easy to measure, while leaving out the most important part: institutional supply and demand.
Although the firms all have slightly different methodologies to measure S&D, from comparisons the numbers appear to be quite similar. For our further investigation we’ll spotlight the metrics and models by GFMS. The reason being, GFMS has been the only firm that was willing to share a full description of their methodology for publication – to be viewed here. Metals Focus (MF) provided a partial methodology, the World Gold Council and CPM Group declined to comment.
Let’s have a look at GFMS its S&D categories. On the supply side is included:
- Mine supply (newly mined gold)
- Scrap supply (gold sourced from old fabricated products)
On the demand side is include:
- Jewelry demand (gold content used in newly manufactured jewelry products bought locally at retail level, adjusted by jewelry exported and imported).
- Industrial demand (the volume of gold used in industrial applications, for example bonding wire, products used in semiconductors/electronics and dental alloys).
- Retail bar investment (the net volume of bars that are purchased by individual investors through retail channels).
- Coin investment (a combination of published data from mints and also a proprietary survey conducted by GFMS detailing where coins are sold).
The above four demand categories summed up are often referred to as “consumer demand” by the firms.
Furthermore GFMS includes:
- Net hedging (change in physical market impact of mining companies’ gold loans, forwards, and options positions)
- Net official sector (total central bank selling or buying)
- ETF inventory build (change in ETF inventory)
- Exchange inventory build (change in exchange inventory)
The last four categories can be either supply or demand. In example, when central banks (the official sector) in total are net sellers this will be listed as a negative demand figure, as is shown in the S&D balance by GFMS below from 2006 until 2009, when central banks in total are net buyers this will be listed as a positive demand figure, as is shown in the balance from 2010 until 2015. For a clear overview of the GFMS S&D balance please have a look at all line items below.
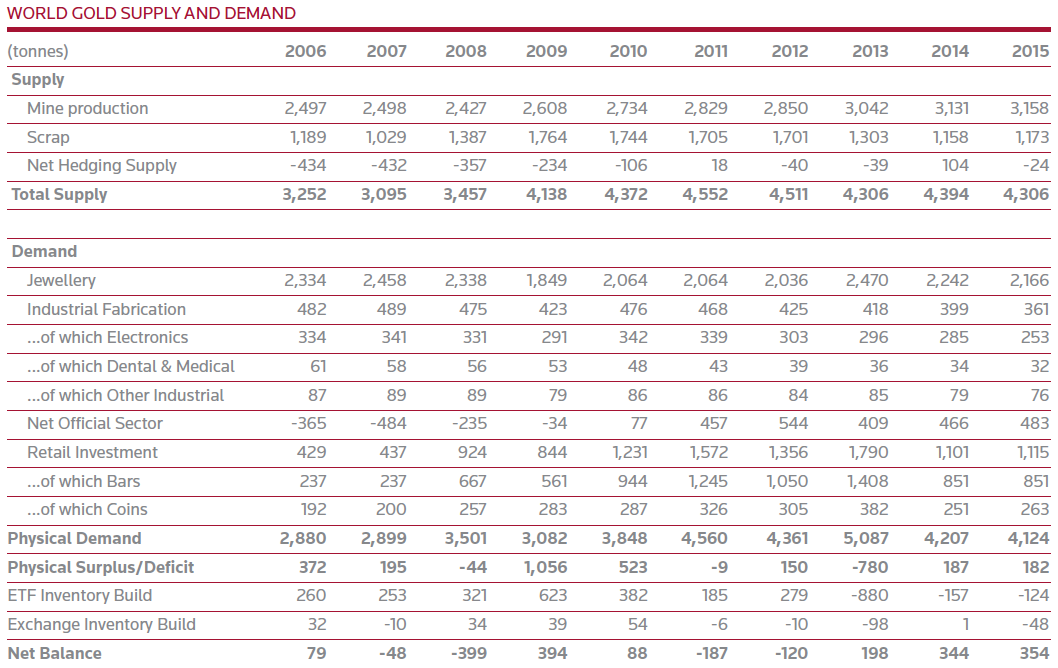
According to GFMS Supply consists of Mine production, Scrap and Net Hedging. In turn, Demand consists of Jewelry, Industrial Fabrication, Retail Investment, and Net Official Sector. After balancing Supply and Demand this results in a Physical Surplus/Deficit. Then, ETF Inventory Build and Exchange Inventory Build are added/subtracted from the Physical Surplus/Deficit to come to a Net Balance.
GFMS likes to pretend their balance is complete and occasionally articulates any surplus or deficit arising from it is positively correlated to the price of gold, which is anything but true, as I will demonstrate step by step.
The Firms Exclude Majority Gold Supply & Demand
Most important what’s excluded from the balance is what we’ll refer to as institutional supply and demand, which can be defined as trade in bullion among high net worth individuals and institutions. Usually the bullion in question comes in 400-ounce (12.5 Kg) London Good Delivery (GD) bars having a fineness of no less than 995, or smaller 1 Kg bars having a fineness of no less than 9999. In addition, bullion bars can weigh 100-ounce or 3 Kg, among other less popular sizes, generally having a fineness of no less than 995. Bullion can be traded without changing in weight or fineness, but it can be refined and/or recast for transactions as well, in example from GD bars into 1 Kg bars. In some cases institutional supply and demand involves cross-border trade, when bullion is sold in country A to a buyer in country B, in other cases the bullion changes ownership without moving across borders.
Provided are two exemplifications of institutional S&D:
- An (institutional) investor orders 400 Kg of gold in its allocated account at a bullion bank in Switzerland – which would be purchased in the Swiss wholesale market most likely in GD bars. This type of S&D will not be recorded by GFMS.
- A Chinese (institutional) investor buys 100 Kg of gold directly at the Shanghai Gold Exchange (SGE), the Chinese wholesale market, in 1 Kg 9999 bars and withdraws the metal from the vaults. Neither this transaction will be registered by GFMS – or any other firm.
These examples show the S&D balances by GFMS are incomplete.
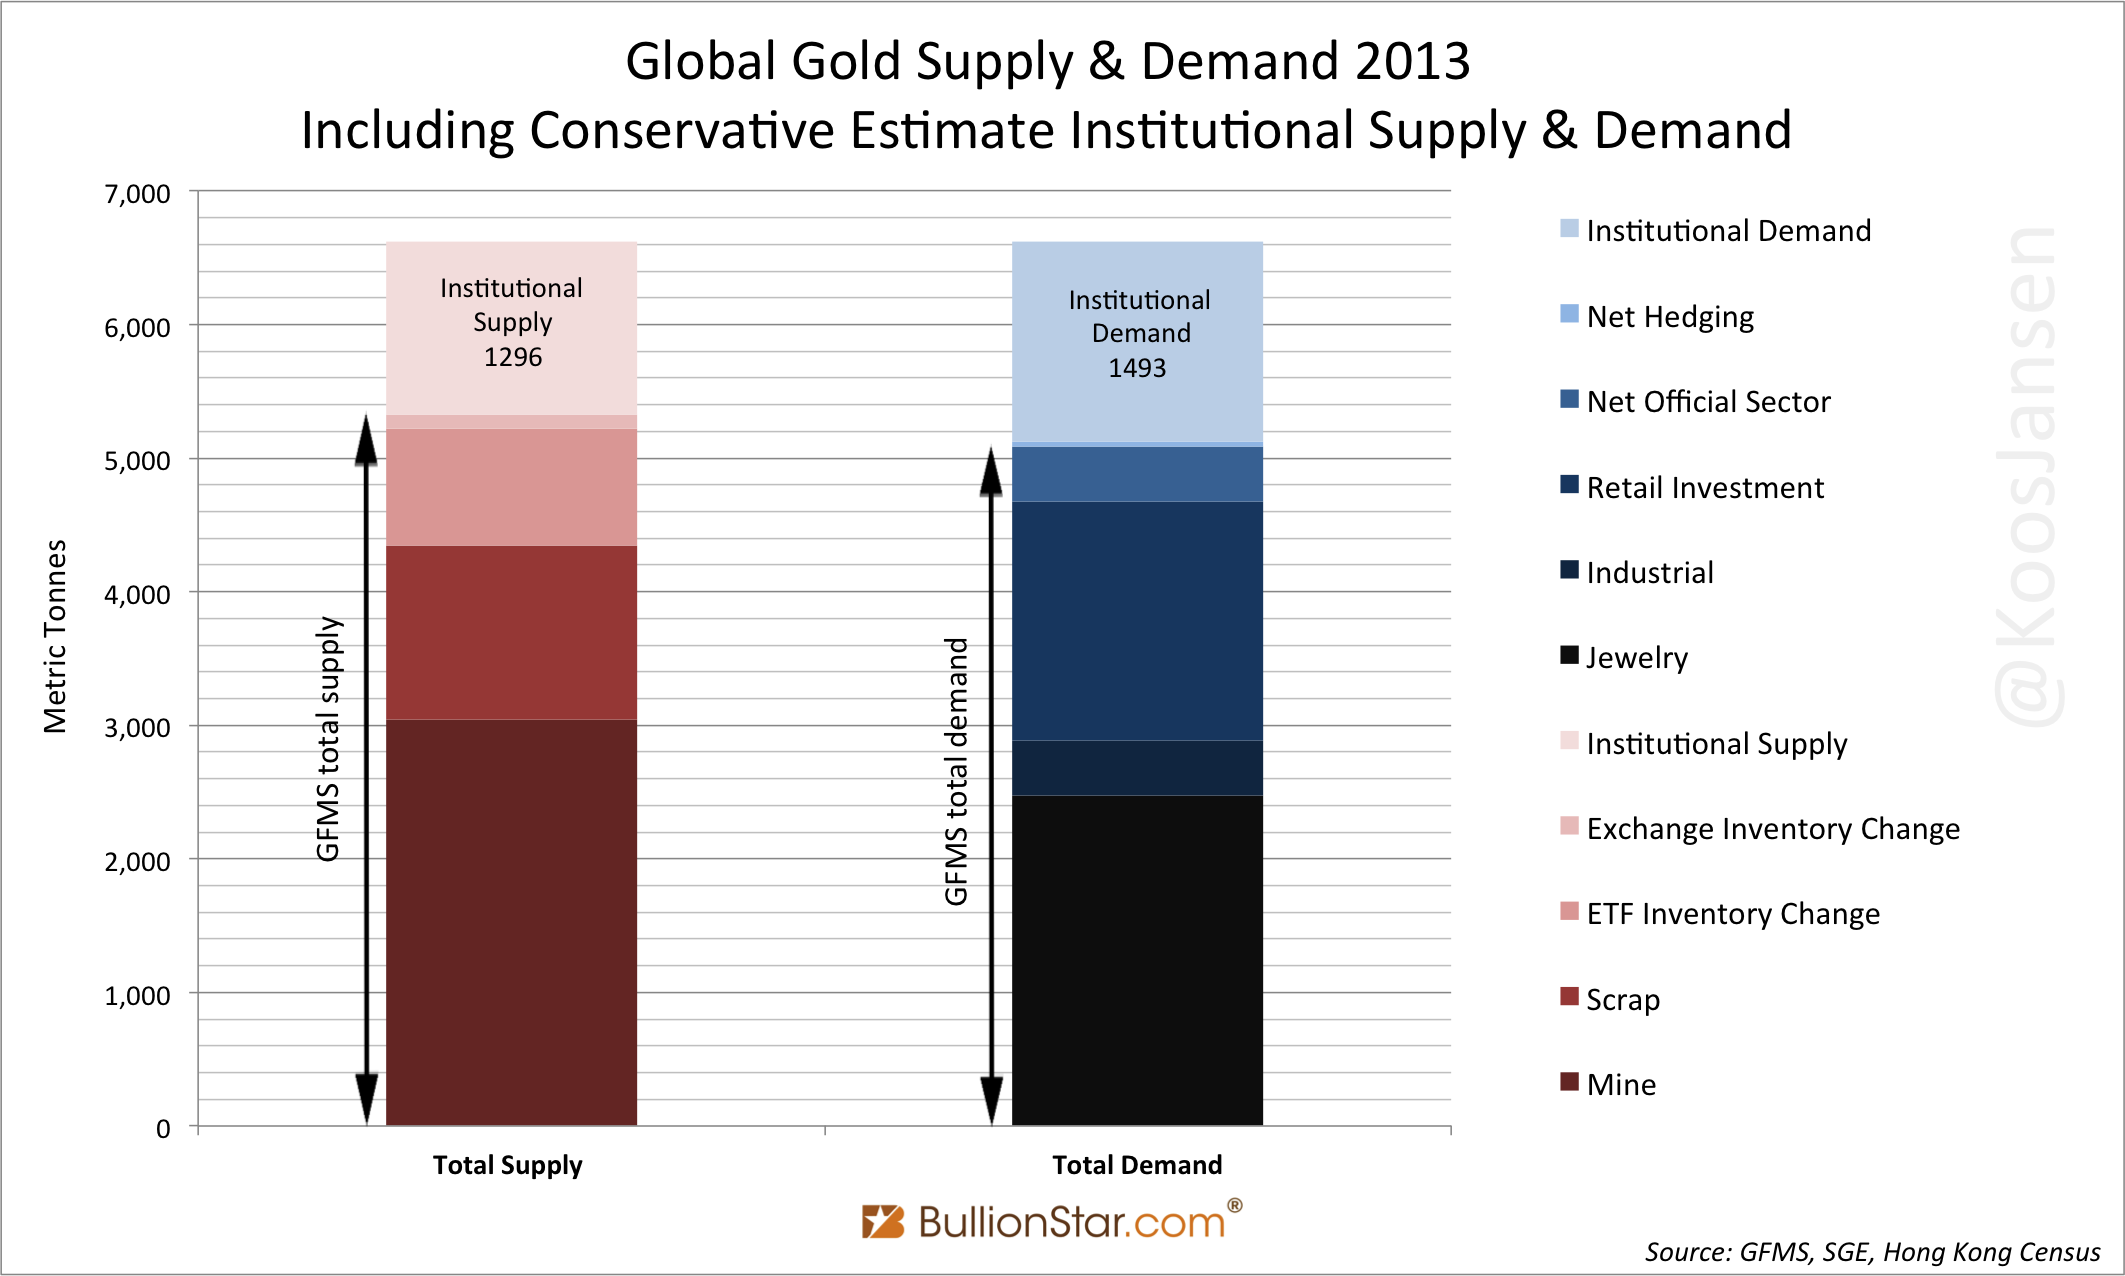
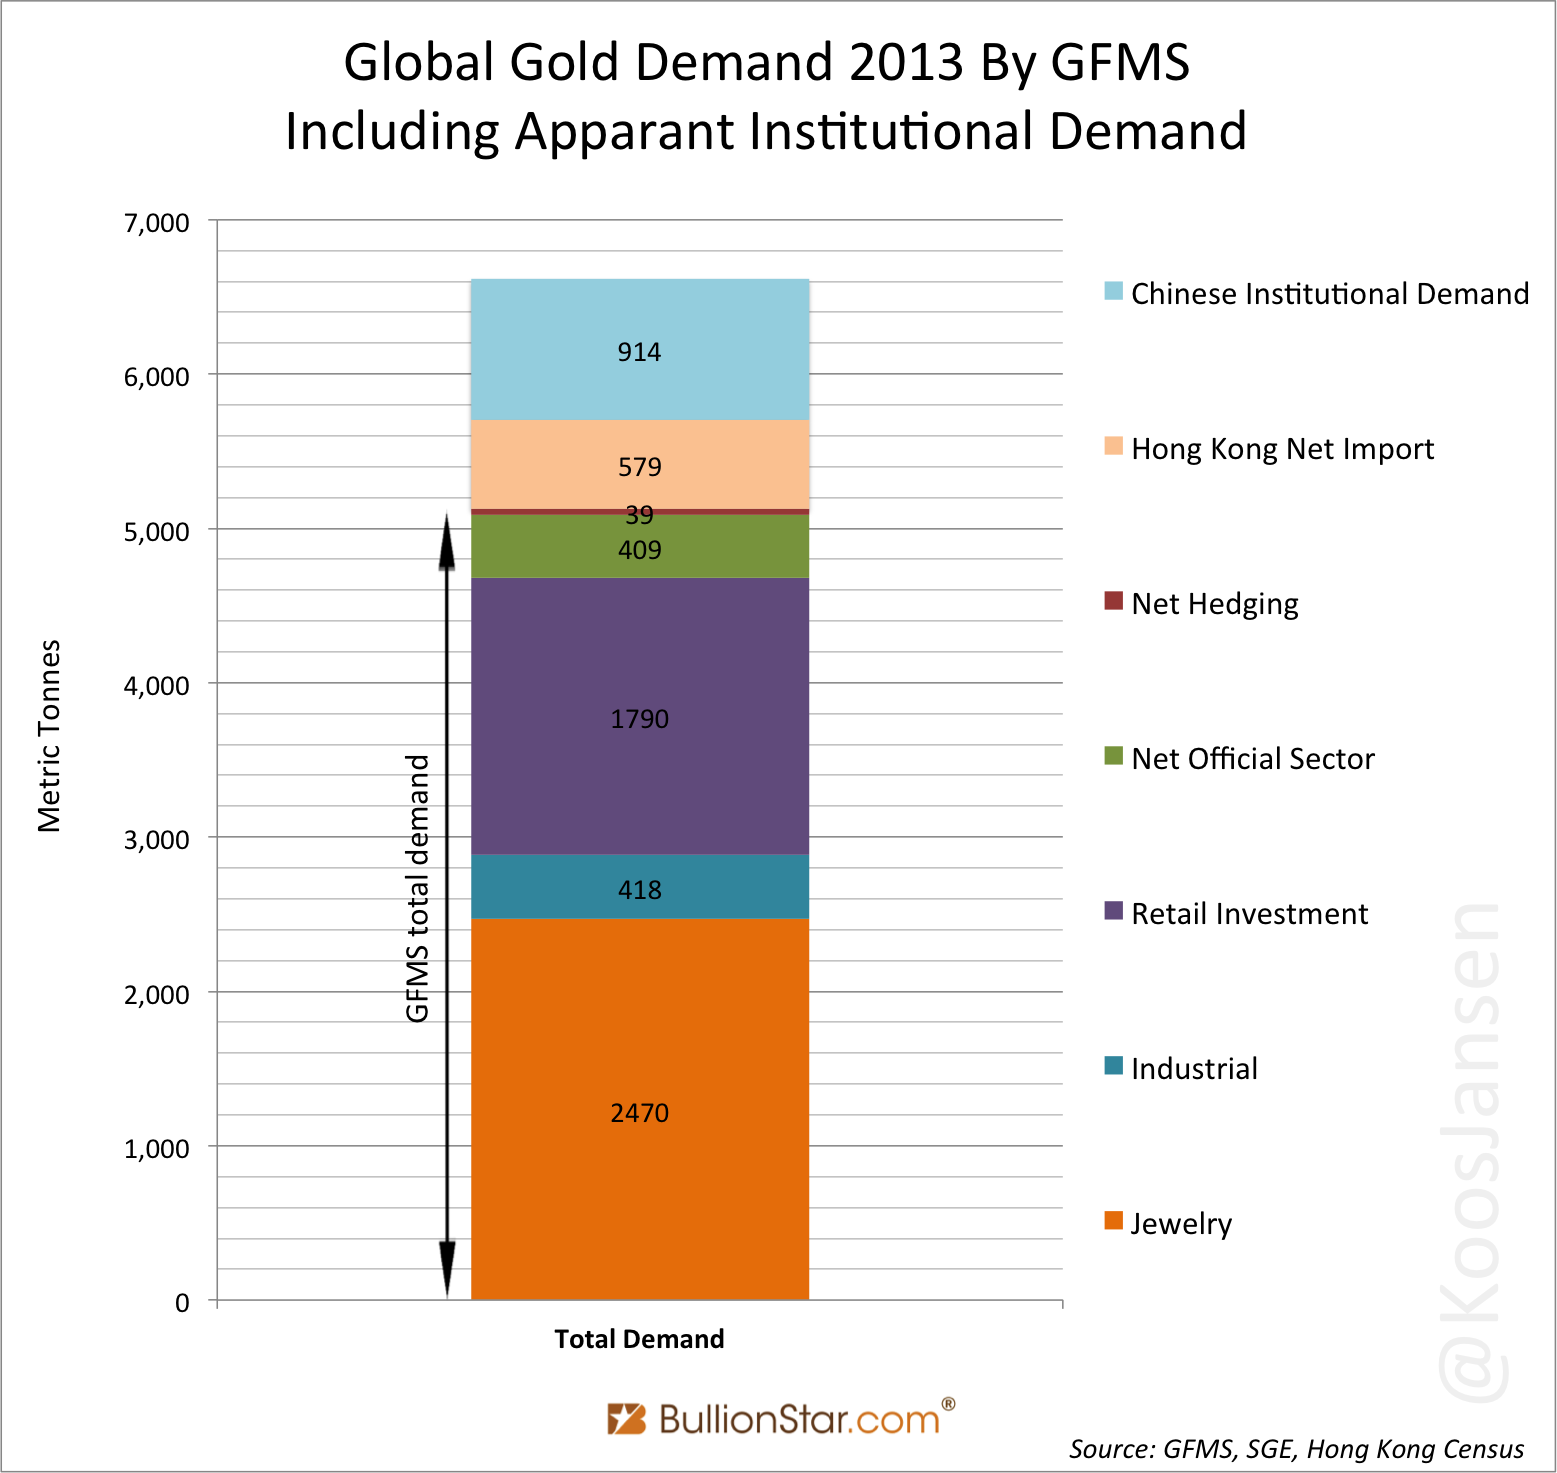
For illustrational purposes, below is a chart based on all S&D numbers by GFMS from 2013, supplemented by my conservative estimate of institutional S&D. Including institutional transactions total S&D in 2013 must have reached well over 6,600 tonnes.
GFMS Covers The Tracks With Help From The LBMA
Although GFMS intermittently admits their number are incomplete (they have to), at the same time they’ve been battling for years to eclipse apparent institutional S&D for its audience. Dauntless tactics were needed when in 2013 institutional demand in China reached roughly 1,000 tonnes and over 500 tonnes in Hong Kong. Institutional demand in the East was predominantly sourced through GD bars from the London Bullion Market, which were refined into 1 Kg 9999 bars that are more popular in Asia. For the cover up GFMS went to great lengths to refute the volumes of gold withdrawn from SGE vaults, and accordingly have the London Bullion Market Association (LBMA) adjust statistics on total refined gold by its member refineries. Remarkably, the LBMA cooperated. Allow me to share my analysis in detail.
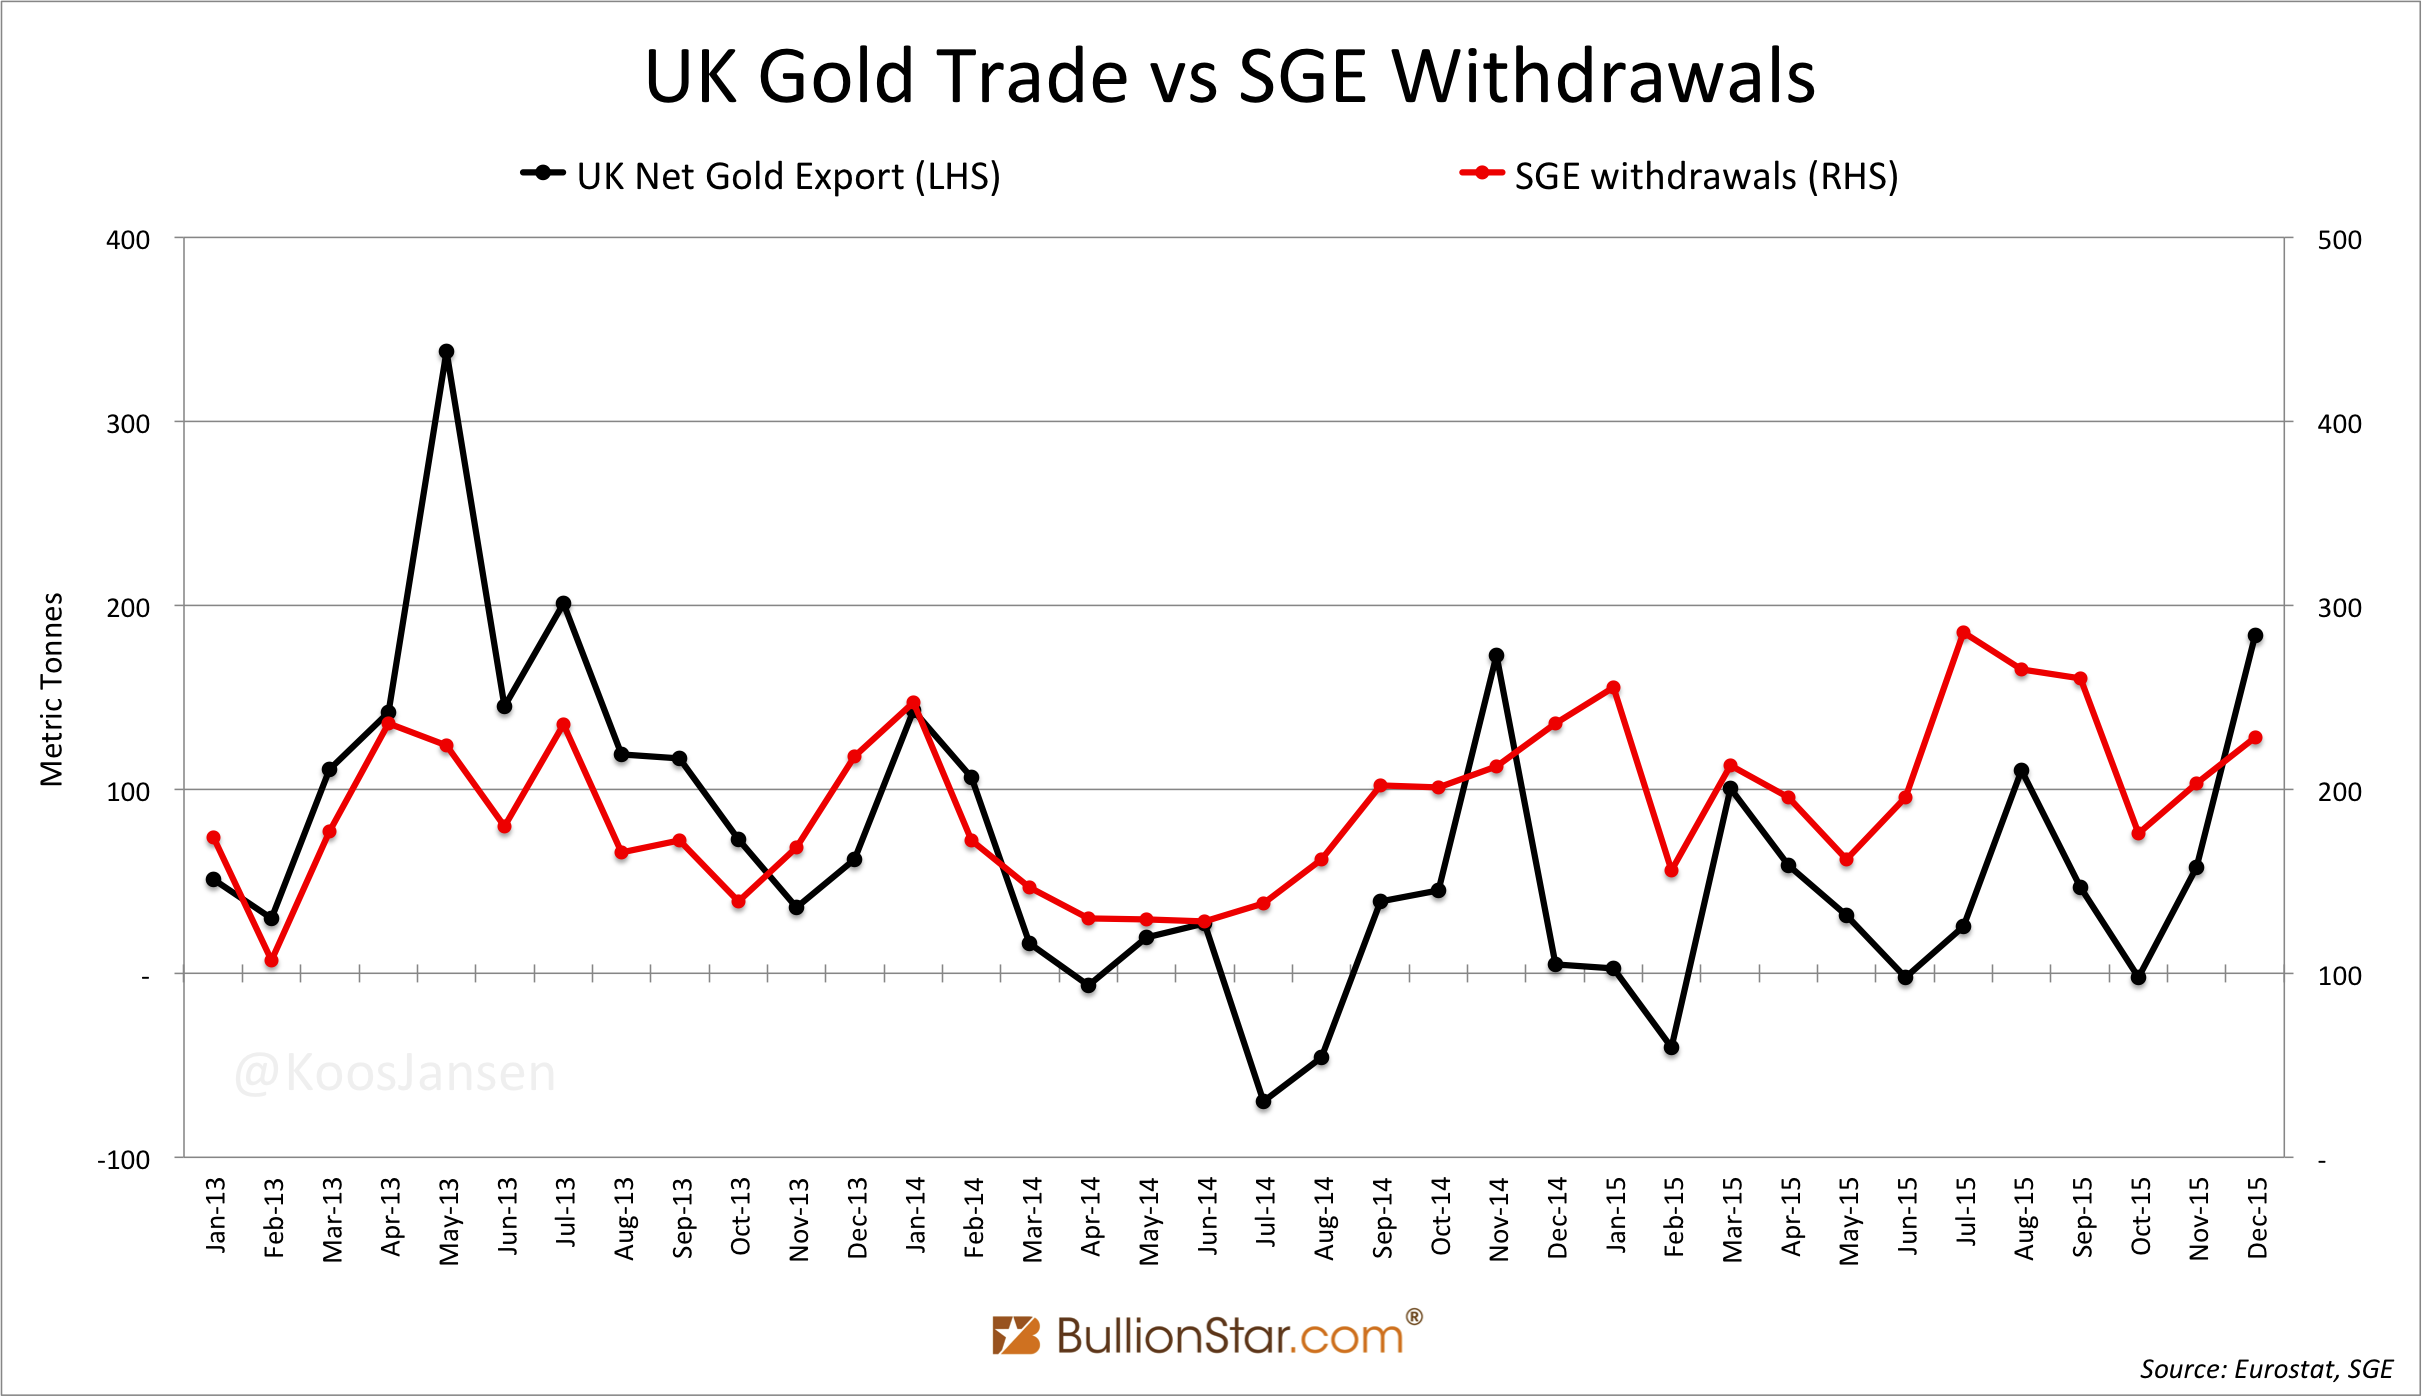
In 2013 something unusual happened in the global gold market as Chinese institutional demand exploded for the first time in history. Hundreds of tonnes of institutional supply from London in the form of GD bars were mainly shipped to Switzerland to be refined in 1 Kg 9999 bars, subsequently to be exported via Hong Kong to meet institutional demand in China. From customs data by the UK, Switzerland and Hong Kong the institutional S&D trail was clearly visible. From 2013 until 2015 there was even a strong correlation between the UK’s net gold export and SGE withdrawals. Demonstrated in the chart below.
Because of the mechanics of the gold market in China, Chinese institutional demand roughly equals the difference between the amount of gold withdrawn from SGE designated vaults (exhibit 4, red bars) and Chinese consumer demand (exhibit 4, purple bars). In the exhibit 4 below you can see this difference that brought GFMS in a quandary, especially since 2013. For more information on the workings of the Chinese gold market and the size of Chinese institutional demand please refer to my post Spectacular Chinese Gold Demand Fully Denied By GFMS And Mainstream Media.
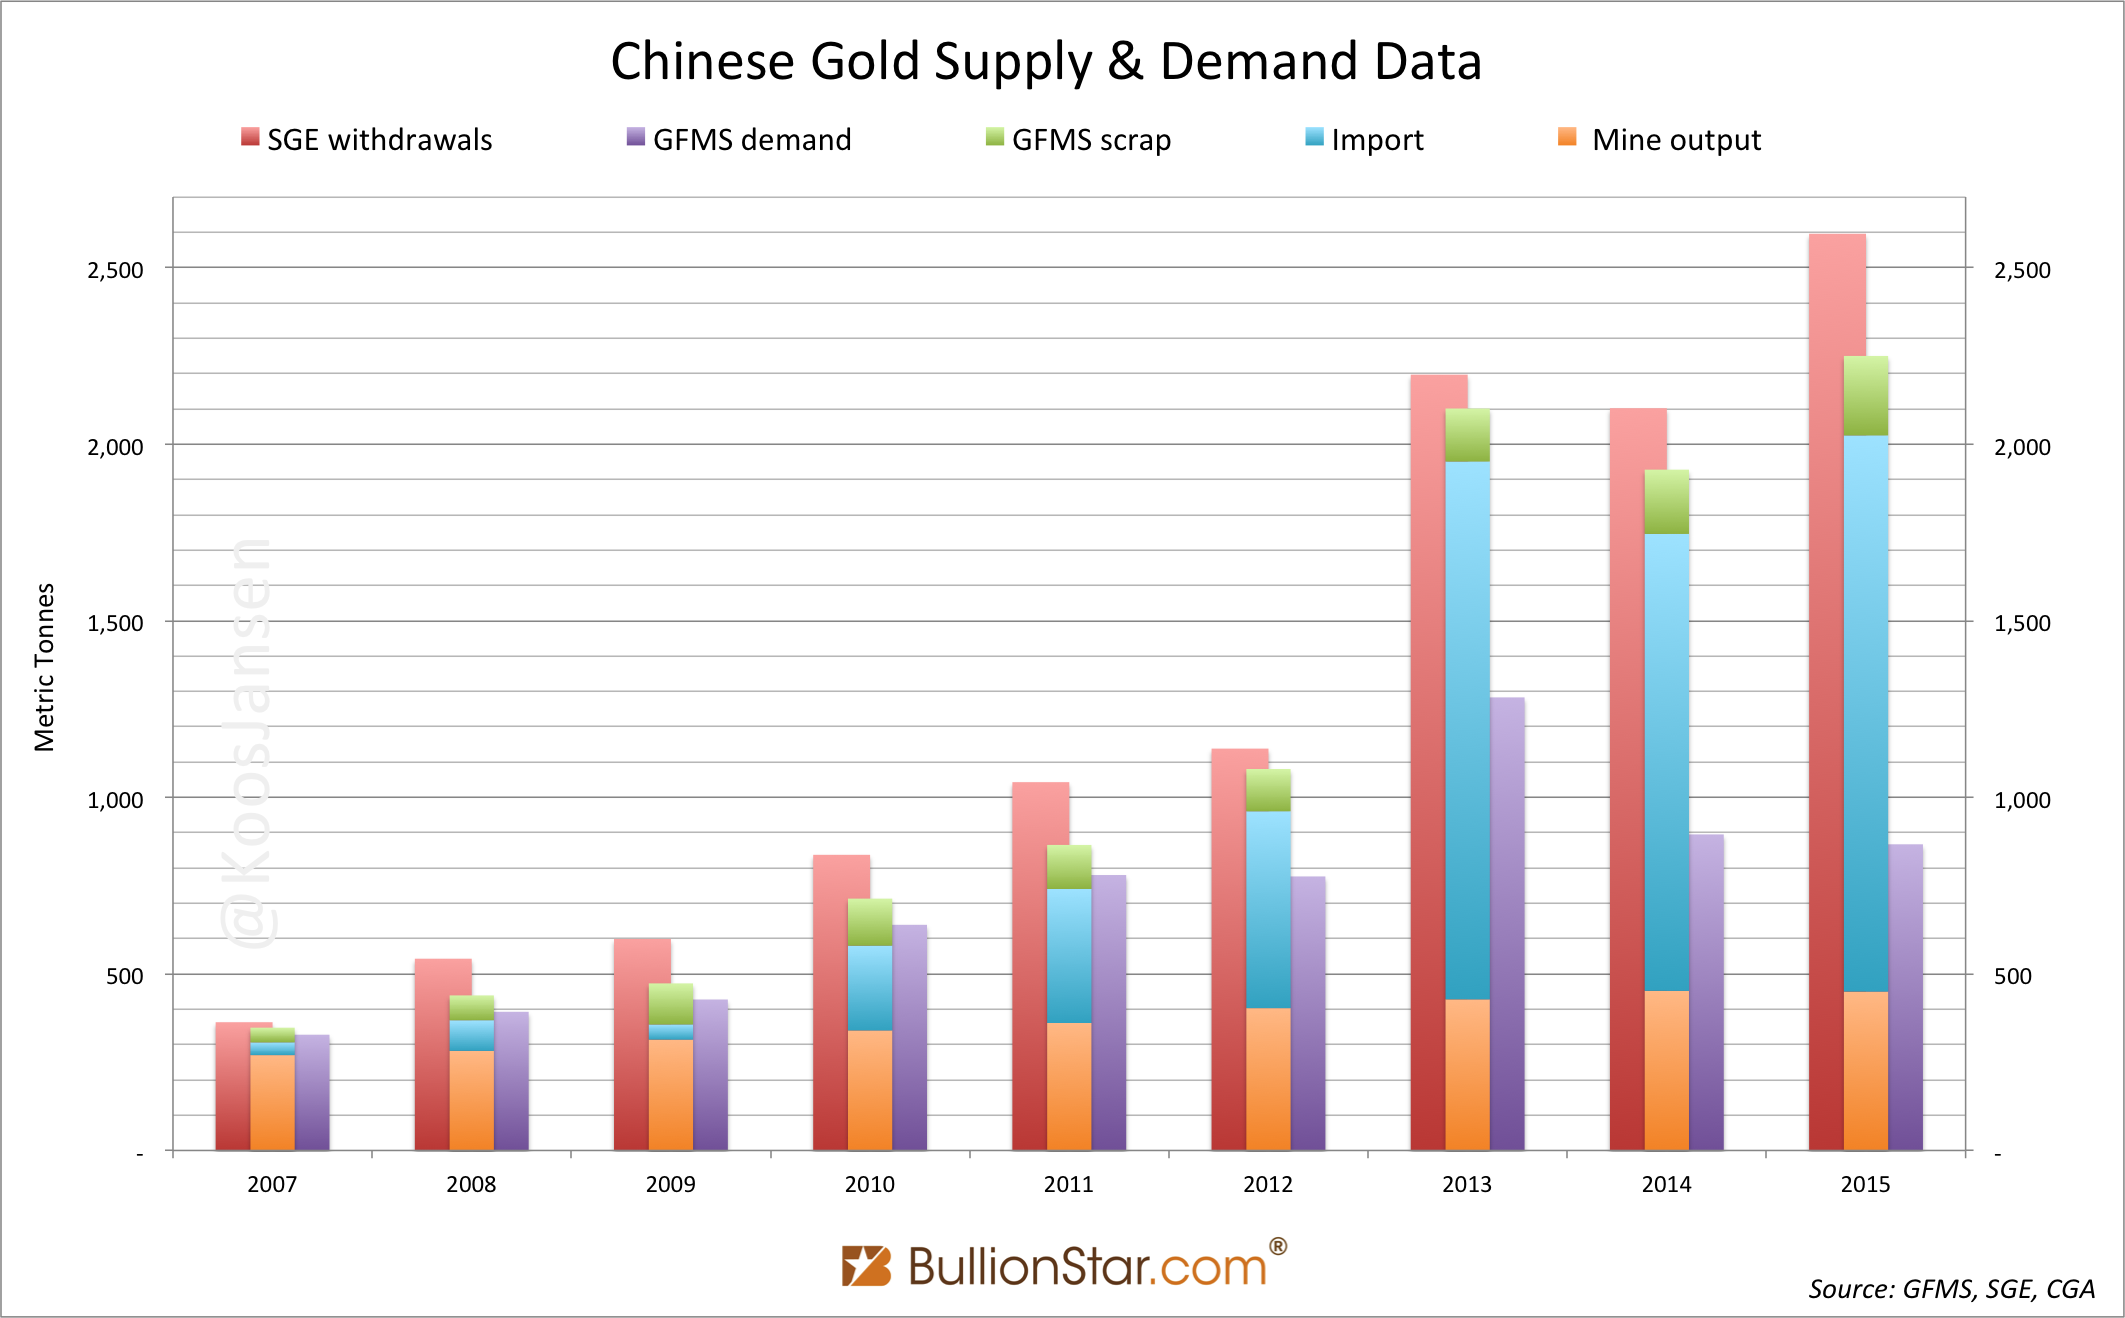
Stunningly, since 2013 GFMS has tried to convince its readers through numerous arguments why SGE withdrawals crossed 2,000 tonnes for three years in a row, while Chinese consumer demand reached roughly half of this. Yet the arguments have failed miserably to explain the difference – they rationalize only a fraction, read this post for more information.
And GFMS did more to eclipse apparent institutional S&D. They colluded with the LBMA.
To be clear, I cannot exactly measure global institutional S&D. However, let me make an estimate of apparent institutional demand for 2013. Notable, in 2013 a flood of gold crossed the globe from West to East. Chinese institutional demand accounted for 914 tonnes and Hong Kong net imported 579 tonnes – the latter we’ll use as a proxy for additional Asian institutional demand, as Hong Kong is the predominant gold trading hub in the region.
In total apparent institutional demand in 2013 accounted for (914 + 579) 1,493 tonnes. If we add all other demand categories by GFMS shown in exhibit 1, total demand in 2013 was at least 6,619 tonnes. Be aware, this excludes non-apparent institutional demand.
Because nearly all wholesale gold demand in Hong Kong and China is for 1 Kg 9999 bars, the global refining industry was working overtime in 2013, mainly to refine institutional and ETF supply in GD bars coming from London. In December 2013 I interviewed Alex Stanczyk of the Physical Gold Fund who just before had spoken to the head of a Swiss refinery. At the time Stanczyk told me [brackets added by me]:
They put on three shifts, they’re working 24 hours a day and originally he [the head of the refinery] thought that would wind down at some point. Well, they’ve been doing it all year [2013]. Every time he thinks it’s going to slow down, he gets more orders, more orders, more orders. They have expanded the plant to where it almost doubles their capacity. 70 % of their kilobar fabrication is going to China, at apace of 10 tonnes a week. That’s from one refinery, now remember there are 4 of these big ones [refineries] in Switzerland.
As a consequence, statistics on “total refined gold production” in 2013 by “LBMA accredited gold refiners who are on the Good Delivery List”, which the four large refineries in Switzerland are part off, capture the immense flows of institutional S&D – next to annual mine output and scrap refining. On May 1, 2015, the LBMA disclosed total refined gold production by its members at 6,601 tonnes for 2013 in a document titled A guide to The London Bullion Market Association. It’s no coincidence this number is very close to my estimate on total demand (6,619 tonnes), as apparent institutional demand in Asia was all refined from GD into 1 Kg bars.
Here’s exhibit 2 from another angle.
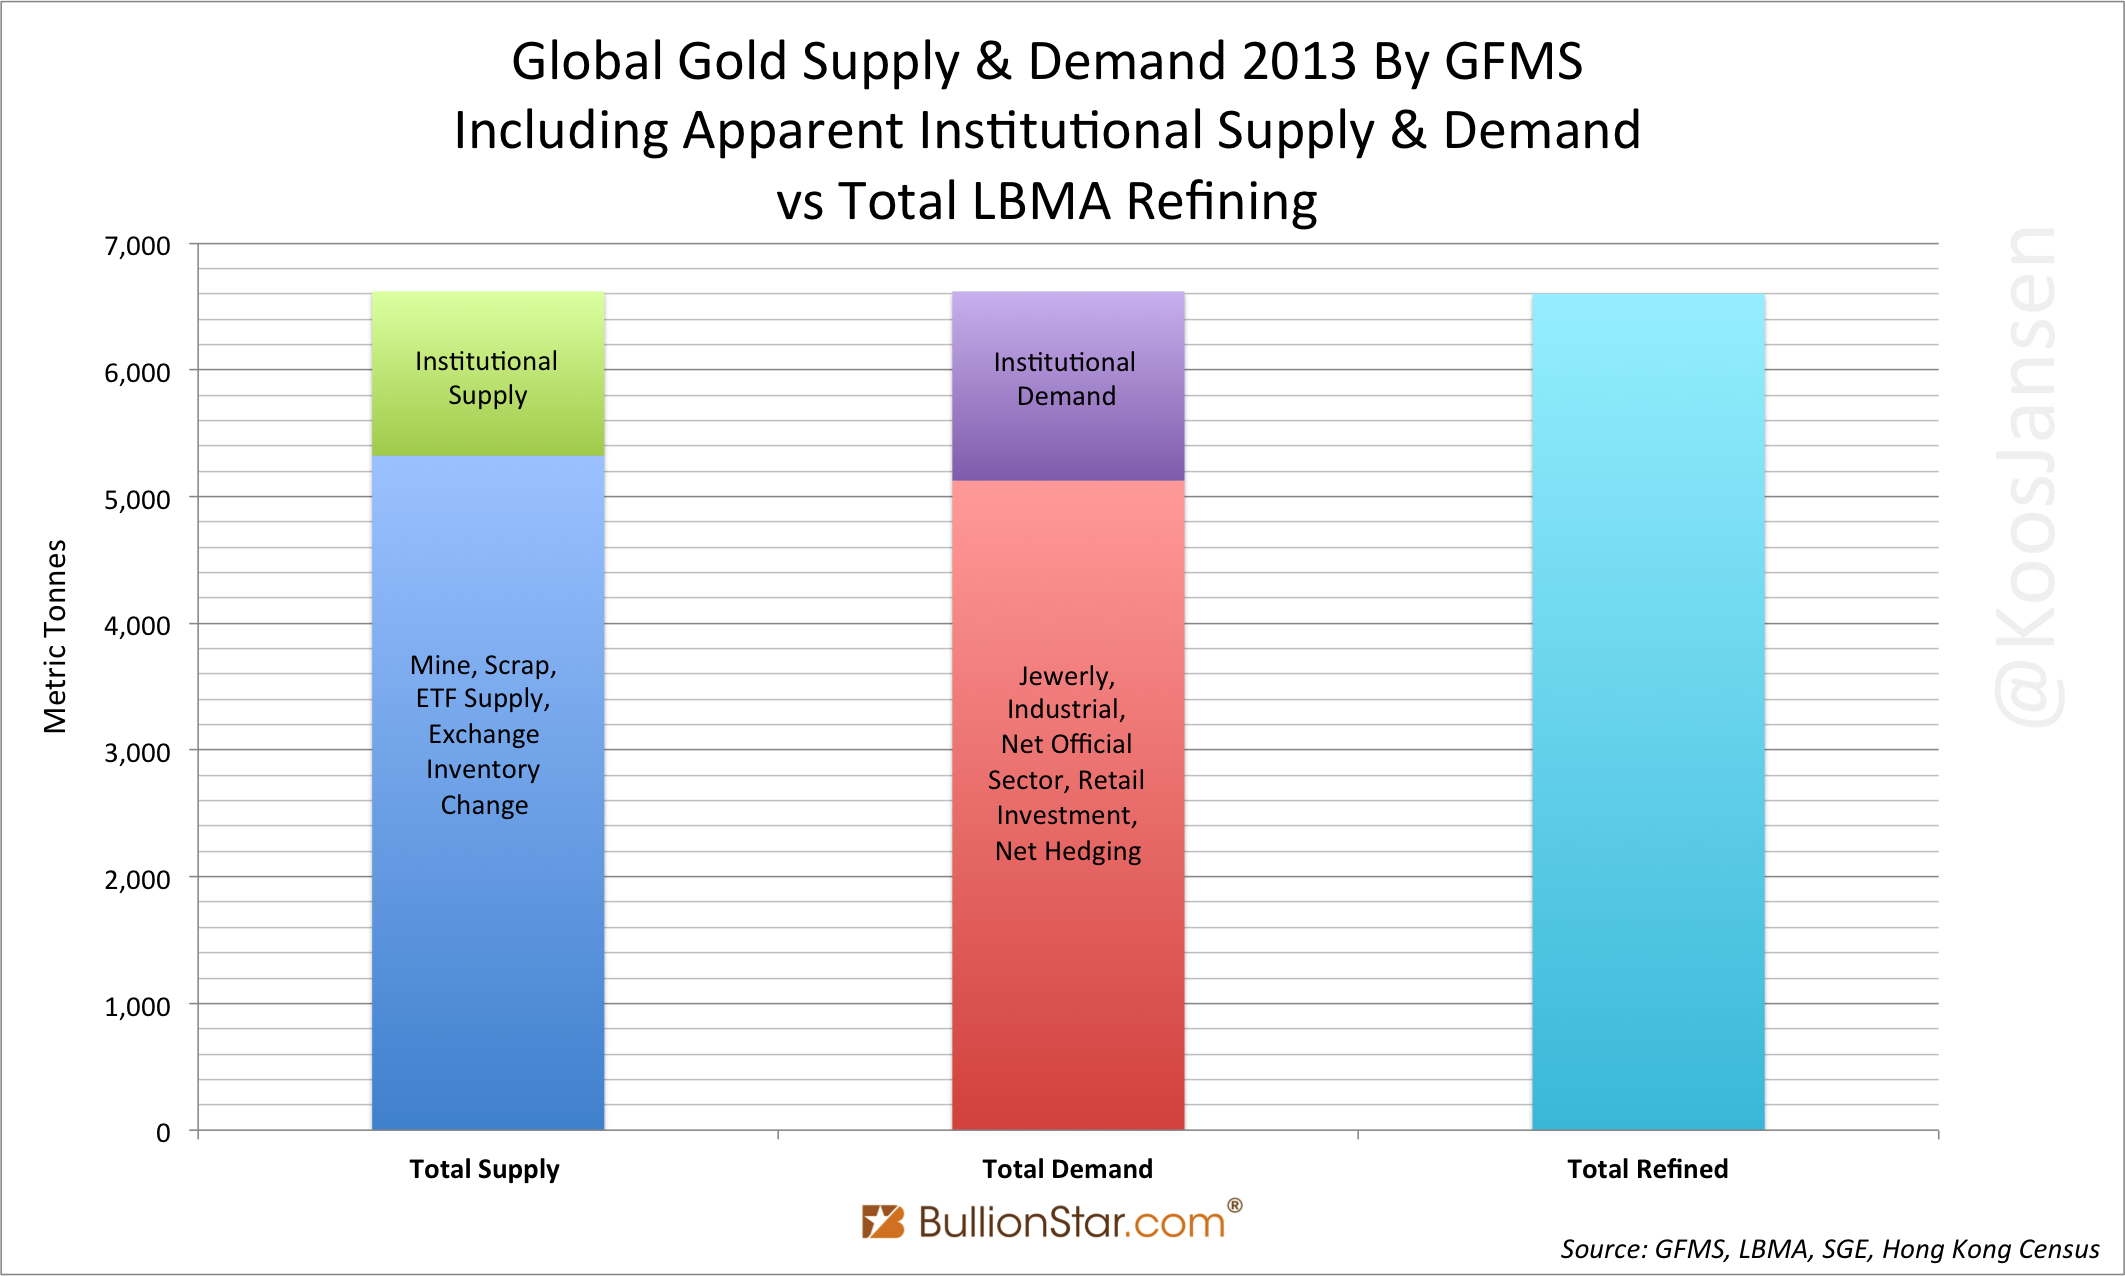
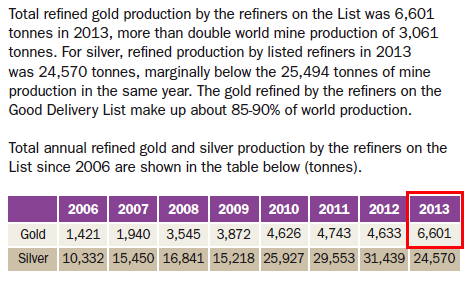
In the table below we can see the LBMA refining statistics for 2013 at 6,601 tonnes.
After this publication GFMS was trapped; these refining statistics revealed a significant share of the institutional S&D flows they had been trying to conceal. What happened next – I assume – was that GFMS kindly asked the LBMA to adjust downward their refining statistics. First and painstakingly exposed by my colleague Ronan Manly in multiple in-depth posts, the LBMA kneeled and altered its refining statistics to keep the charade in the gold market going.
On August 5, 2015, the LBMA had edited the aforementioned document, now showing 4,600 tonnes in total refined gold production. (Click here to view the original LBMA document from the BullionStar server, and here to view the altered version from the BullionStar server.) Have a look.
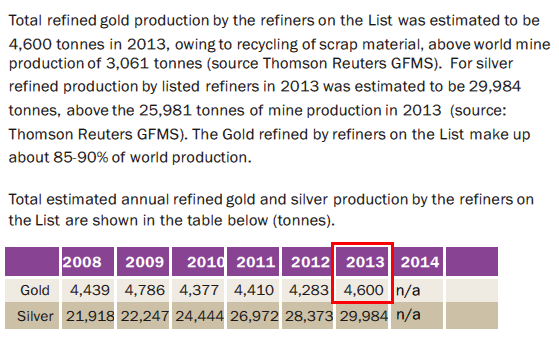
In the altered version it says:
Total refined gold production by the refiners on the List was estimated to be 4,600 tonnes in 2013, owing to recycling of scrap material, above world mine production of 3,061 tonnes (source Thomson Reuters GFMS).
A few important notes:
- In the altered version the LBMA mentions “an estimate” for “total refined gold production”, while it doesn’t need to make an estimate as all LBMA accredited gold refiners who are on the Good Delivery List are required to provide exact data to its parent body. The exact data was disclosed in the first version of A guide to The London Bullion Market Association, and it stated, “total refined gold production by the refiners on the List was 6,601 tonnes”.
- In the altered version the LBMA states the refining statistics were sourced from Thomson Reuters GFMS, but the LBMA doesn’t need GFMS for these statistics. The fact they mention GFMS, though, suggests a coordinated cover up of institutional S&D. Not only the firms, also the LBMA publishes incomplete and misleading data.
- The altered version stated refining production totaled 4,600 tonnes, which is a round number and obviously quickly made up. A few weeks after the numbers were adjusted, the LBMA adjusted the numbers again, this time into 4,579 tonnes (click here to view from the BullionStar server). Clearly, on several occasions there has been consultation with the LBMA to get the statistics in line with GFMS.
- In the original document the LBMA states, “Total refined gold production by the refiners on the List was 6,601 tonnes in 2013, more than double world mine production of 3,061 tonnes”, while in the altered version they state, “Total refined gold production by the refiners on the List was estimated to be 4,600 tonnes in 2013, owing to recycling of scrap material, above world mine production of 3,061 tonnes”. Notable, GFMS prefers to have total supply focused around mine and scrap production, instead of including institutional supply.
- The original refining statistics (6,601 tonnes) are still disclosed in the LBMA magazine The Alchemist (#78 on page 24), to be viewed from the LBMA server here.
- The fine details about how often and when the LBMA changed its refining statistics can be read in Ronan Manly’s outstanding post Moving the goalposts….The LBMA’s shifting stance on gold refinery production statistics.
And so nothing is spared in trying to uphold the illusion of the GFMS S&D balance to be complete. In another example GFMS excluded gold purchases by the central bank of China from its S&D balance. In June 2015 the People’s Bank Of China (PBOC) increased its official gold reserves by 604 tonnes, from 1,054 tonnes to 1,658 tonnes. During that quarter (Q2 2015) all other central banks worldwide were net buyers at 45 tonnes. Thus, in total the Official Sector was a net buyer at 649 tonnes. Now, let’s have a look at GFMS’ S&D balance for Q2 2015:
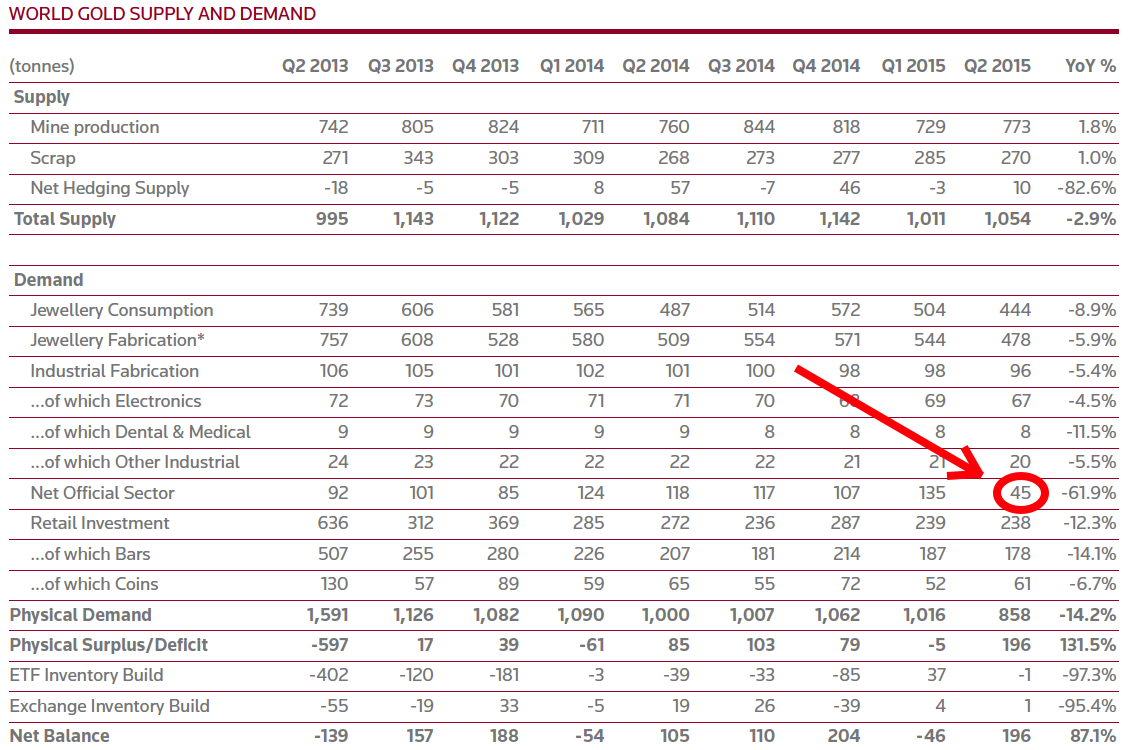
Net Official Sector purchases are disclosed ay 45 tonnes. GFMS decided not to include the 604 tonnes increment by the PBOC simply because it didn’t fit their balance model. A 604 tonnes increment in would have set the “net balance” at -480 tonnes. Readers would have questioned the balance from this outlier, and so GFMS decided not to include the tonnage.
According to my sources PBOC purchases were sourced from institutional supply (from abroad and not through the SGE), which is a supply category not disclosed by GFMS and therefore the tonnage was a problem. (Note, GFMS disclosed the PBOC increment in text, but not in their balance.) For more information read my post PBOC Gold Purchases: Separating Facts from Speculation.
Gold Is More A Currency Than A Commodity
The biggest flaw of the balance model by GFMS is that it depicts gold to be more of a commodity than a currency. It’s focused on mine output and gold recovered from old fabricated products on the supply side, versus retail sales of newly fabricated products on the demand side. In parlance of the firms, how much is produced (supply) versus consumed (demand). Official sector, ETF and exchange inventory changes are then added to the balance. This commodity S&D balance approach by GFMS has caused deeply rooted misconceptions about the essence of gold and its price formation.
The price of a perishable commodity is mainly determined by how much is annually produced versus how much is consumed (used up). However, gold is everlasting, it cannot be used up and its exchange value is mainly based on its monetary applications, from being a currency, or money if you will. Logically the best part of its trading is conducted in above ground reserves. From my perspective the impact of global mine supply, which increases above ground stocks by roughly 1.5 % annually, and retail sales have less to do with gold’s price formation than is widely assumed.
Back to GFMS. Have a look at the picture below that shows their S&D flows for 2015.

GFMS pretends total supply is mine production plus some scrap, which is then met by jewelry demand in addition to retail investment, industrial fabrication and official sector purchases. The way they present it is misleading. These S&D flows are incomplete; they suggest gold is traded like any other commodity. But what about institutional S&D in above ground bullion? Trades that define gold as an international currency.
Let’s do another comparison; this time between what GFMS calls Identifiable Investment demand, consisting of…
- Retail bar & coin
- ETF demand
…versus my what I deem to be a more unadulterated approach of investment demand, consisting of…
- Retail bar & coin
- ETF demand
- Institutional demand
According to my estimates, in 2015 apparent Chinese institutional demand accounted for roughly 1,400 tonnes (exhibit 4). In the Gold Survey 2016 GFMS states on page 15 [brackets added by me]:
Total [global] Identifiable Investment, … posted a modest 5 % increase in 2015, to reach 990 tonnes.
That’s quite a tonnage between global Identifiable Investment by GFMS at 990 tonnes and apparent Chinese institutional demand at 1,400 tonnes. We should also take into account non-apparent institutional demand, gold that changes hands in trading hubs like Switzerland. Unfortunately we can’t always measure institutional S&D, but that doesn’t justify denying its subsistence.
Have a look at the chart below that shows the large discrepancy. In the next chapter we’ll specifically discuss the significance of investment demand in relation to the price of gold.

My point being: what many gold market participants and observers think is total supply and demand is just the tip of the iceberg. This truly is a staggering misconception created by the firms.

When observing the GFMS balance in exhibit 1 its incompleteness is self-evident. At the bottom we can see the line item “net balance”, which reflects the difference between total supply and total demand. According to GFMS, if the “net balance” is a positive figure there was a surplus in the global gold market, and if “net balance” is a negative figure the market has been in deficit. In the real world this figure is irrelevant. Gold supply and demand are by definition always equal. One cannot sell gold without a buyer, and one cannot buy gold without a seller. Furthermore the gold market is deep and liquid. So how come there is a difference between total supply and total demand in the GFMS balance? As I’ve demonstrated before, because GFMS doesn’t include institutional S&D that in reality makes up for the difference and far beyond. In all its simplicity the “net balance” item reveals their data is incomplete.
Let’s have another stab at this. How can “net balance” exist in the real world, for example in 2009? According to GFMS the gold market had a 394 tonnes surplus in 2009. But how? Were miners left with 394 tonnes they couldn’t sell? Or some supranational entity decided to soak up the surplus to balance the market? Naturally, this is not what happens. Total supply and total demand are always equal, but GFMS doesn’t record all trades.
Moreover, in my opinion the words “surplus” and “deficit” do not apply to gold. There can be no deficit in gold; there will always be supply. At the right price that is. Sometimes Keynesian economists claim there is not enough gold in the world for it to serve as the global reserve currency. Austrian economists then respond by saying that there will always be enough gold at the right price. I agree with the Austrians and their argument also validates why there can be no deficit in gold.
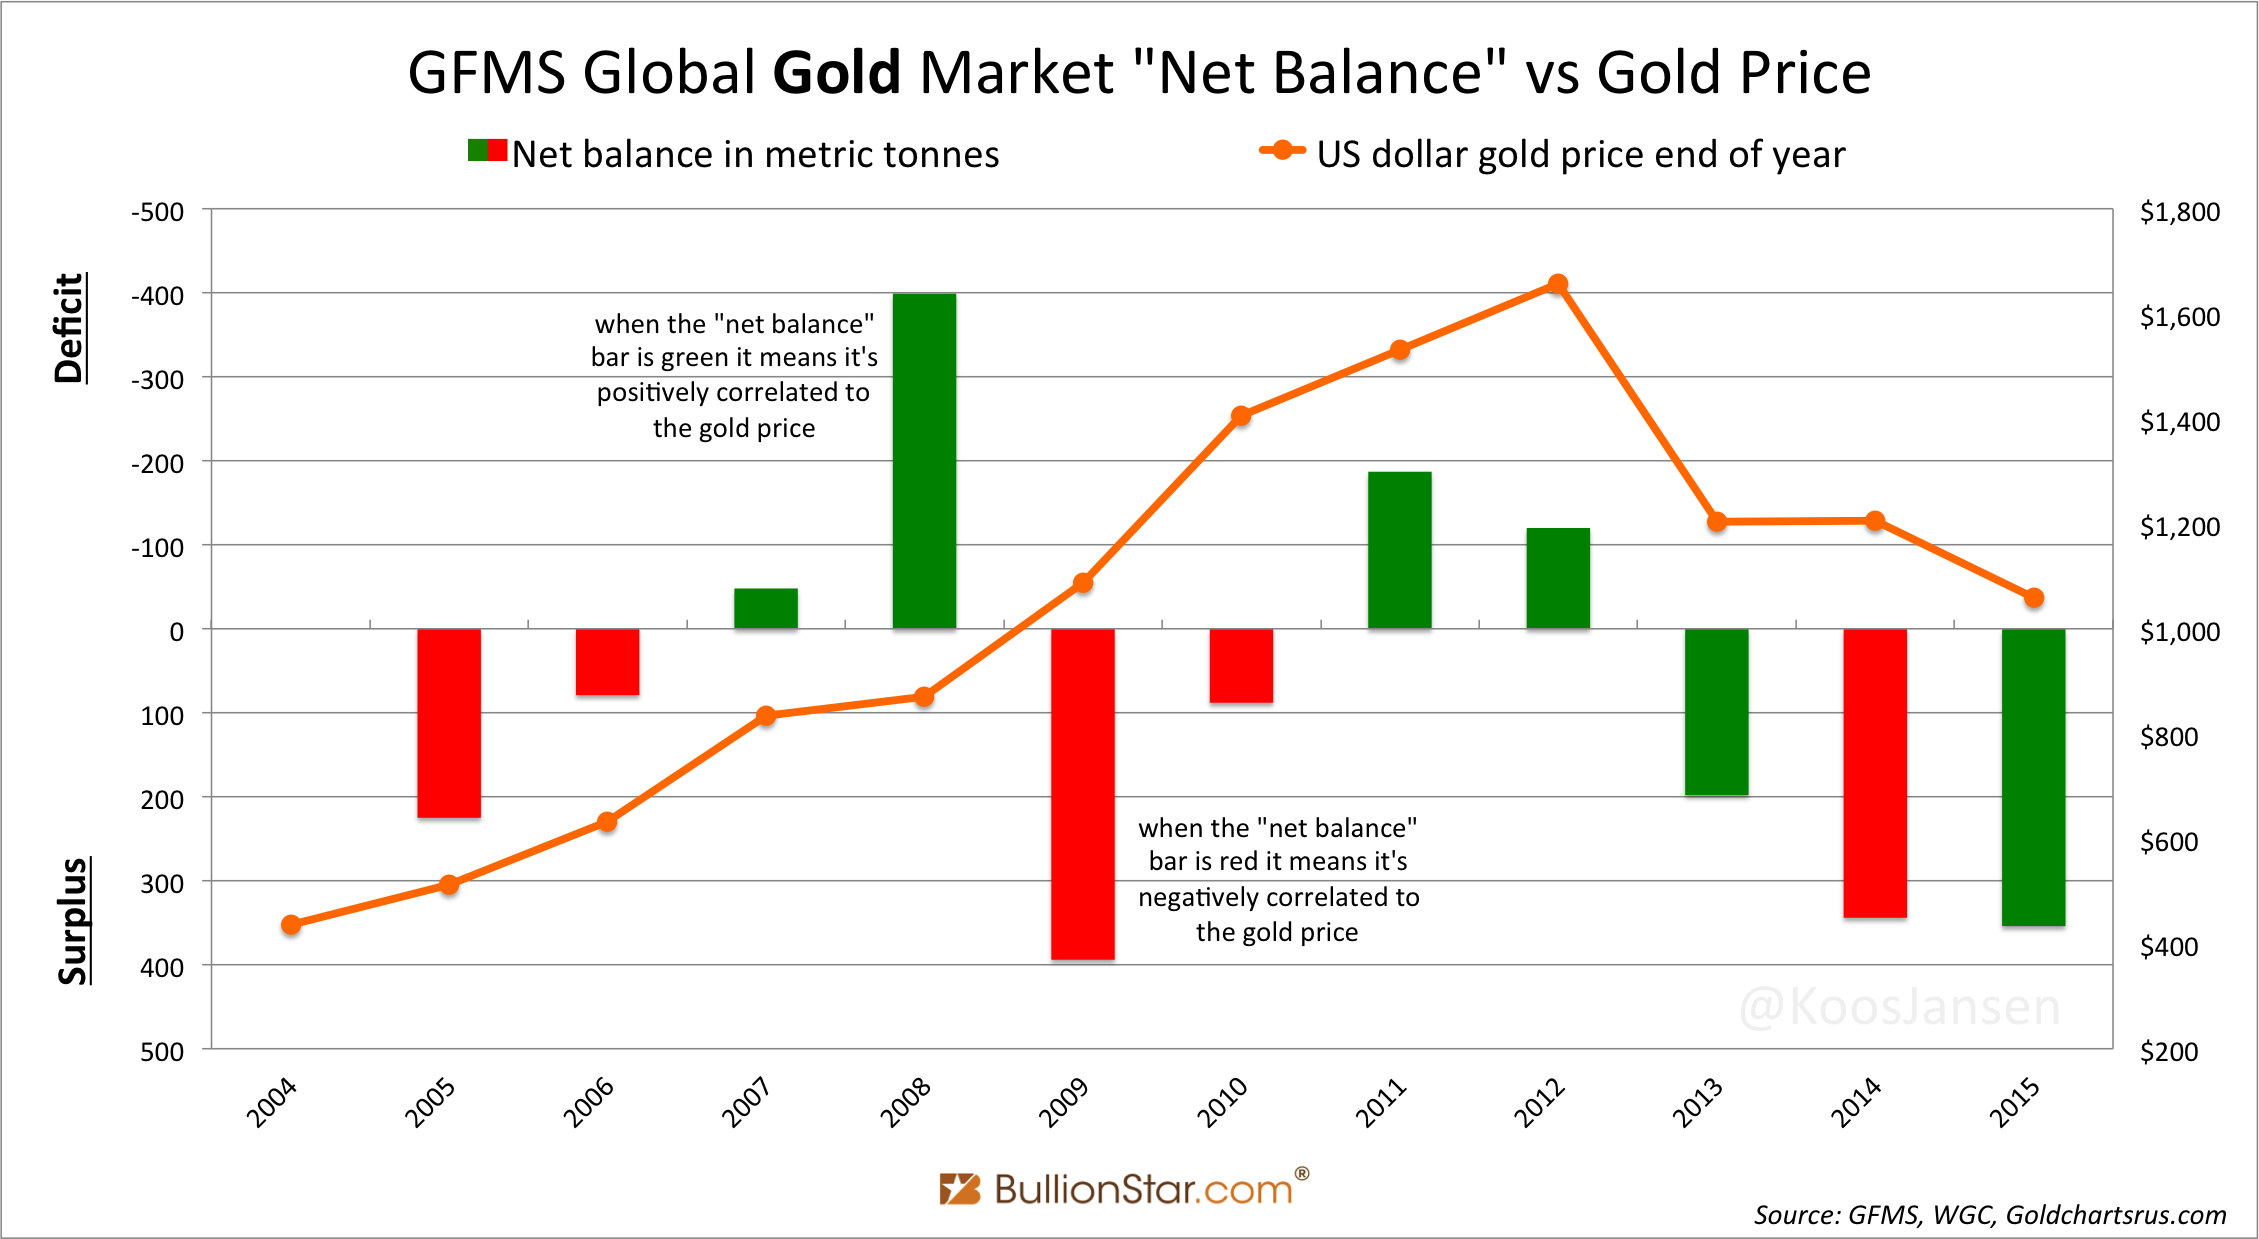
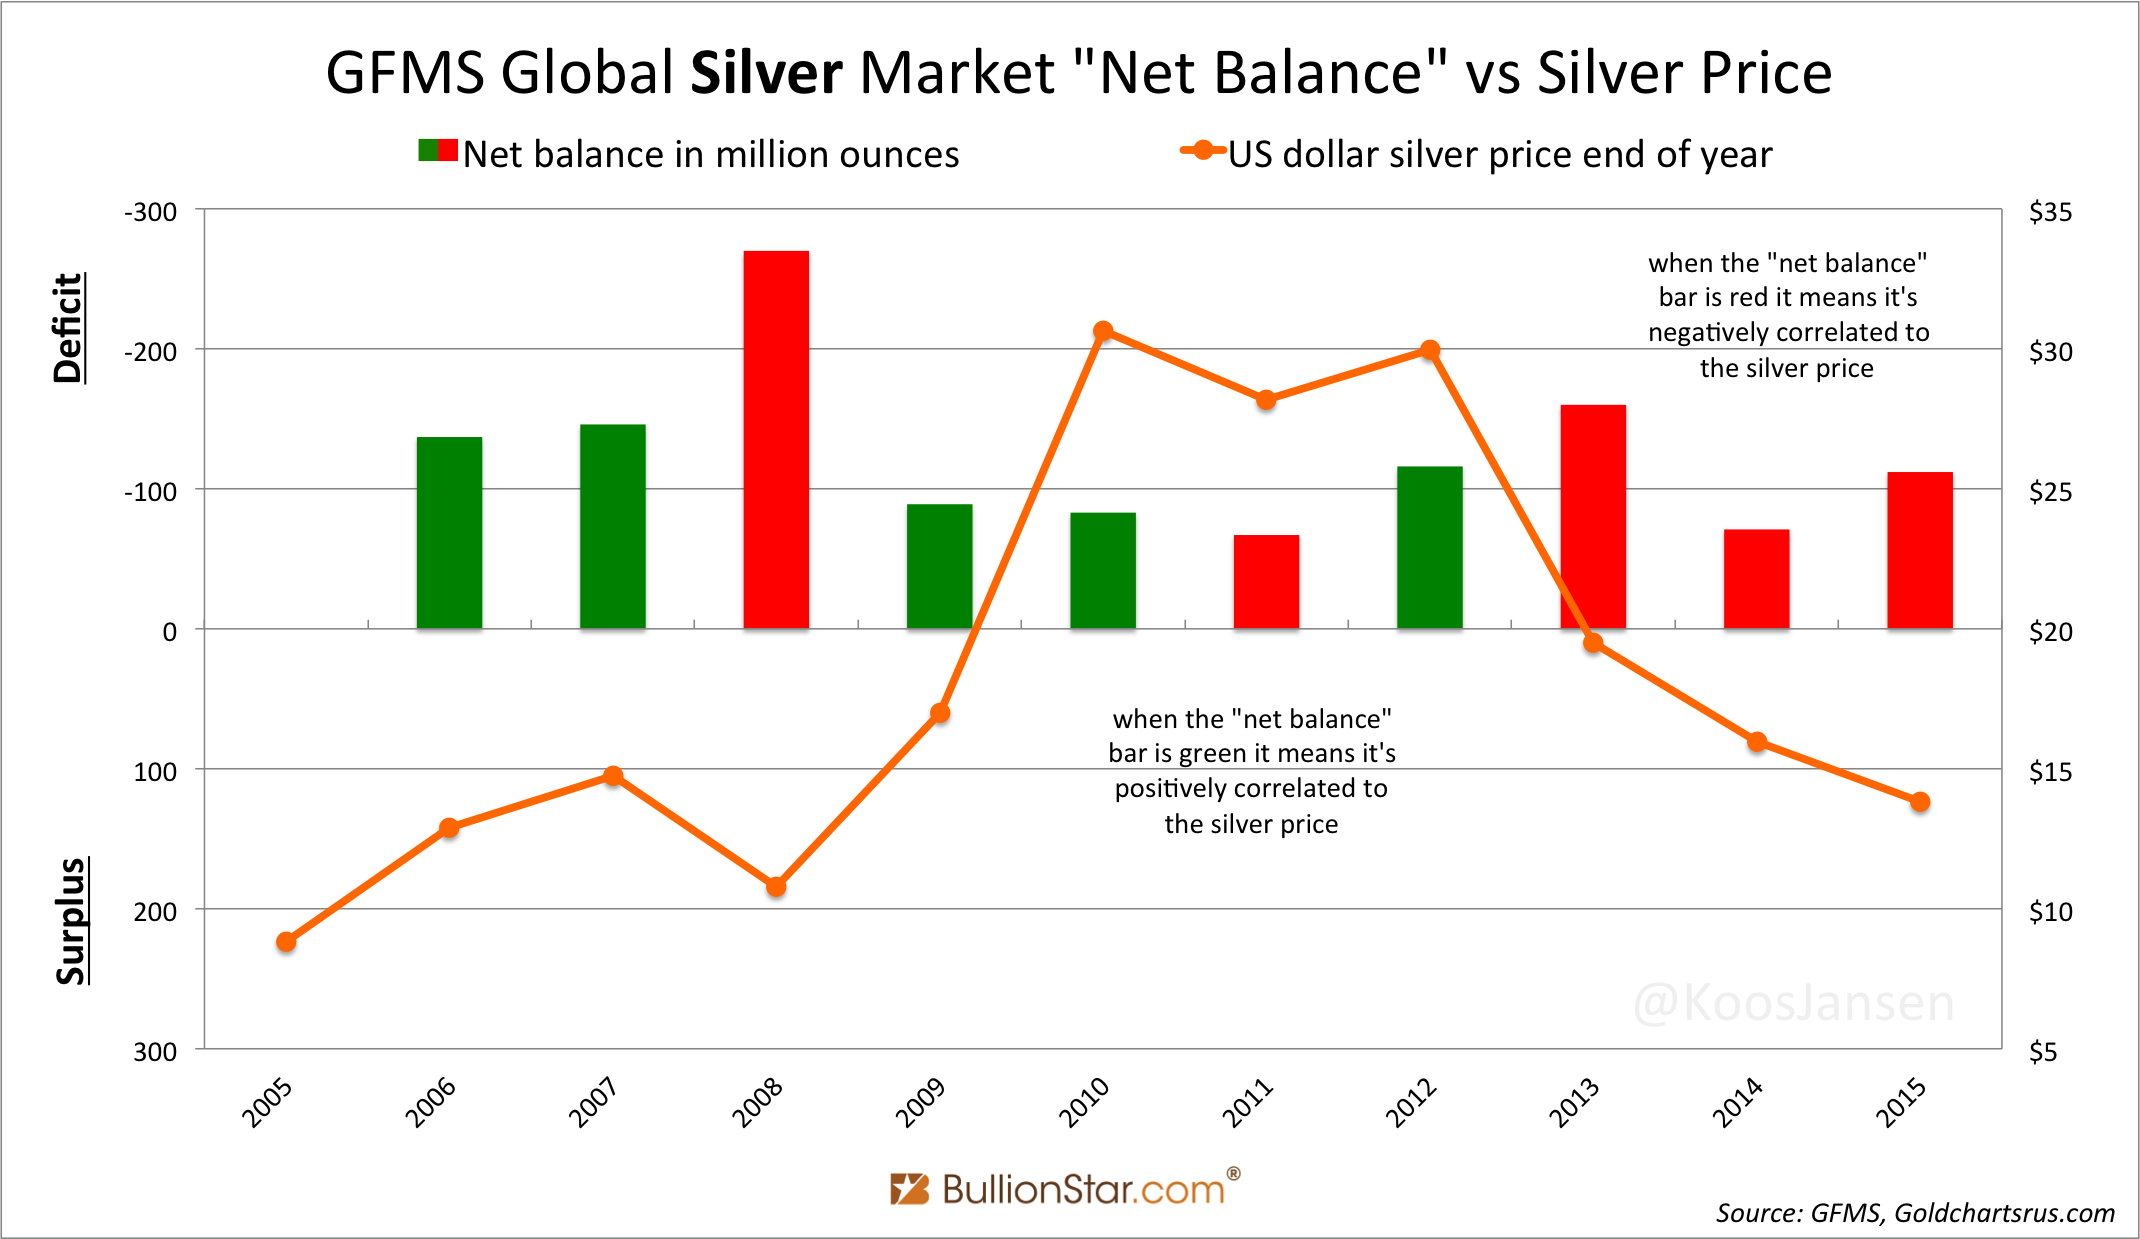
There is more proof the “net balance” item presented by GFMS is meaningless. Although according to GFMS the market had a 394 tonnes “surplus” in 2009 the price went up by 25 % during that year. This makes no economic sense. A surplus suggests a declining price, not the other way around. Tellingly, S&D forces presented in GFMS balances are often negatively correlated to the gold price, as was the case in 2005, 2006, 2009, 2010 and 2014 (exhibit 1). In conclusion, GFMS S&D balances are not only incomplete, the resulting “net balance” items are misleading with respect to the price. Below are a few charts that demonstrate this conclusion.
If we plot “net balance” versus the end of year price of gold we can see the correlation is often negative. Have a look below. Green “net balance” chart bars show a positive correlation to the gold price, red chart bars show a negative correlation (note, the left axis is inverted for a more clear overview between any “deficit/surplus” and the price of gold). As you can see nearly half of the “net balance” chart bars are negatively correlated to the price of gold.
Mind you, although the “net balance” item is often negatively correlated to the gold price, in the Gold Survey 2016 GFMS states on page 9:
In terms of the Net Balance, 2015 marked the third year in which the gold market remained in surplus, and therefore it is not surprising that the bear market continued.
And on page 14:
The forecast reduction in global mine output and a gradual recovery in demand will see the physical surplus narrow in 2016, providing support to the gold price and laying the foundation for better prospects.
GFMS likes to pretend any “surplus” or “deficit” arising from their balance is correlated to the price, but the facts reveal this is not true.
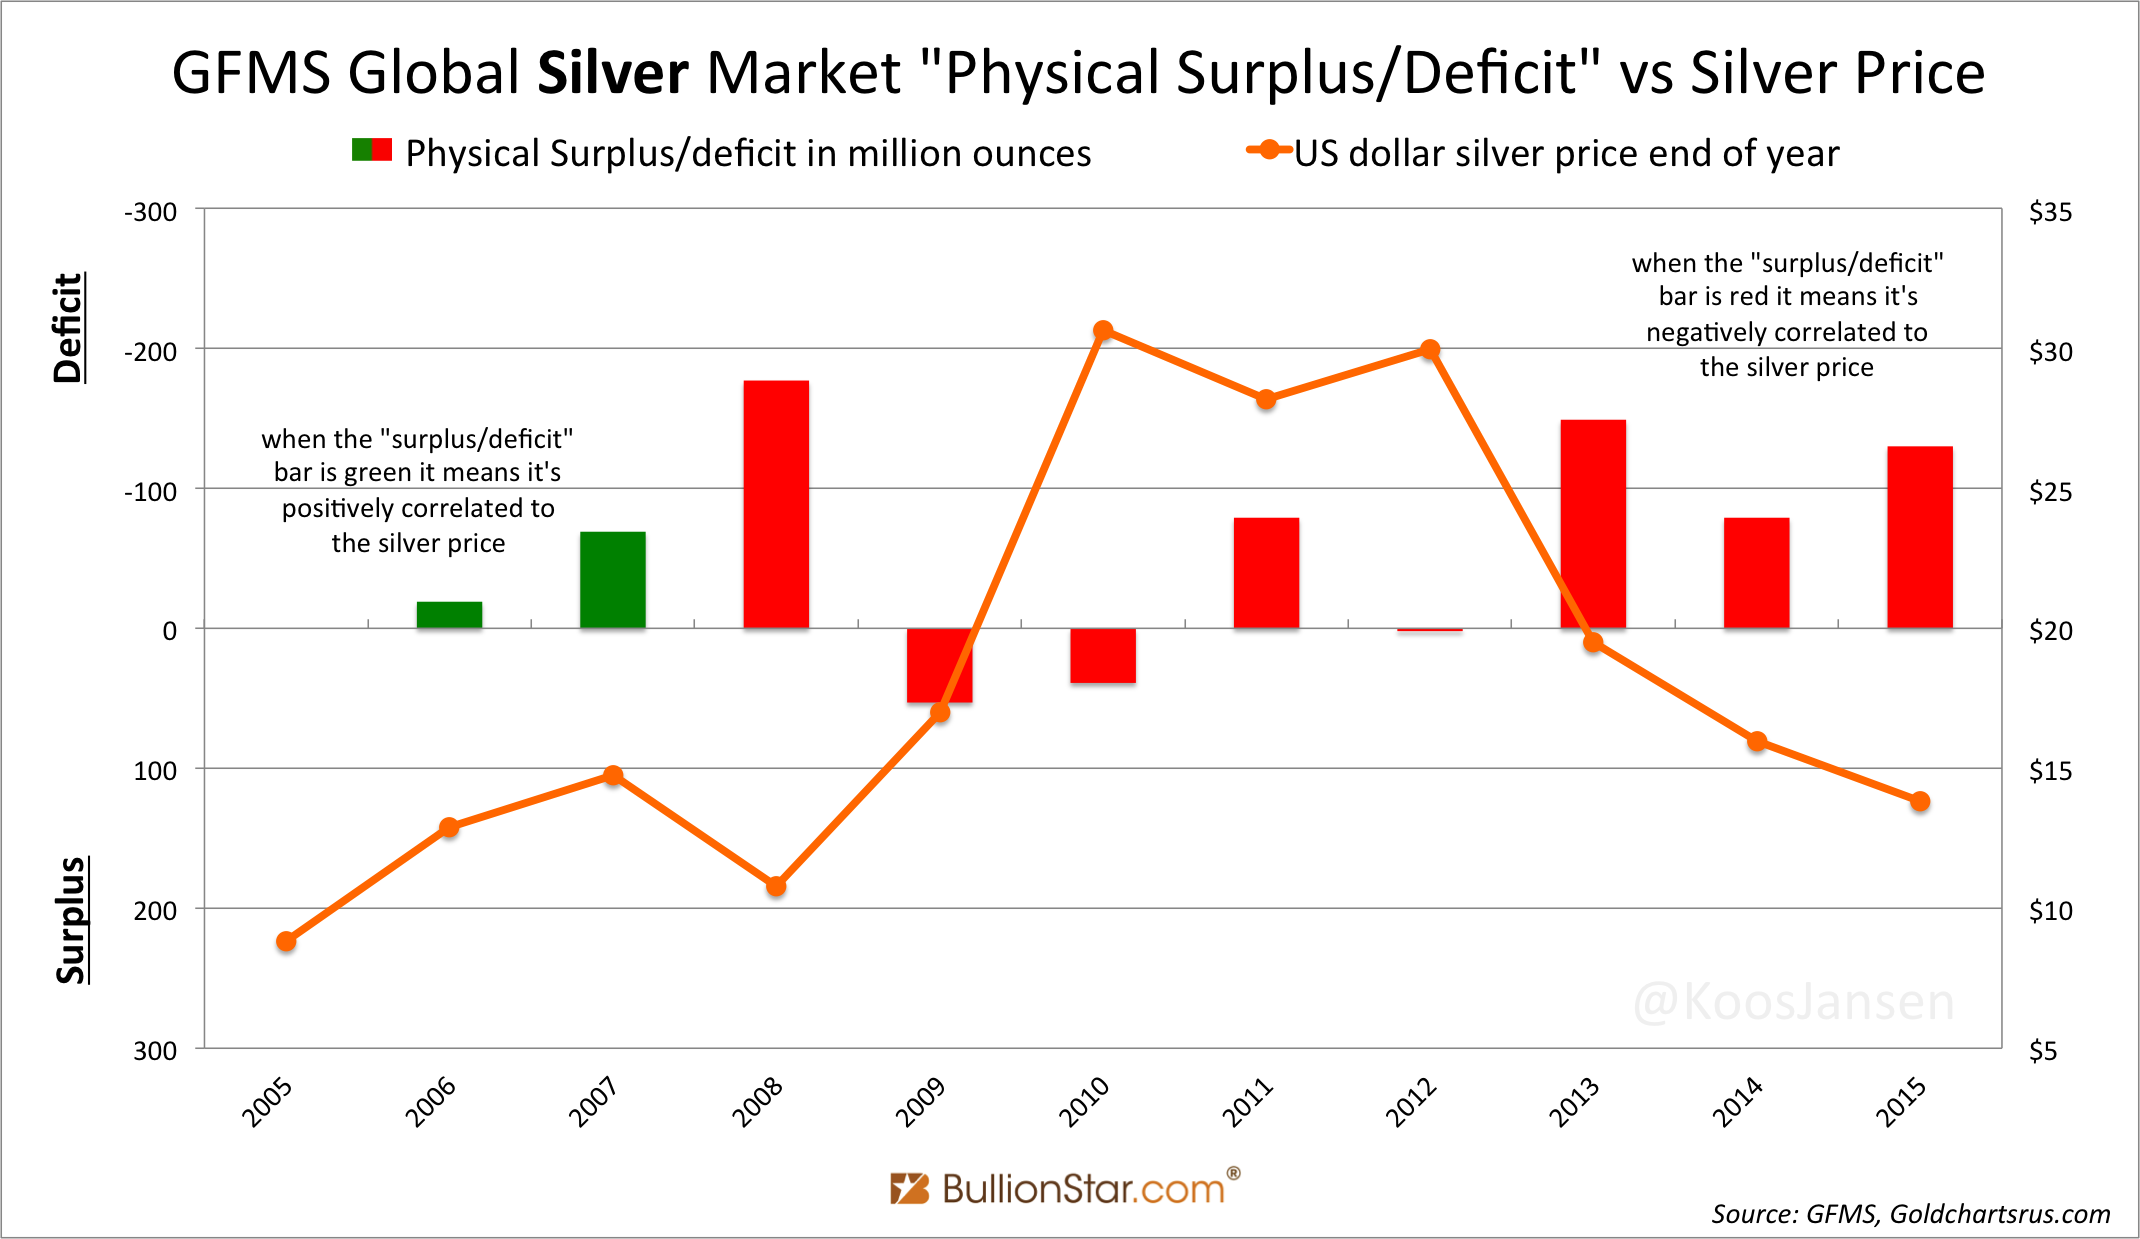
Let us plot the “physical surplus/deficit” line item by GFMS (exhibit 1) versus the gold price. This results in even more negative correlations.
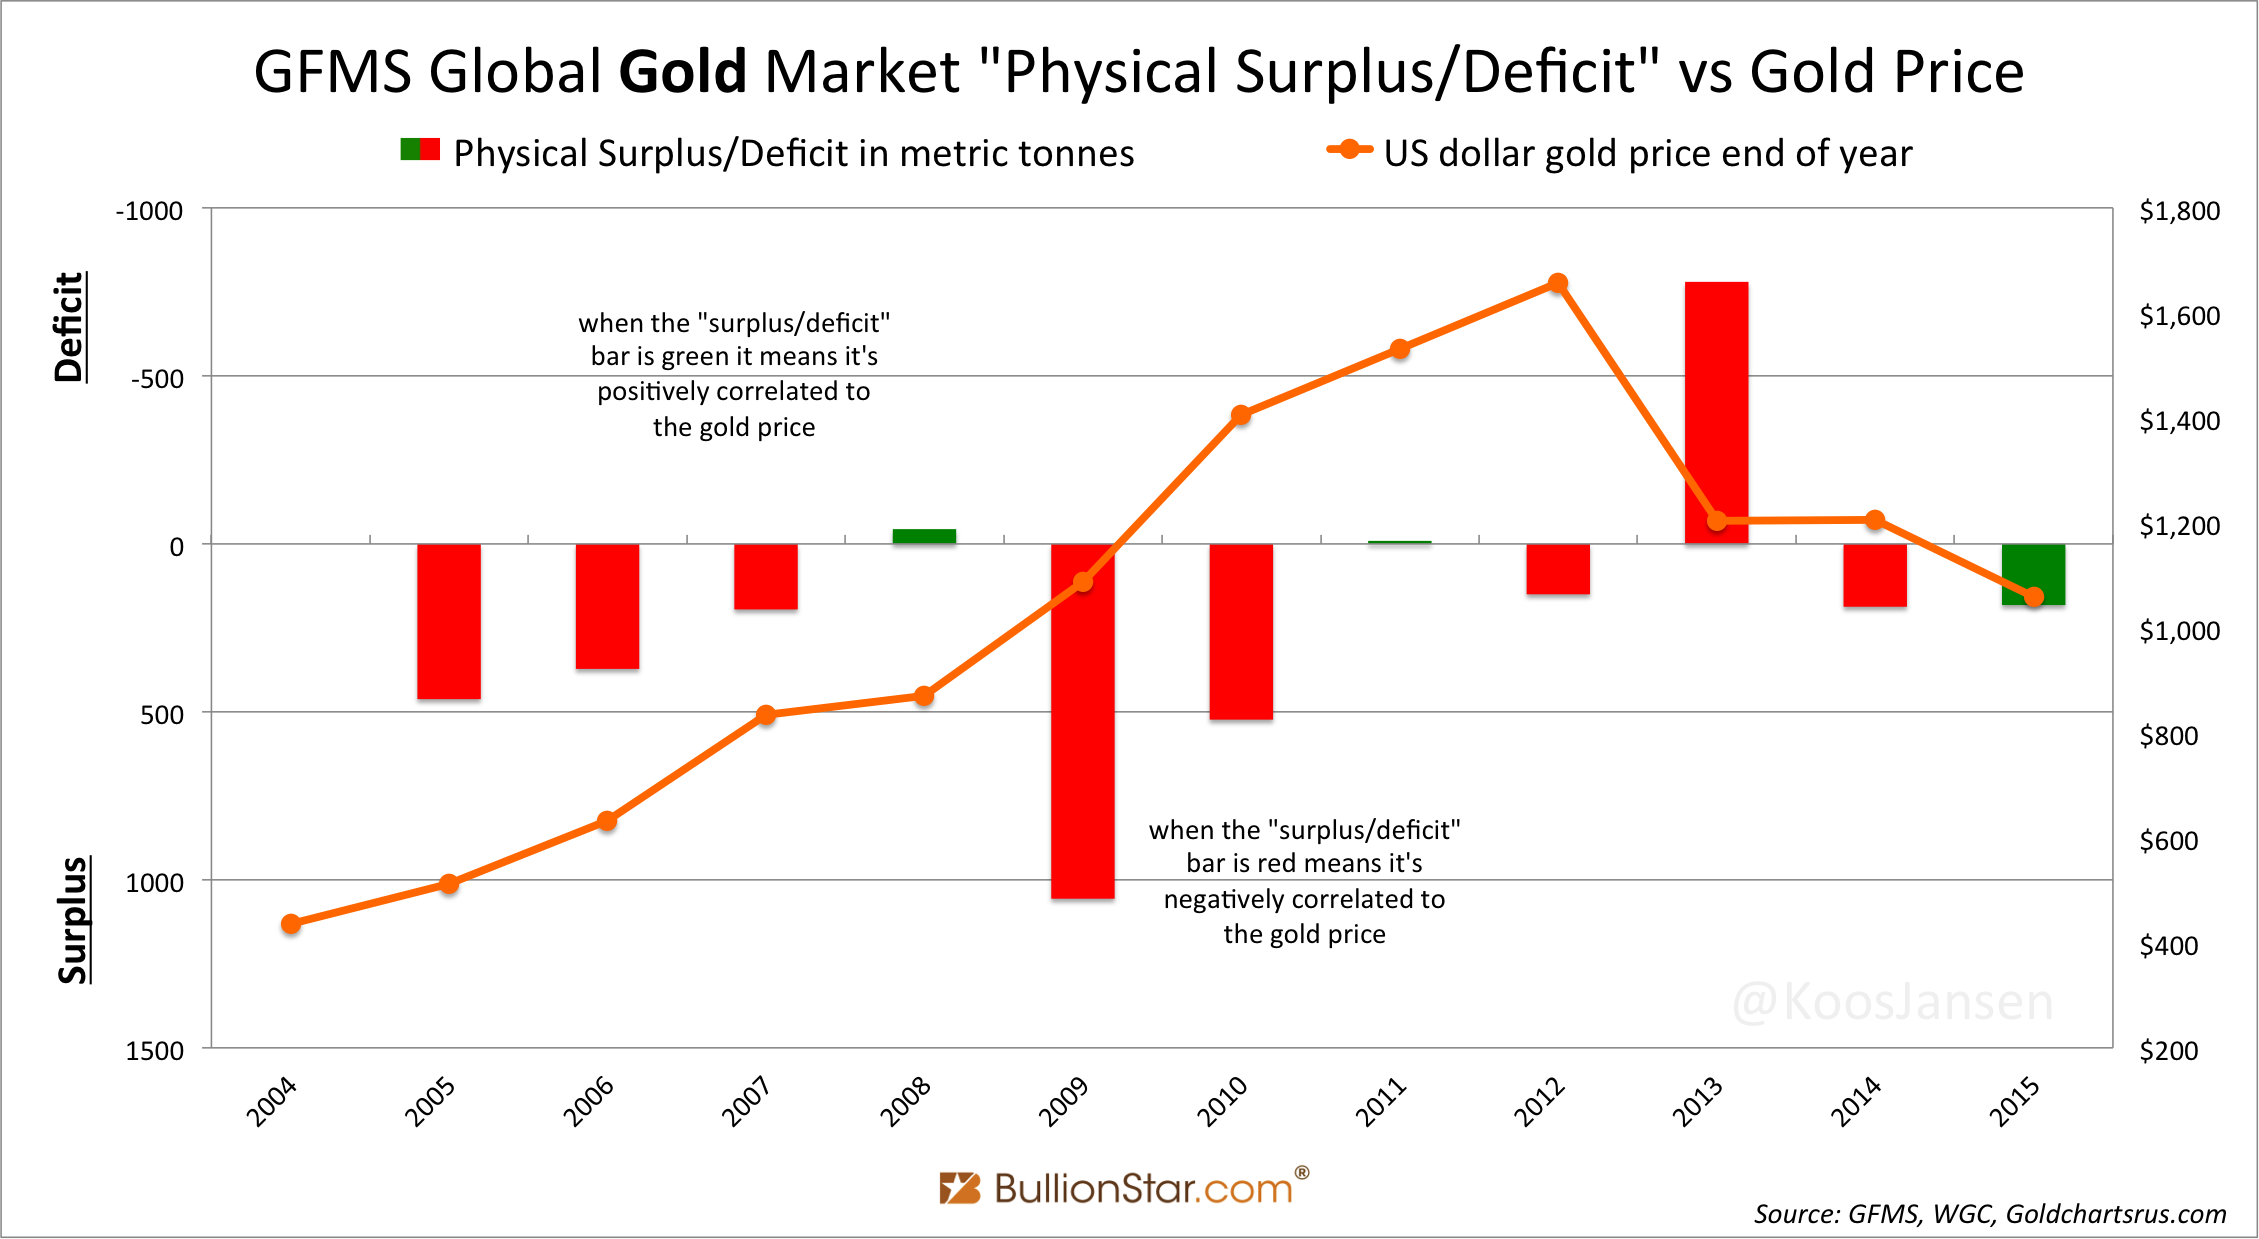
This exercise reveals that a positive correlation between either a “surplus” or “deficit” arising from a GFMS balance and the price of gold is just a coincidence. No surprise when one is aware their S&D data is incomplete.
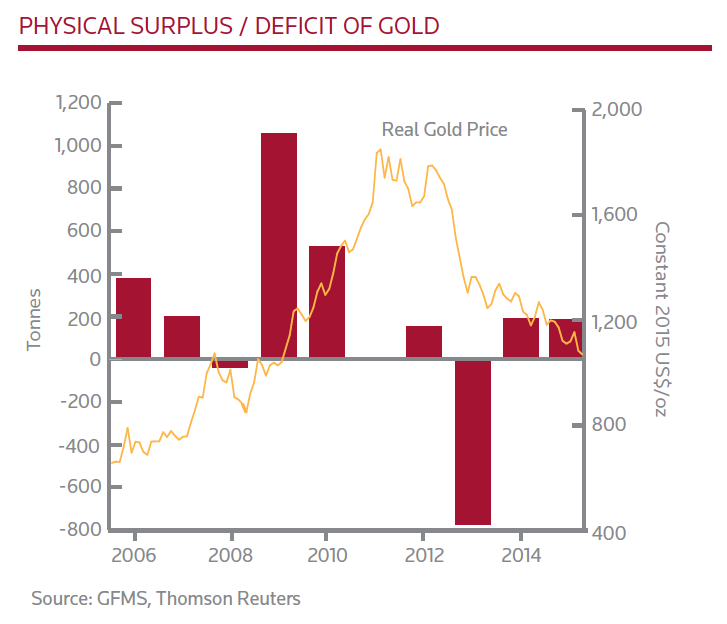
Remarkably, the last chart was also published in the Gold Survey 2016, but GFMS chose not to invert the left axis and doesn’t disclose what we see is a surplus or deficit. As a result the largest surpluses (2006, 2007, 2009, 2010) seem to correlate with a rising price, though in reality they did the opposite. Compare the chart below with the one above.
GFMS also publishes S&D balances for silver (a monetary metal that is comparable to gold). For silver the presented correlations by GFMS between a “surplus” or “deficit” in relation to the price are even weaker.
According to GFMS the silver market is always in deficit, but the price goes up and down. Obviously GFMS neglects to measure institutional S&D for silver.
Conclusion
In my opinion, when Gold Fields Mineral Services (GFMS) was erected many decades ago they made a mistake to adopt a commodity S&D balance approach. Surely with the best intentions they gather intelligence and retrieve data from the market. But we must be aware this is not the full picture. The most significant data is not disclosed by GFMS.
When it comes to what drives the price of gold GFMS and I agree it’s determined by gold’s role as a currency in the global economy. When reading the chapter PRICE AND MARKET OUTLOOK in the Gold Survey 2016, GFMS shares its insights with respect to the gold price. Factors mentioned are:
- Turmoil in global stock markets
- A Chinese hard landing
- Geopolitical tensions in the Middle-East
- Central bank stimulus (QE)
- Global economic weakness
- Interest rates policy by central banks
- Low risk asset / safe haven demand
So if these factors drive the gold price, in what S&D category would this materialize? Would (large) investors buy and sell jewelry? Or bullion bars? I think the latter. According to my analysis the price of gold is largely determined by institutional demand, and to a lesser extent ETF and retail bar & coin demand.
Let’s do an exercise to see what physical gold S&D trends correlate to the price. The majority of supply on the GFMS balance consists of mine output and the majority of demand on the GFMS balance consists of jewelry consumption. But if we plot these volumes versus the price of gold in a chart, there is no push and pull correlation*. For example, when the gold price surged from 2002 until 2011 jewelry consumption was not rising. Neither was it outpacing mine supply. The opposite happened, to be seen in the graph below. This is because jewelry demand is price sensitive – when the price goes up jewelry demand goes down, and vice versa. Jewelry demand is not driving the price of gold.
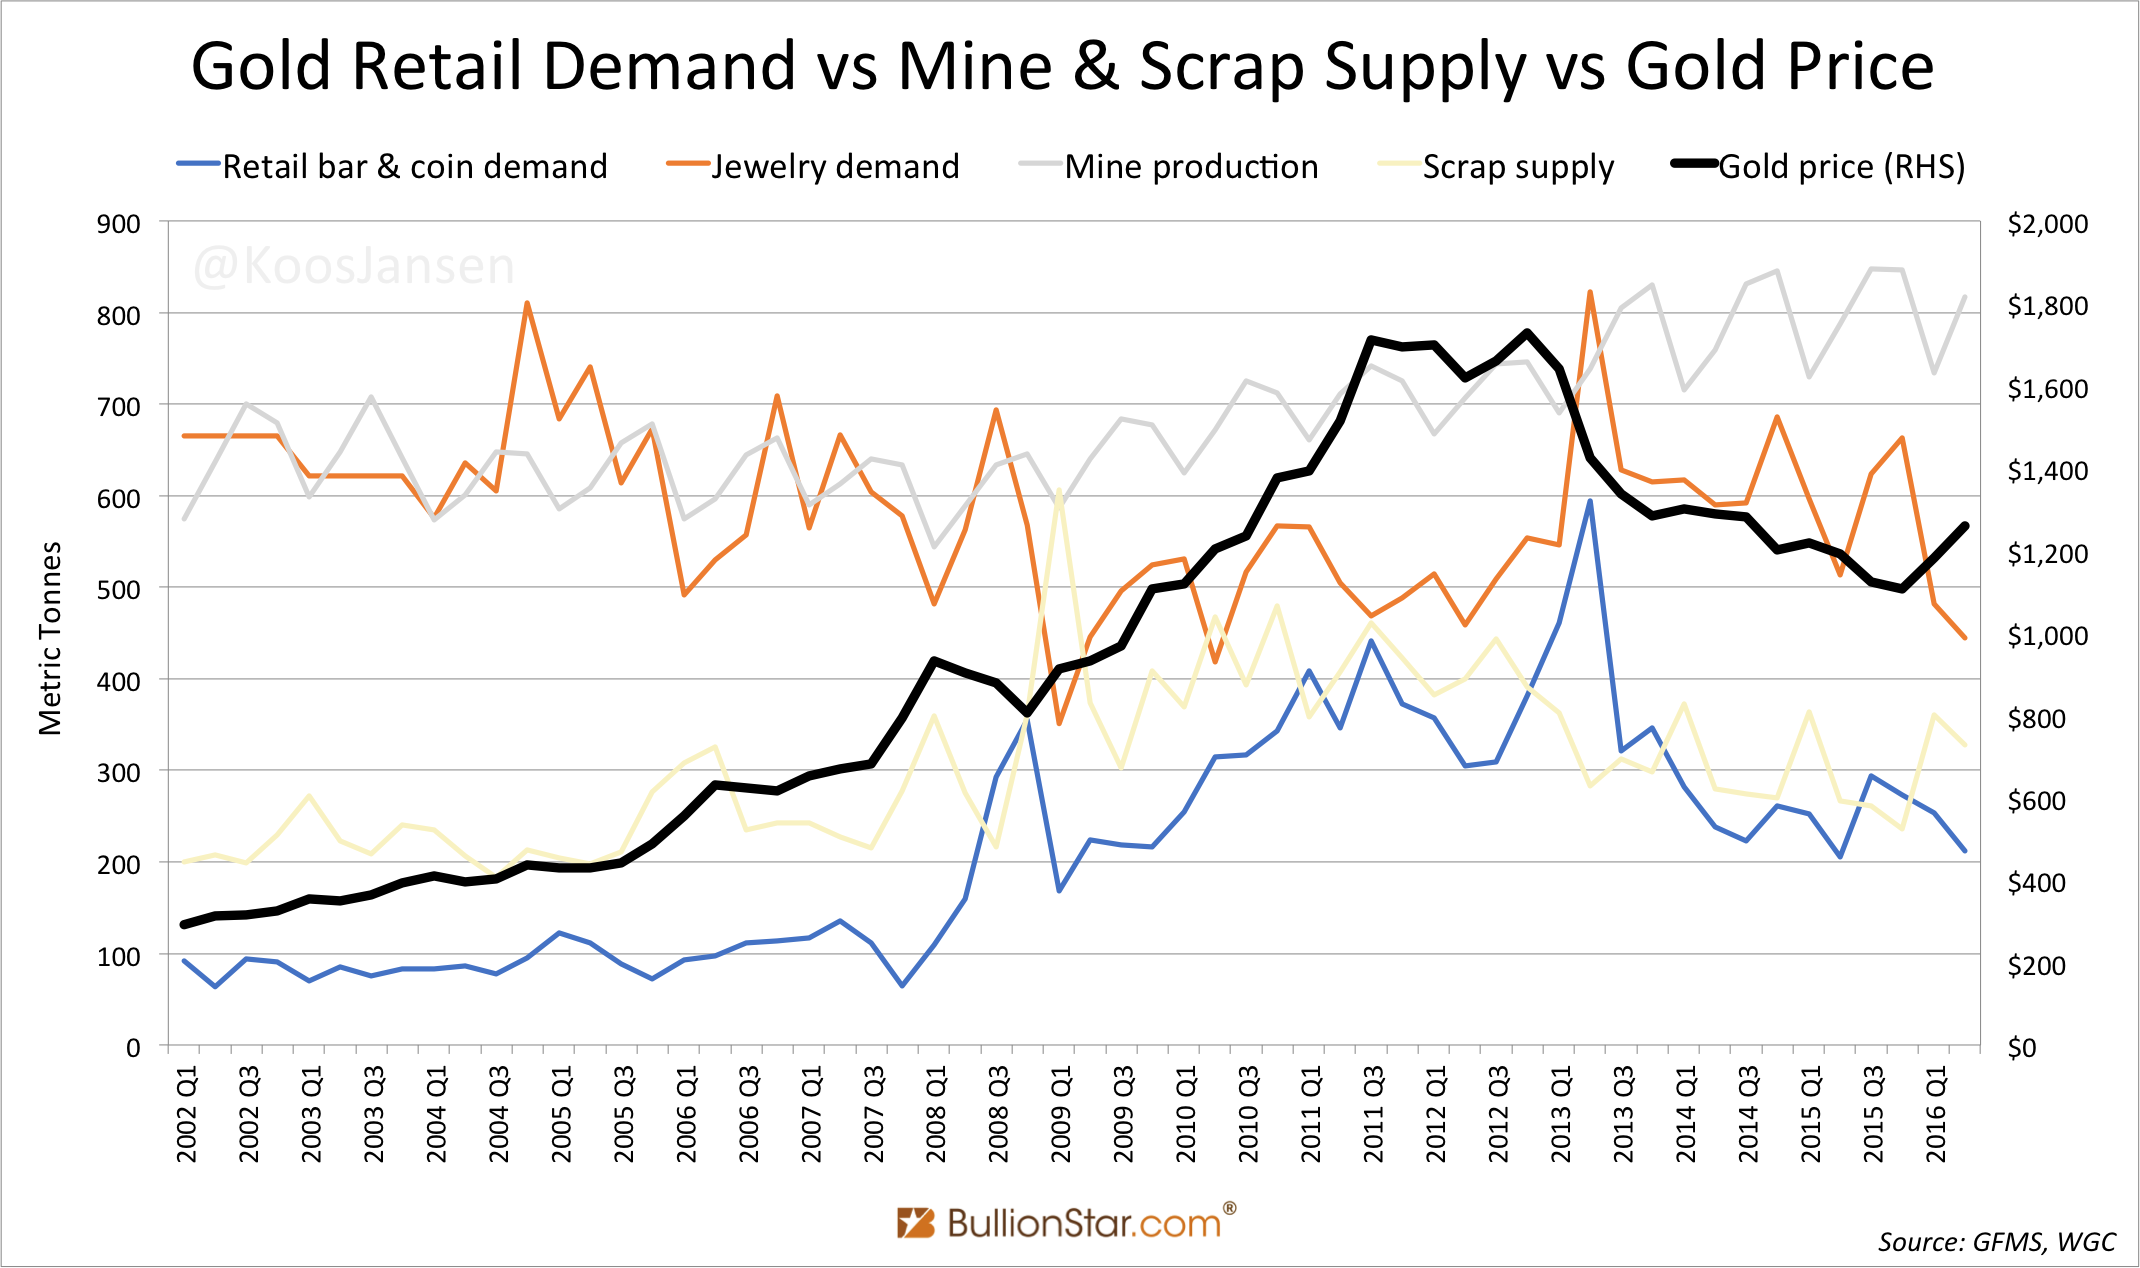
I also added retail bar & coin demand. Interesting to see is that retail bar & coin demand is on one hand a price driver, moving up and down in sync with the gold price, on the other hand it can be price sensitive having brief spikes when the price of gold declines.
The best correlation between physical S&D in relation to the gold price can be seen in institutional and ETF S&D. One of the largest gold trading hubs in the West is the UK, home of the London Bullion Market that also vaults the largest ETF named GLD. The UK has no domestic mine production, no refineries and national gold demand is neglectable in the greater scheme of things. Therefore, by measuring the net flow of the UK (import minus export) we can get a sense of Western institutional and ETF demand and supply. For example, if the UK is a net importer – import demand being greater than export supply – that signals a net pull on above ground stocks. Approximately one third of the UK’s net flow corresponds to ETF inventory changes, the other two thirds reflect pure institutional S&D.
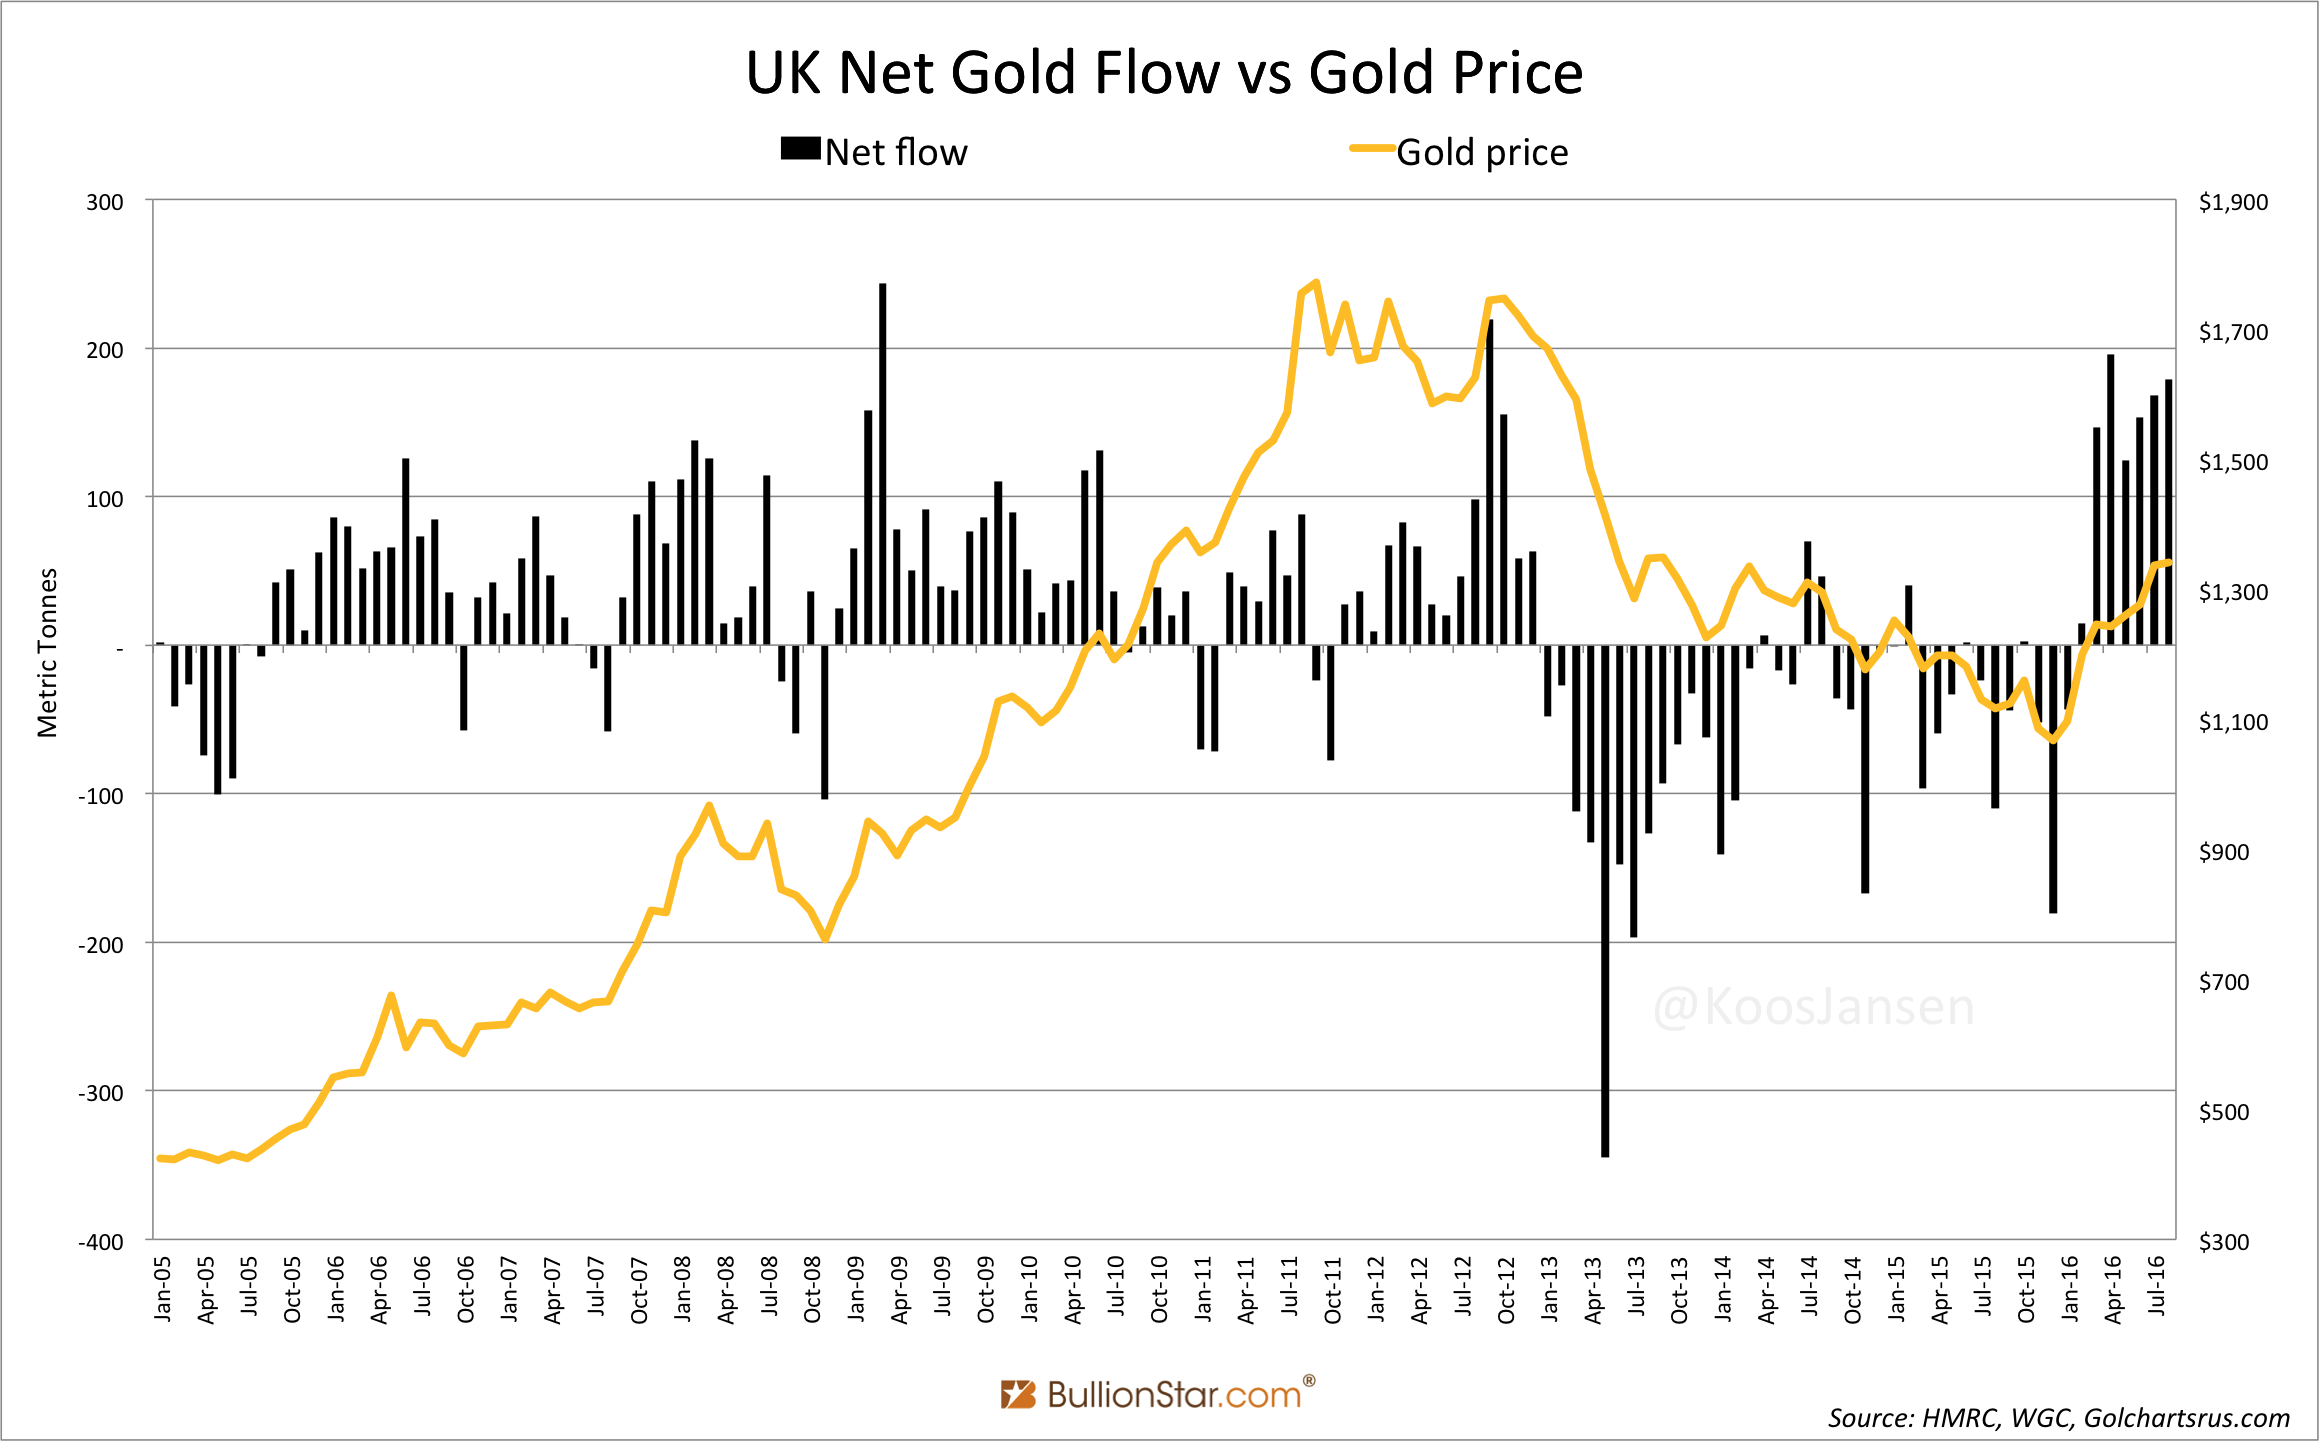
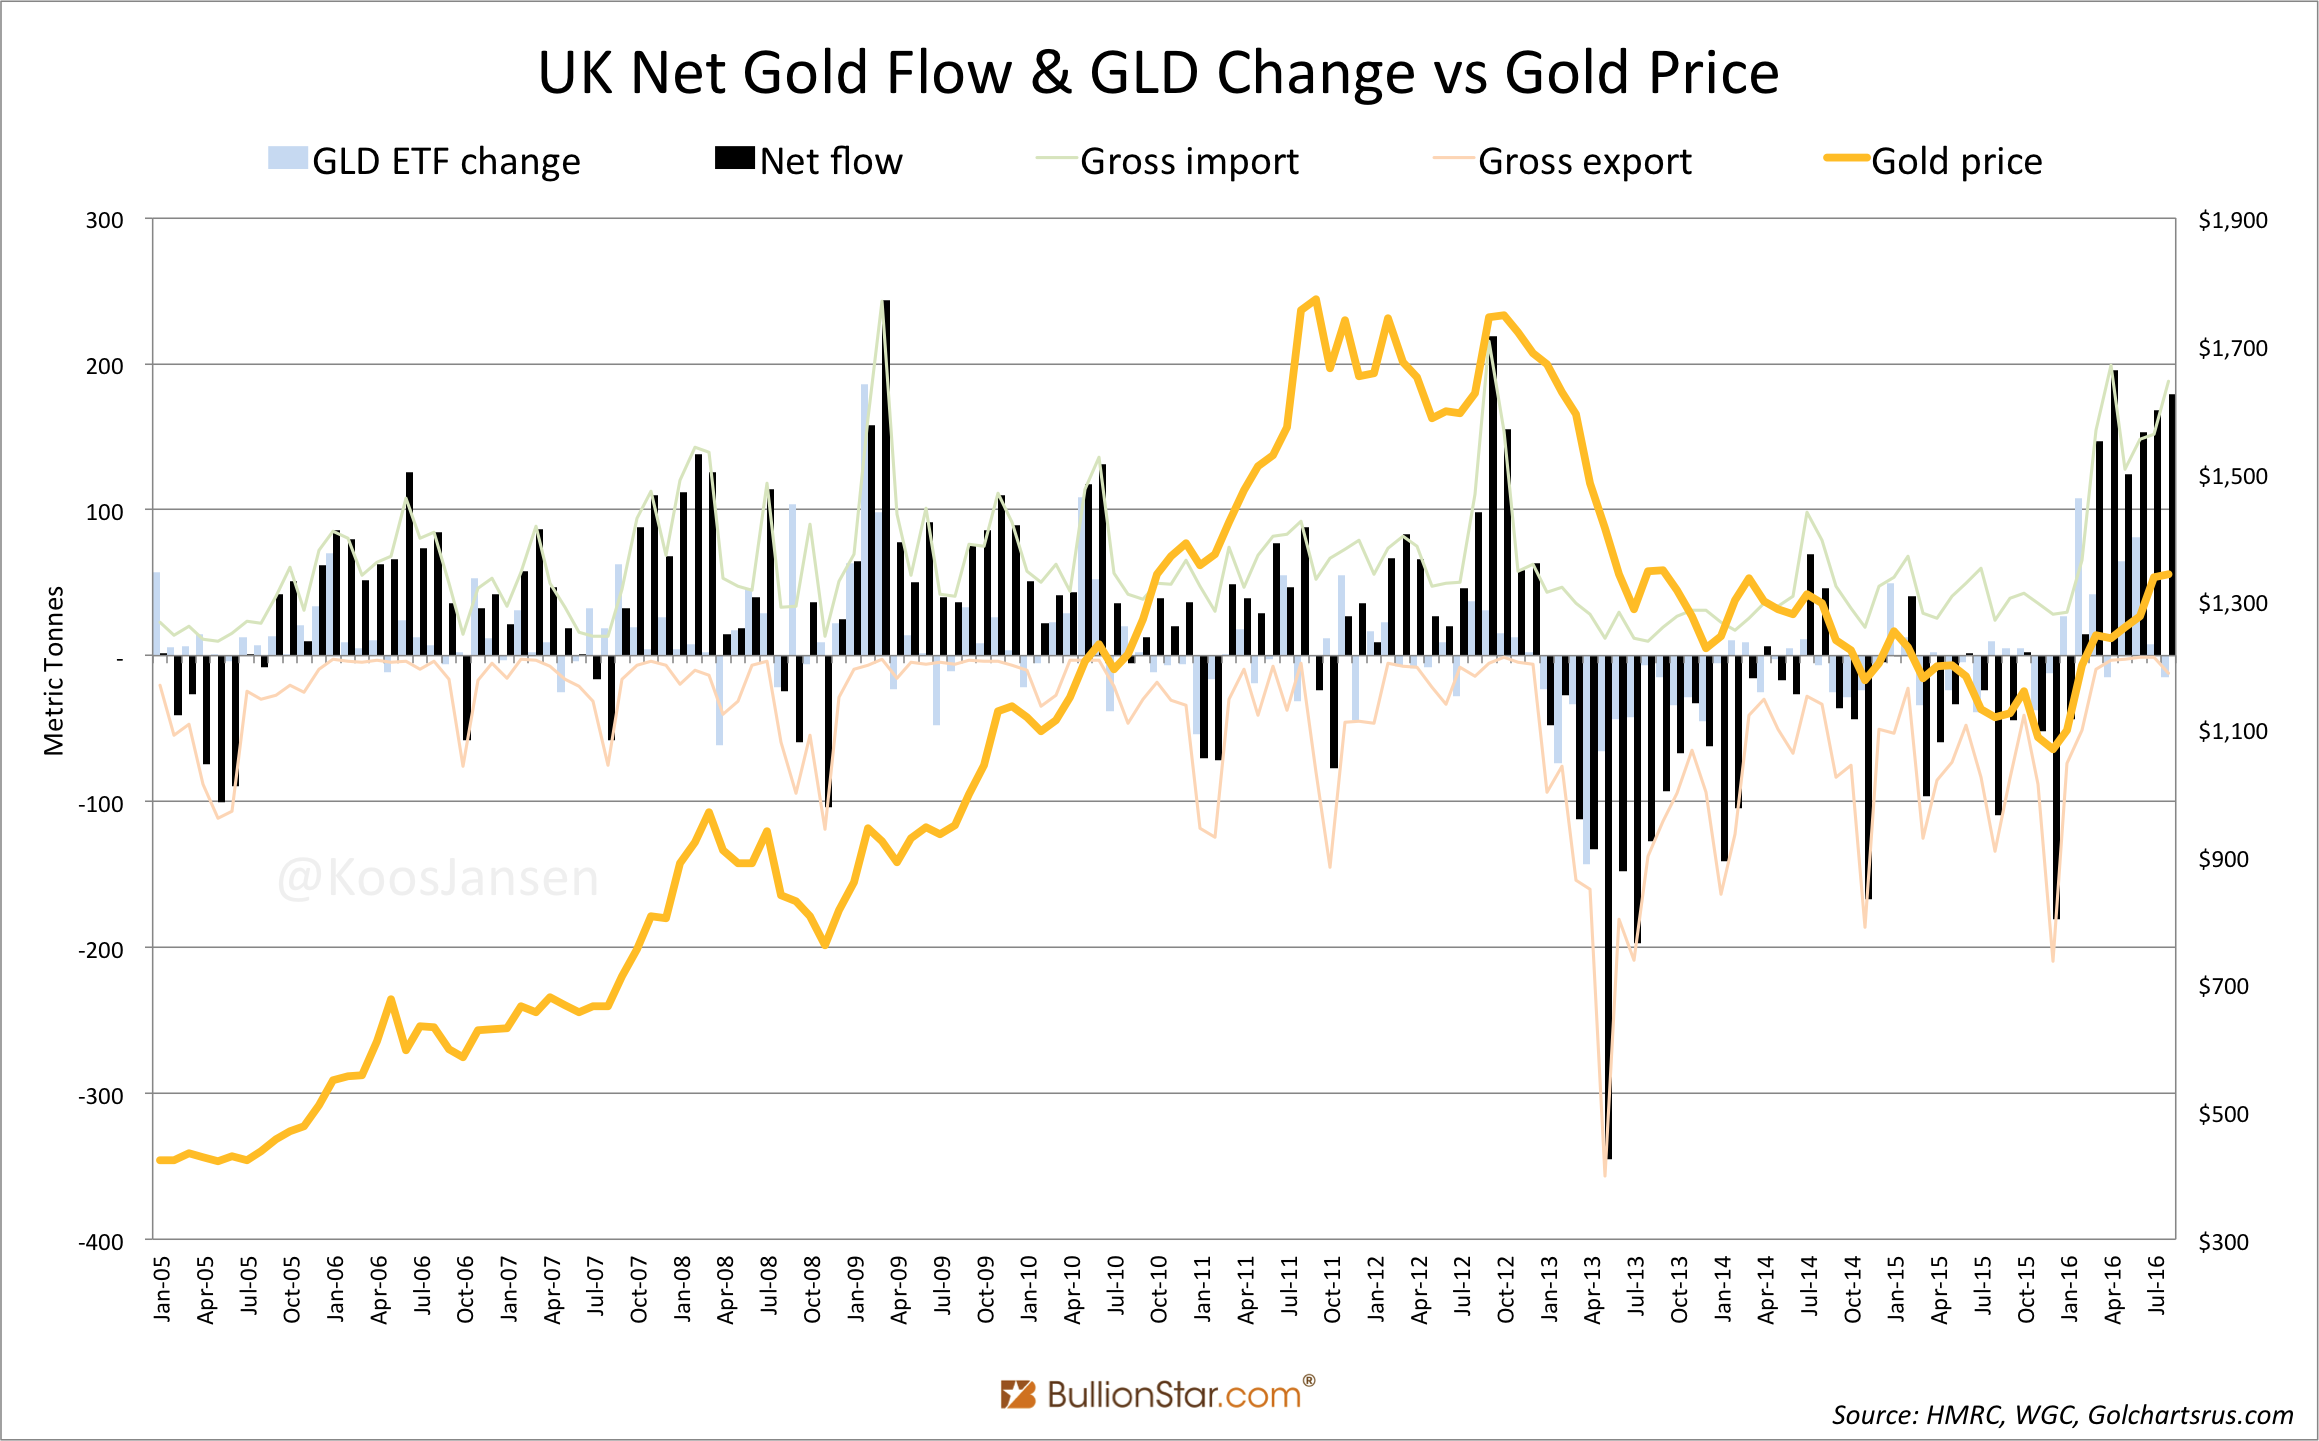
In the charts above we can observe a remarkable solid correlation between the UK’s net flow and the gold price. The UK is a net importer on a rising price and net exporters on declining price. The shown correlation can’t be a coincidence, though there’s no guarantee it will prevail in the future.
The two charts above show the (medium/long term) gold price is mostly determined by institutional supply and demand in above ground reserves. Effectively, GFMS is hiding the most important part of global physical gold flows.
When I asked an analyst at one of the leading firms why his company doesn’t measure institutional S&D he told me candidly, “because it’s extremely difficult to accurately estimate it”. And it is. As I wrote previously, I can’t exactly measure global institutional S&D either. However, very often publicly available information gives us a valuable peek at it, and it shows to be more relevant to the gold price than what the firms keep staring at. Not knowing exactly what institutional S&D accounts for doesn’t mean GFMS shouldn’t pay attention to it.
But the firms keep trying to uphold the illusion the data they’ve been selling for decades is complete. For if they would plainly confess it was incomplete, future business could be severely damaged.
What I blame these firms is that they’ve created a meme that the gold market is as large as annual mine supply. This has caused all sorts of misconceptions. Often I read analyses based on a comparison between quantitative demand and mine output. Such analyses are likely to jump erroneous conclusions.
H/t Ronan Manly, Bron Suchecki, Nick Laird from Goldchartsrus.com
Appendix
Simplified overview gold flows 2015:

Popular Blog Posts by Koos Jansen
 China’s Secret Gold Supplier is Singapore
 Audits of U.S. Monetary Gold Severely Lack Credibility
 China Gold Import Jan-Sep 797t. Who’s Supplying?
 The Gold-Backed-Oil-Yuan Futures Contract Myth
 Estimated Chinese Gold Reserves Surpass 20,000t
 PBOC Gold Purchases: Separating Facts from Speculation
 U.S. Mint Releases New Fort Knox Audit Documentation
 China Net Imported 1,300t of Gold in 2016
 Why SGE Withdrawals Equal Chinese Gold Demand and Why Not