
China Gold Import Jan-Sep 797t. Who’s Supplying?

 Koos Jansen
While the gold price is slowly crawling upward in the shadow of the current cryptocurrency boom, China continues to import huge tonnages of yellow metal. As usual, Chinese investors bought on the price dips in the past quarters, steadfastly accumulating for a rainy day. The Chinese appear to be price sensitive regarding gold, as was mentioned in the most recent World Gold Council Demand Trends report, and can also be observed by Shanghai Gold Exchange (SGE) premiums – going up when the gold price goes down – and by withdrawals from the vaults of the SGE which are often increasing when the price declines. Net inflow into China accounted for an estimated 777 tonnes in the first three quarters of 2017, annualized that’s 1,036 tonnes.

Demonstrated in the chart above Chinese gold imports and known gold demand by the Rest Of the World (ROW) add up to thousands of tonnes more than what the ROW produces from its mines. One might wonder where Chinese gold imports come from, which is why I thought it would be interesting to analyse as detailed as possible who’s supplying China. Is one country, or only the West, supplying China? Although absolute facts are difficult to cement, my conclusion is that China is supplied by a wide variety of countries on several continents this year.
China doesn’t publish its gold import figures so we have to measure exports from other countries to the Middle Kingdom for this exercise. This year the primary hubs that exported to China have been Switzerland and Hong Kong.
The Swiss net exported 18 tonnes to China in September, which brings the year to date total to 221 tonnes, down 4 percent year on year. Because Switzerland is the global refining centre, a storage centre and trading hub I’ve plotted a chart showing its gross imports and exports per region.
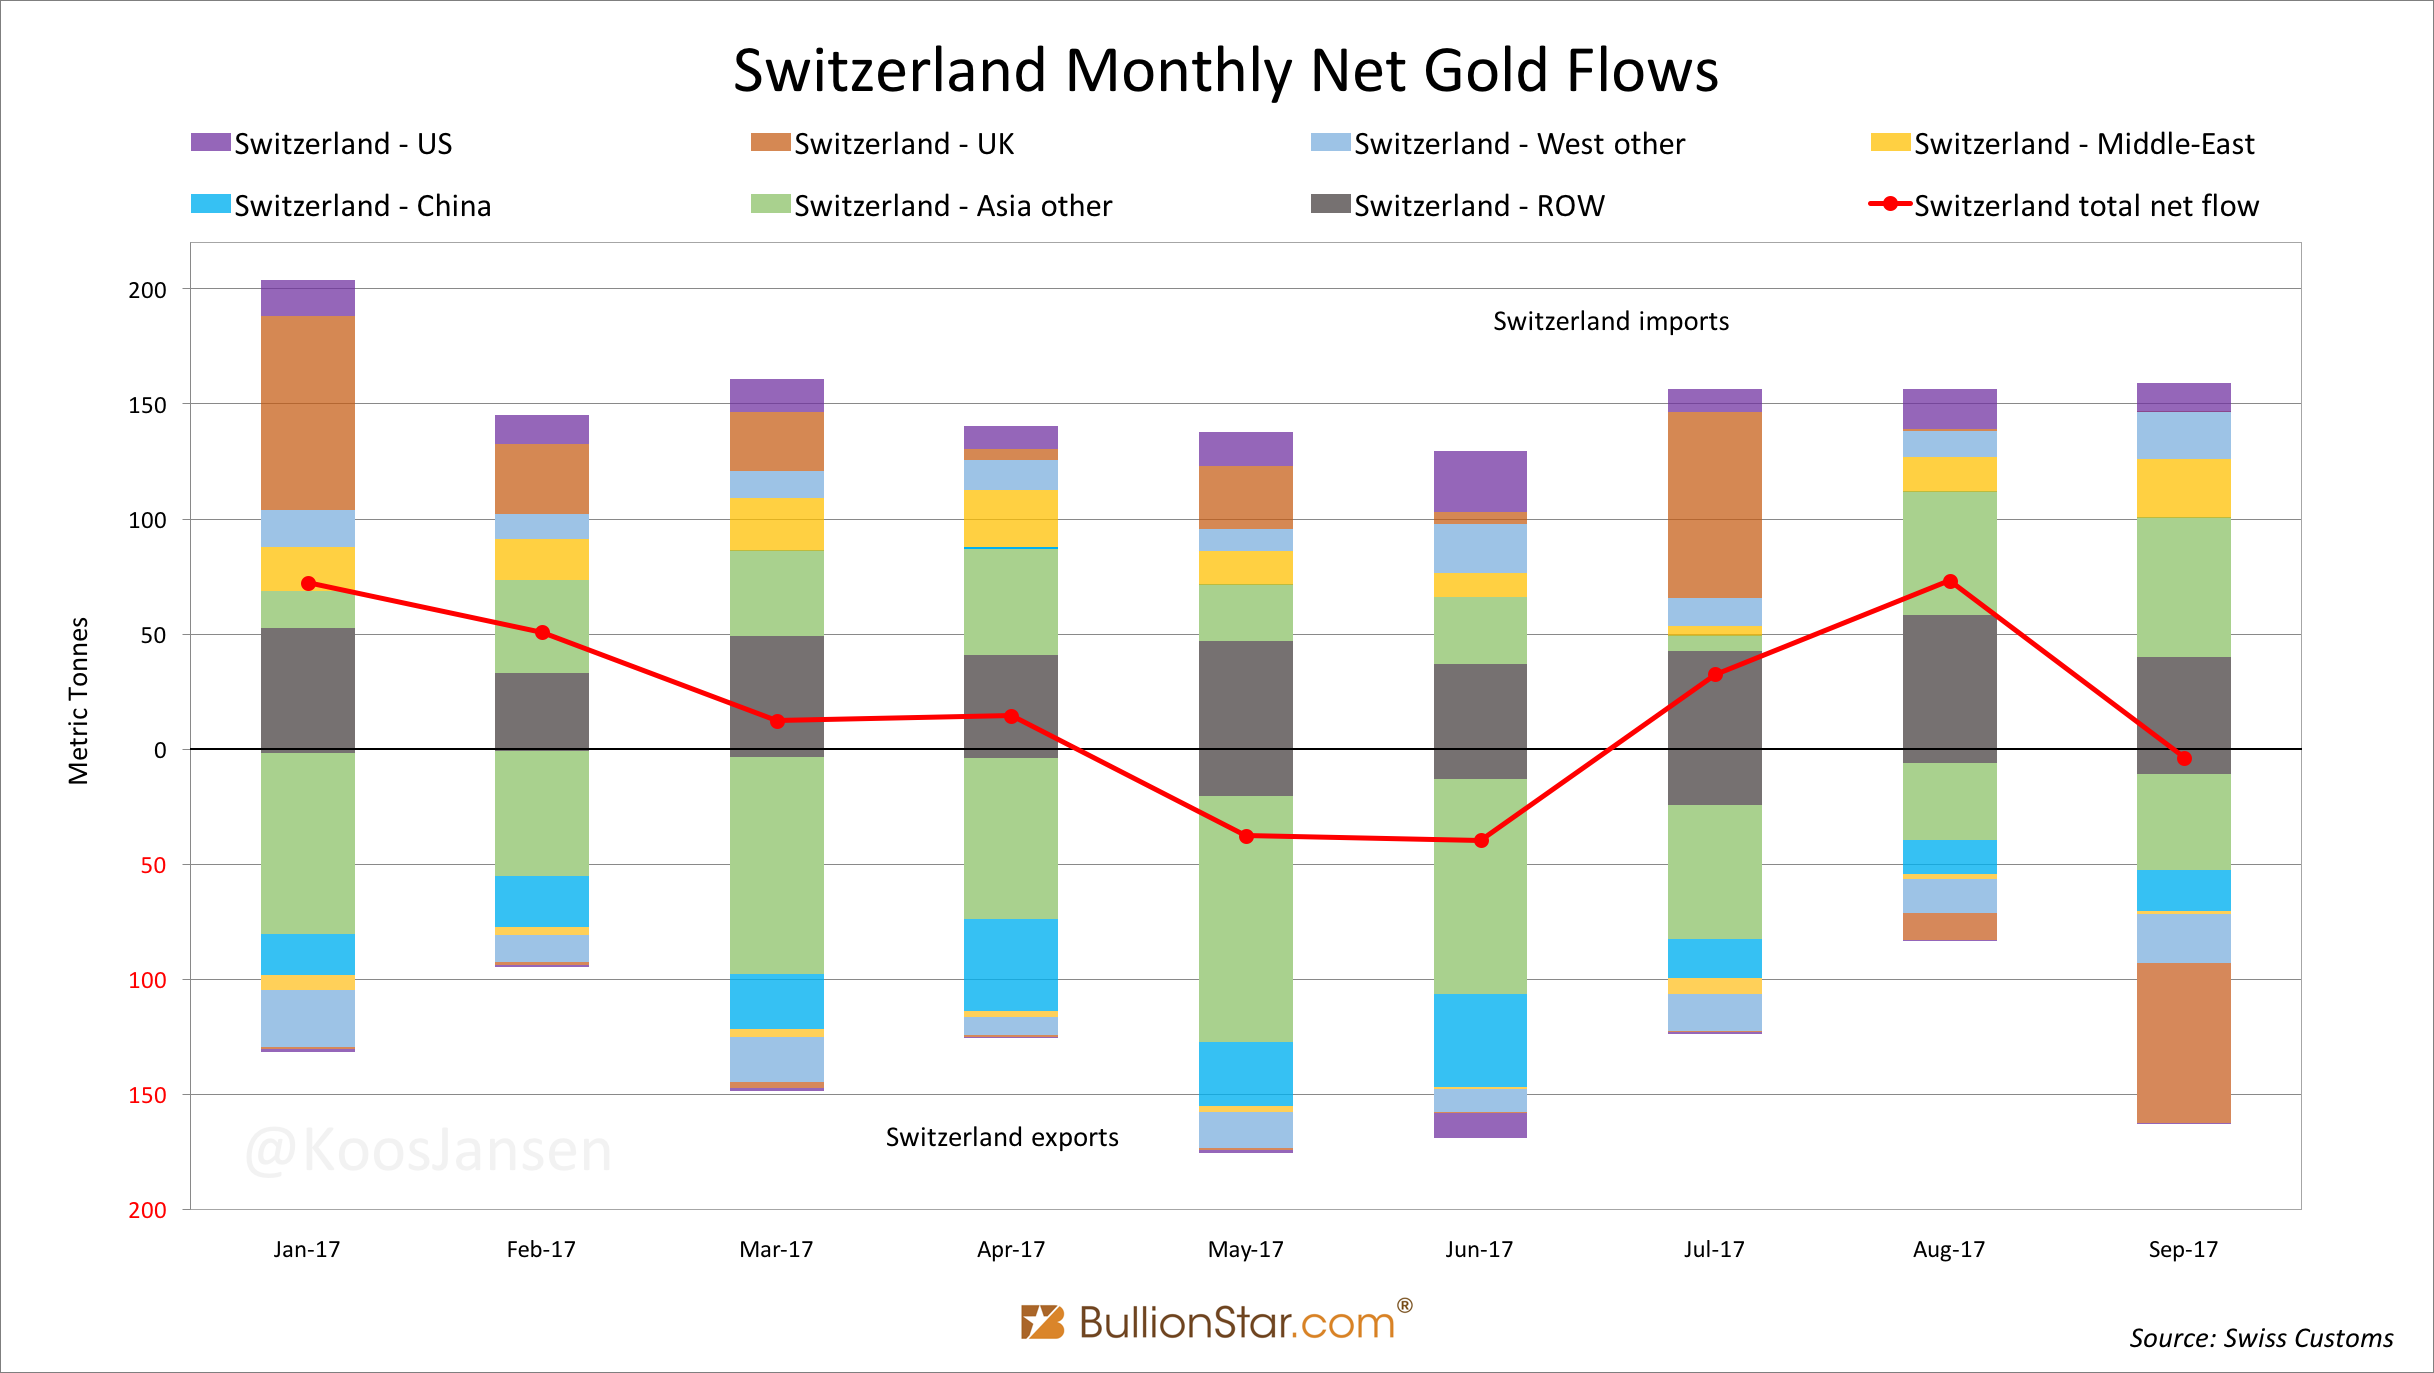
In the above chart we can see that Switzerland was a net exporter to China in all months, but in most months Switzerland in total was a net importer, displayed by the red line; for each of those months Switzerland itself was not the supplier to China.
Combined with data from Eurostat (on the UK’s total net flow) and USGS (on the US’ total net flow) the Swiss data tells me that gold moving from Switzerland to China had several sources this year. In January, for example, it was the UK that was supplying – being a net exporter in total and a large exporter to Switzerland. I must add that in theory little gold from the UK arrived in China via Switzerland, as the numbers don’t say which bar from whom was sent to who. But we can say “the UK made it possible China bought an X amount of gold in the open market at the prevailing price that month”. The same approach suggests that in June it was the US and Switzerland (Switzerland being a net exporter that month), and in September it was Asia (including the Middle-East) supplying gold to customers of Swiss refineries at the prevailing prices. There was not one source of above ground stock that exported to China (via Switzerland) as far as I can see.
The Hong Kong Census And Statistics Department (HKCSD) has recently published data indicating China absorbed 30 tonnes from the Special Administrative Region in September, down 8 percent relative to August and down 44 percent compared to September last year. A decline was expected because China has stimulated direct gold imports circumventing Hong Kong since 2014. Nevertheless, Hong Kong net exported 515 tonnes to the mainland through the first three quarters of 2017 (down 15 percent year on year).
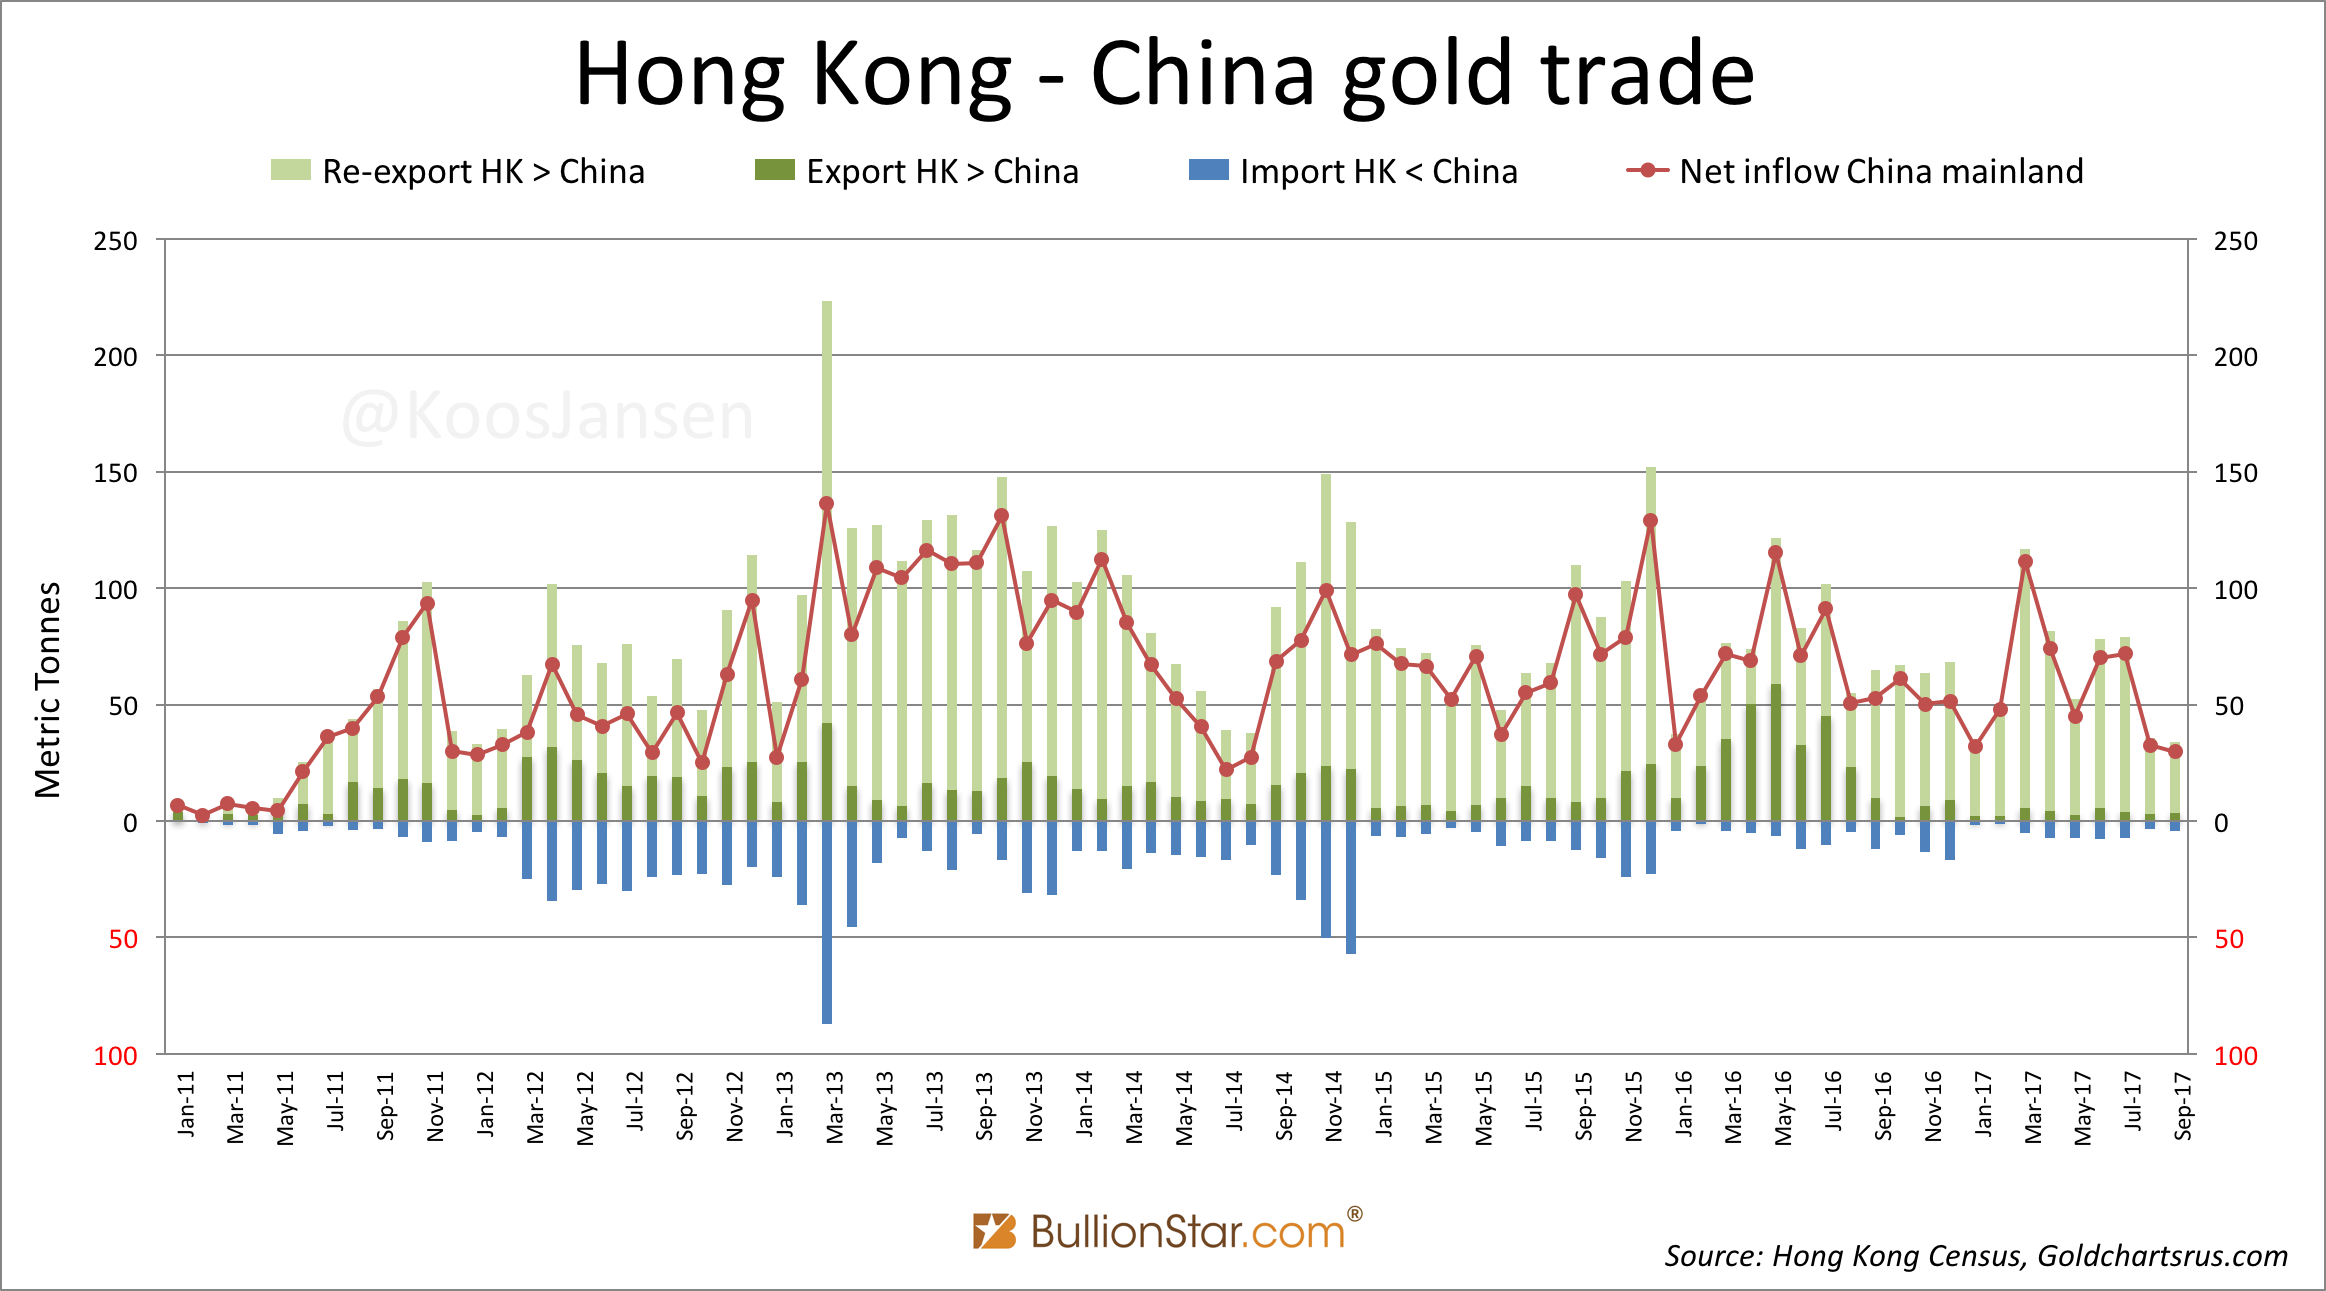
Hong Kong is a gold trading hub too, though. If Hong Kong is a net exporter to China, the actual source can be any country. Have a look at the next chart that shows the net flows through Hong Kong per region: the West, East and ROW (1). I’ve also added the net flow with China.
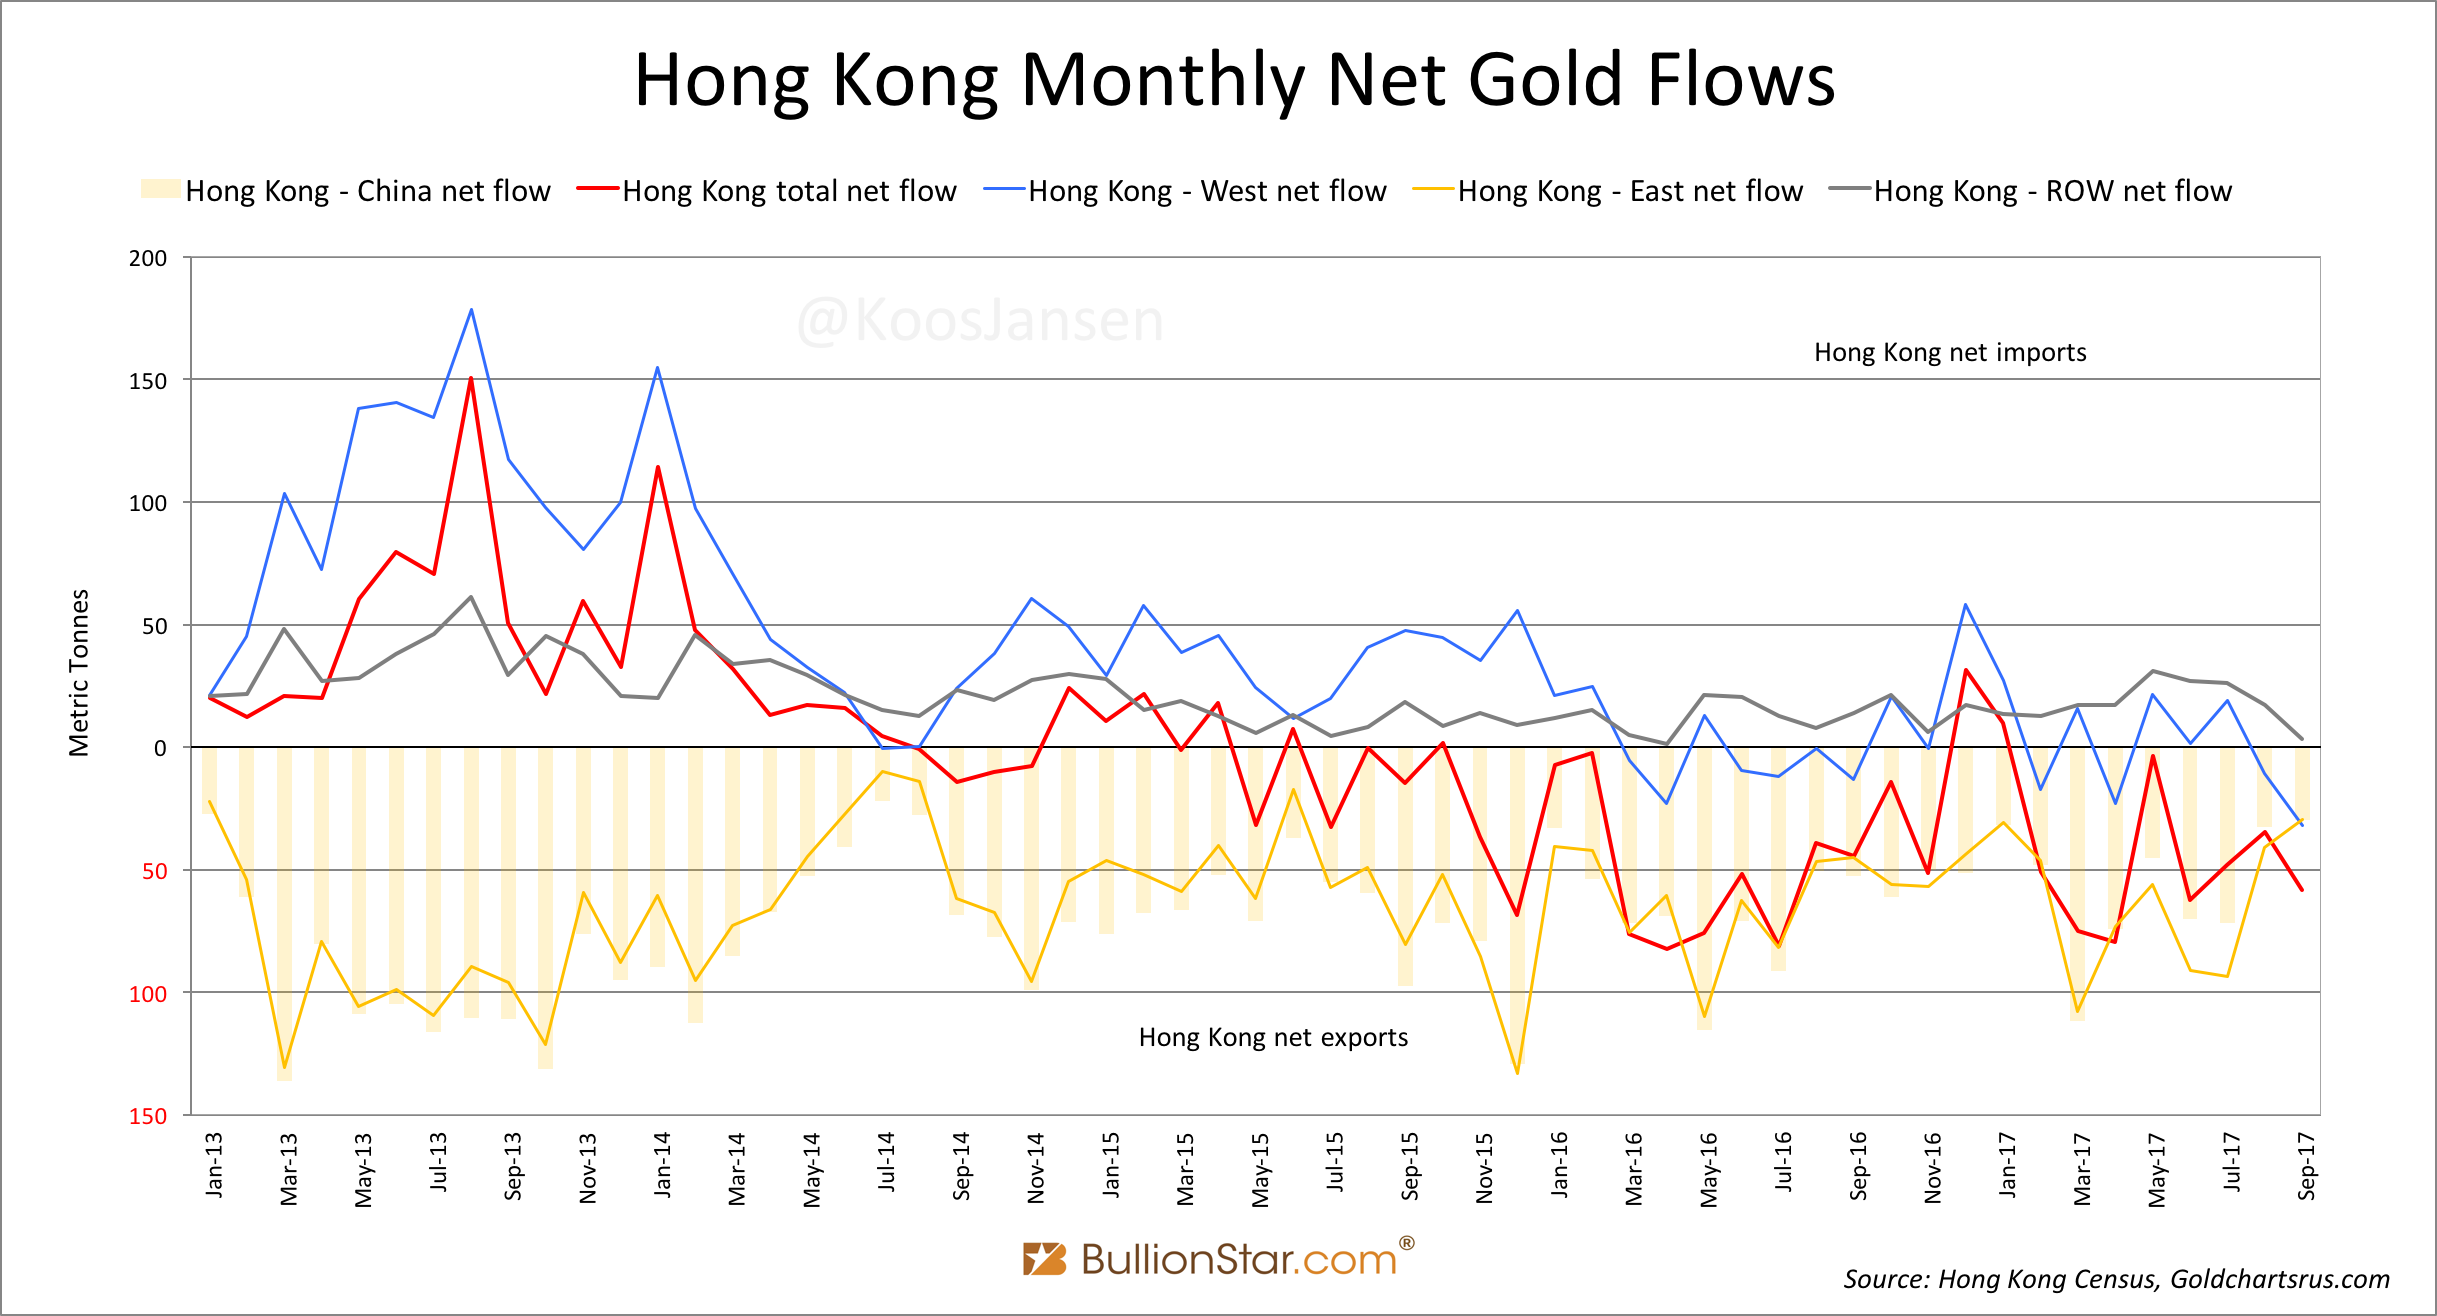
First observe the red line, “Hong Kong total net flow”. We can see that in 2013 Hong Kong became a massive net importer until about half way through 2015. The major suppliers to Hong Kong during this period were Switzerland and the UK, next to the ROW. I’m not aware of what type of entities were accumulating in Hong Kong at the time. The largest net importer from Hong Kong was China (included in the East).
After 2015 supply from the West (through Hong Kong) has slowly dried up while demand by China continued, shown by the blue line coming to zero and the yellow bars remaining to trend sub-zero. And thus Hong Kong commenced net exporting gold itself as we can see the red line in the chart falling far below zero. Apparently, since 2015 Hong Kong is a net exporter.
How much gold is left in Hong Kong? Unfortunately, online data from the HKCSD goes back only to 2002. The HKCSD does keep physical records from its international merchandise trade statistics from before 2002 but strangely “gold export” from 1972 until 1998 is omitted in these books (2).
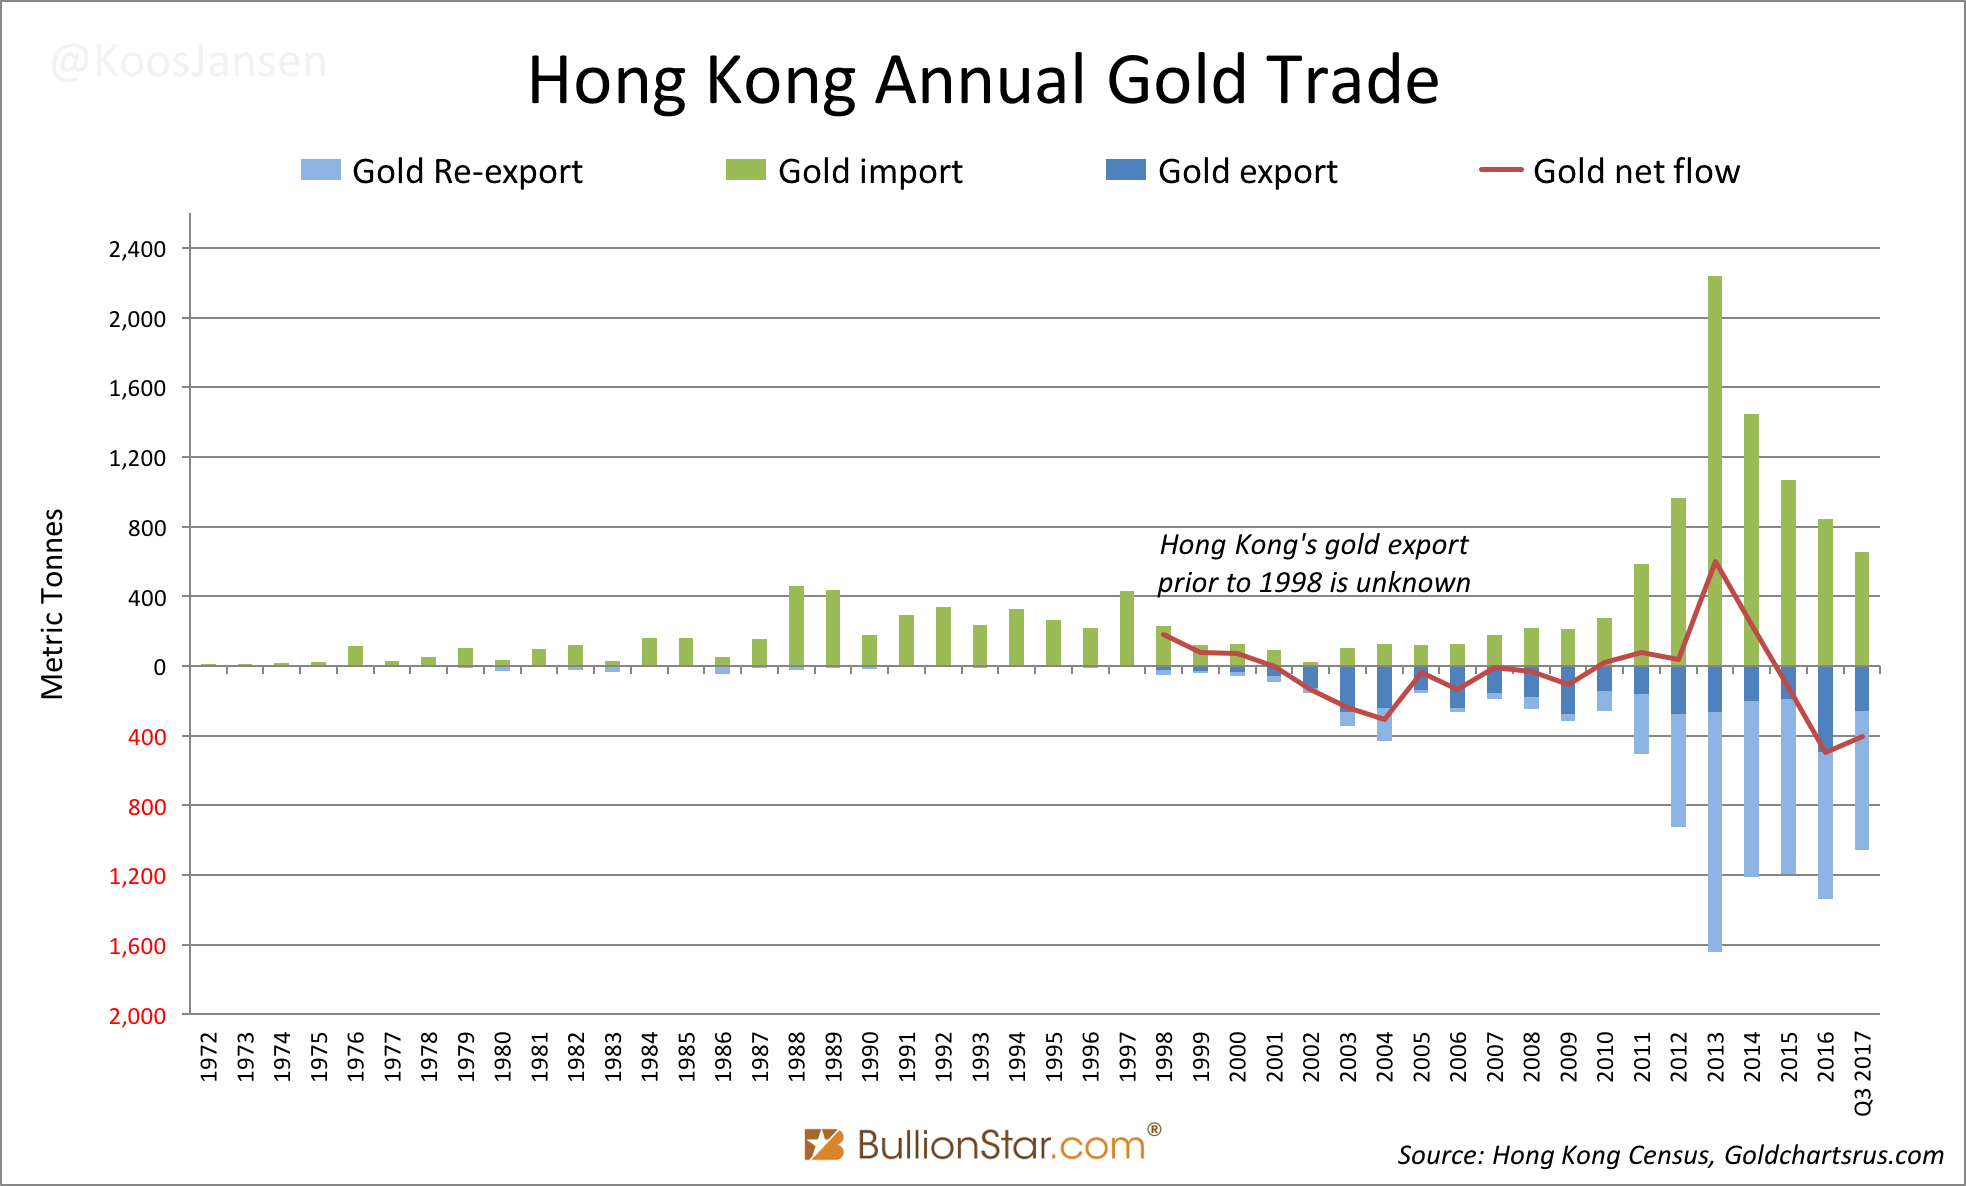
As you can see in this last chart Hong Kong has suffered net exports from 2002 until 2008 and after 2015. It’s possible there is still bullion in Hong Kong if it had been accumulated before 1998, but since 1998 Hong Kong already “net lost” 727 tonnes. Another possibility is that refineries in Hong Kong import a lot of scrap gold, which is nearly impossible to track in customs reports and is not included in any of my data, that is being refined into bullion and exported. In this case Hong Kong is not a net exporter, or less of a net exporter. We’ll see in coming months or years if Hong Kong can continue net exporting bullion.
In exhibit 4 we can see a vague correlation between “Hong Kong net export to the China” and “Hong Kong’s total net export” for 2016 and 2017. It looks like Hong Kong is feeding its big brother. Or is it?
There is a gold kilobar futures contract listed on the COMEX that is physically deliverable in Hong Kong. The trading volume of this contract is neglectable, and so is physical delivery, but remarkably the designated vault (Brinks) throughput is sky-high. When looking at a chart of kilobars received and withdrawn at the Brinks vault in Hong Kong, supplemented by cross-border gold trade, there is a pattern revealed: the amount of kilobars received and withdrawn, and Hong Kong’s gold total import and re-export to China are correlated.

The chart suggests that Hong Kong is mainly supplying China from its imports (and any gold supplying other countries than China was stored in Hong Kong in previous years or was sourced from scrap). As the imports are correlated to kilobars received in the Brinks vault and kilobars withdrawn are correlated to re-exports to China, both flows seem to be one and the same trade. I don’t know for sure, but I think this is largely true.
The next question is from what countries does Hong Kong import bullion to dispatch to China? From countries all over the world. Have a look.
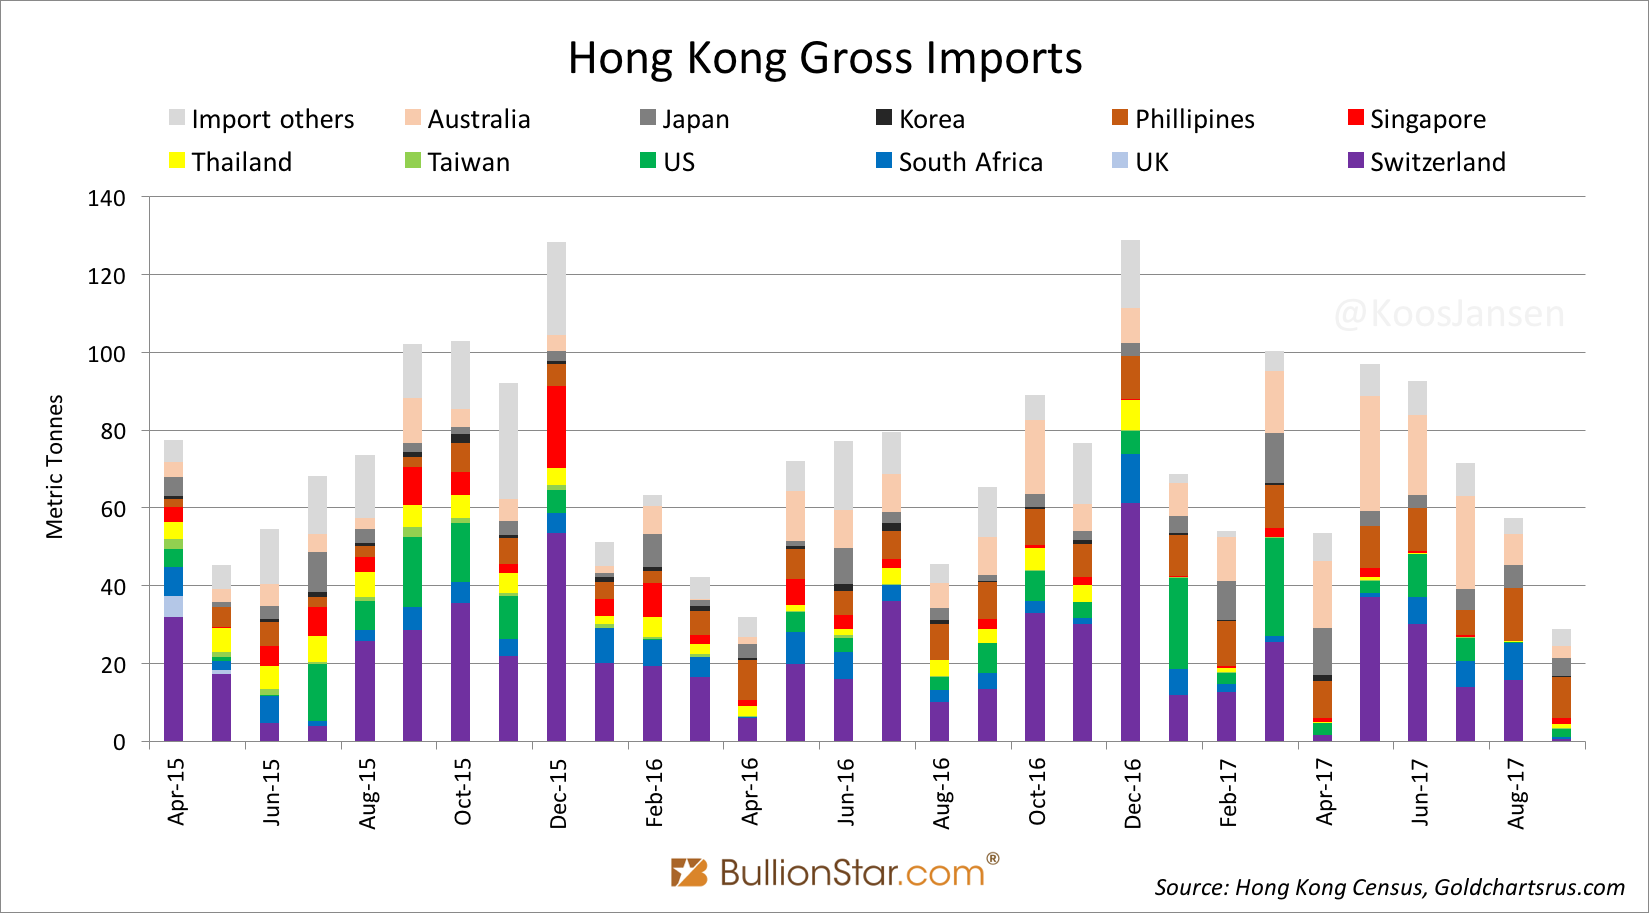
The composition is quite diverse. From the first until the the third quarter of this year gold came in from Switzerland, South-Africa, the US, Australia and the Philippines, inter alia.
Next to gold flowing through Switzerland and Hong Kong to China, countries that supplied gold directly to China this year have been Australia at 20 tonnes (3), the US at 14 tonnes, Japan at 3 tonnes and Canada at 4 tonnes. The UK has practically exported zero gold directly to China this year.
In total Hong Kong (515 tonnes), Switzerland (221 tonnes), Australia (20 tonnes), the US (14 tonnes), Japan (3 tonnes) and Canada (4 tonnes) net exported 777 tonnes to China mainland in the first three quarters of 2017 (4).
Conclusion
It must be mentioned that in theory gold import by China arrives in the Shanghai Free Trade Zone (which is not the domestic market) where the Shanghai International Gold Exchange (SGEI) operates. As most of you know the SGEI can serve foreign customers that can import gold traded on the SGEI, for example into India. Hence, it’s possible not all gold imported into China mainland arrives in the domestic market but ends up in the Shanghai Free Trade Zone or abroad. Global cross-border trade statistics by COMTRADE, however, show that barely any country is importing from China.
Until new evidence shows up my best guess is that China net imported 777 tonnes in the first nine months of 2017, sourced from all corners of the world: the UK, South-Africa, Australia, Switzerland, the US, Middle-East and Philippines. It seems Chinese banks are active all over the world looking to buy gold on the dips. Snapping up physical metal when the time is right.
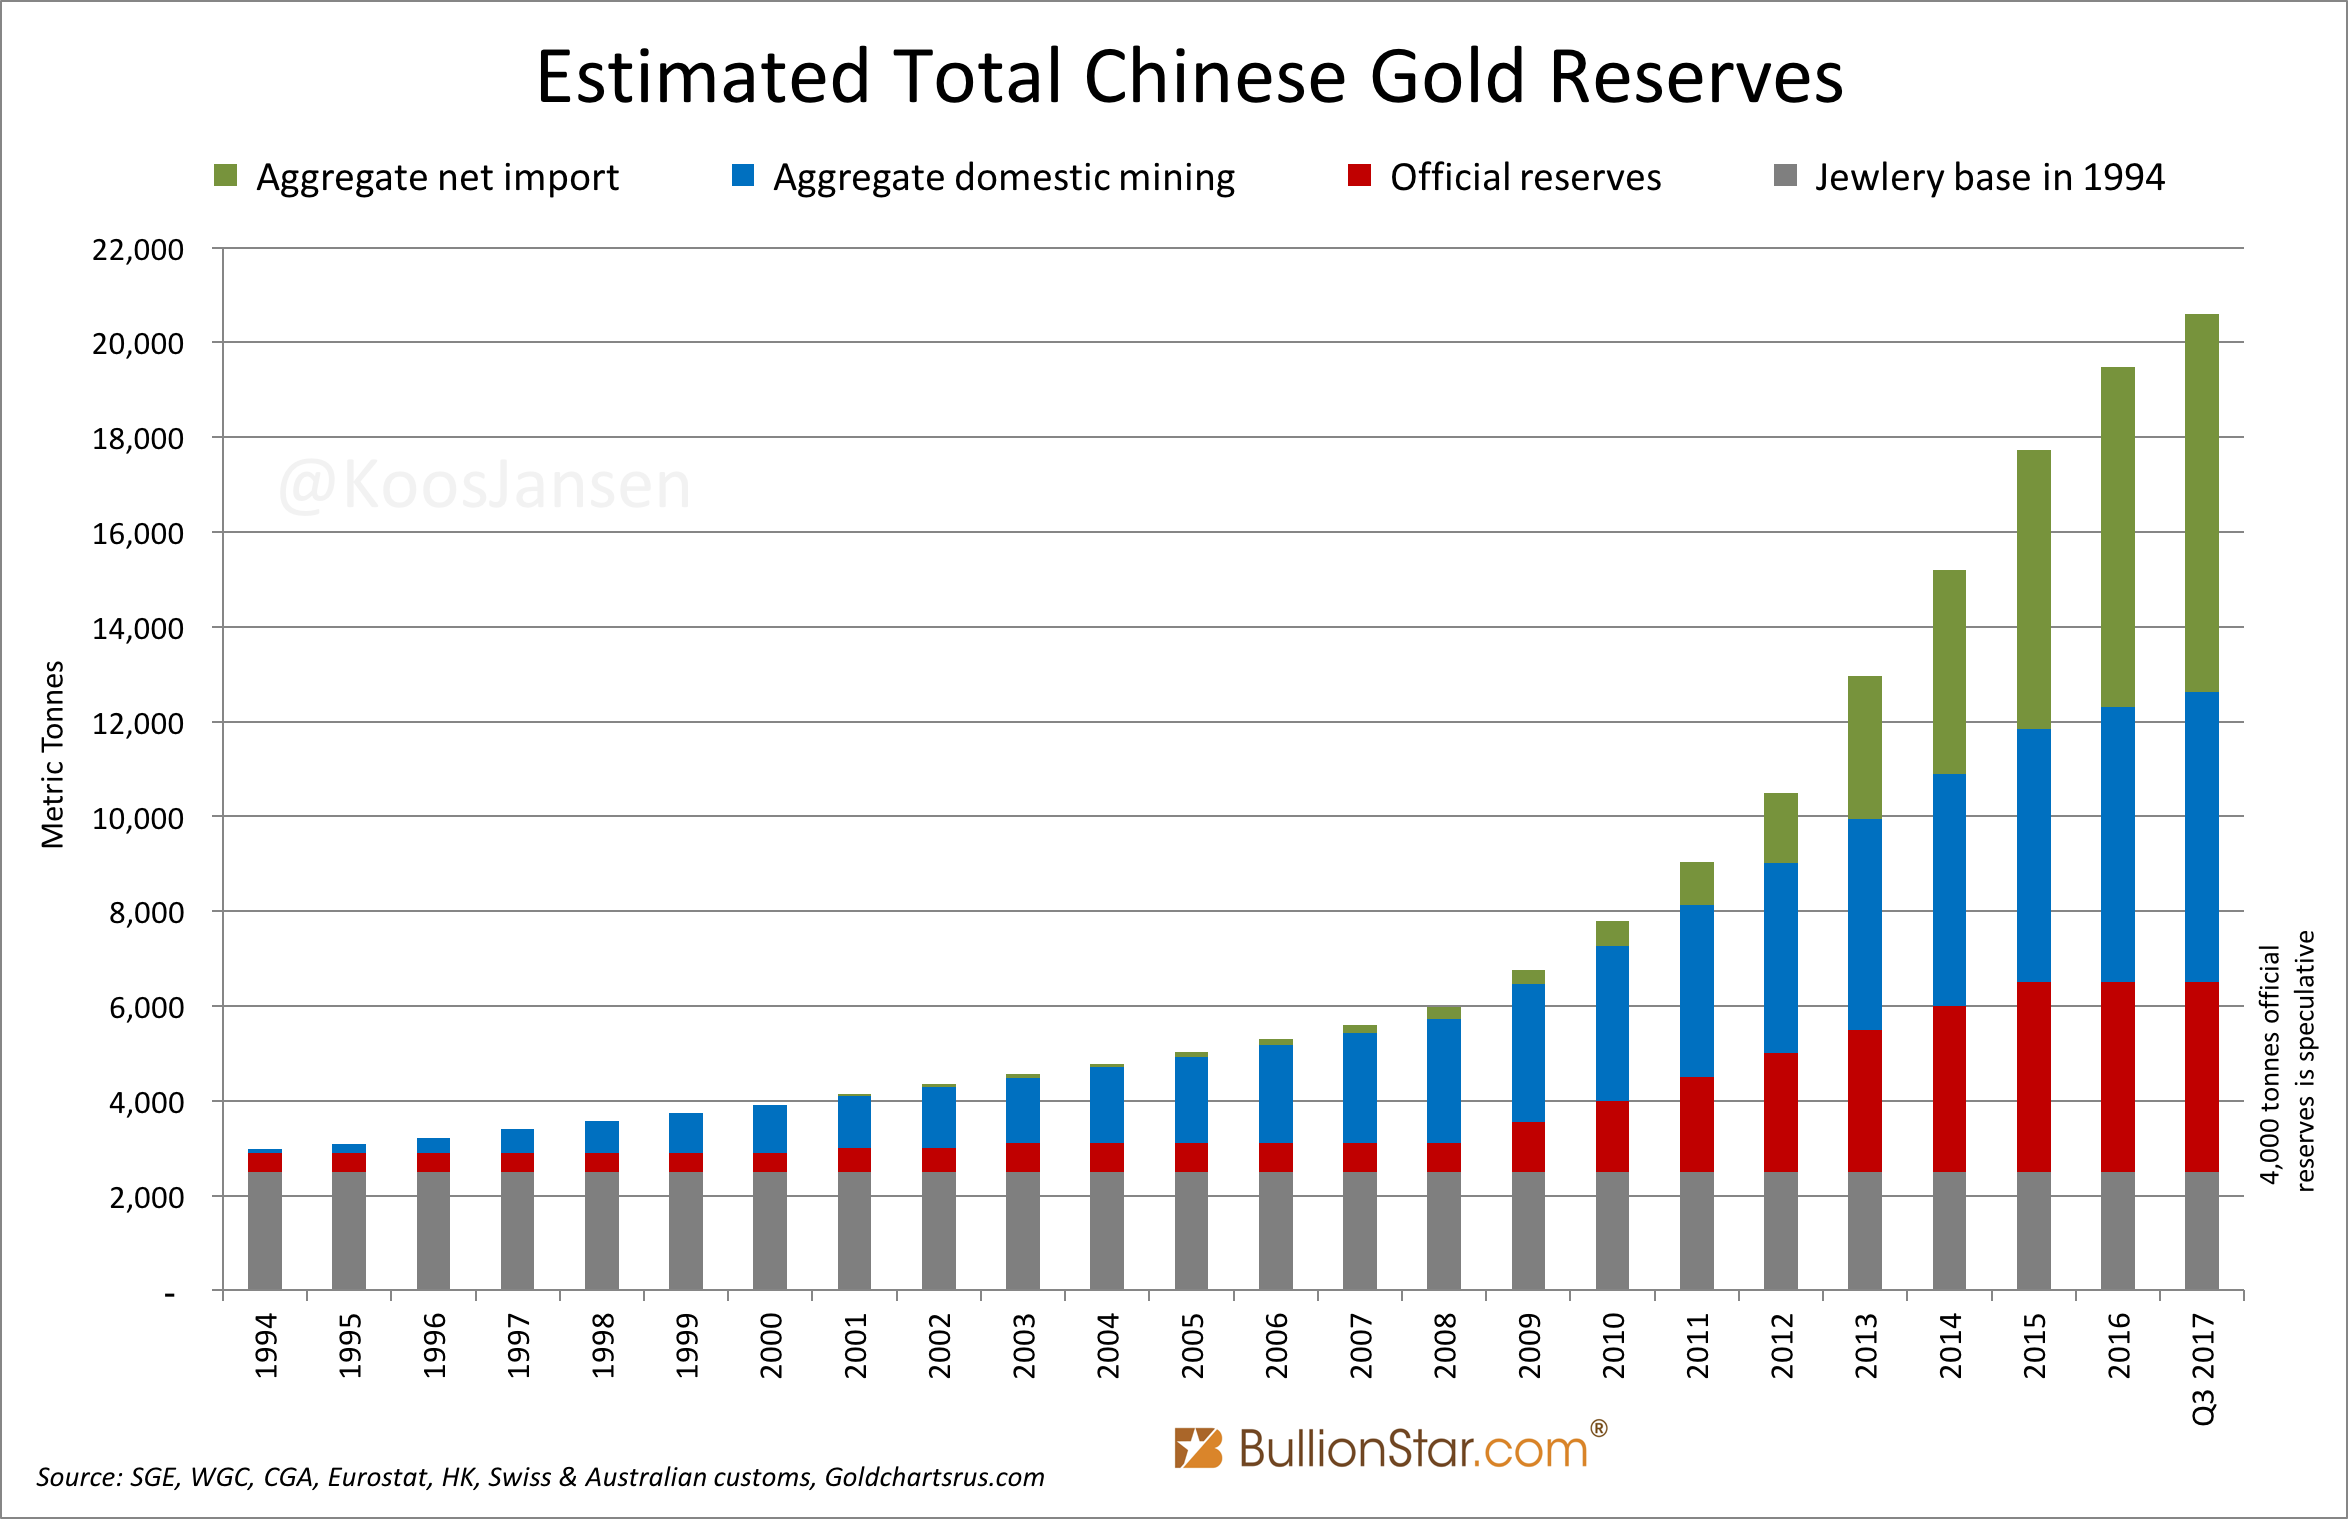
Chinese imports add to China’s domestic mining output. The China Gold Association disclosed on November 1 that mine production accounted for 313 tonnes, down 10 % compared to last year. Nearly all this gold (313 + 777) is sold through the SGE. Withdrawals from the vaults of the SGE accounted for 1,505 tonnes over this period, implying 415 tonnes (1,505 – 313 – 777) was supplied by scrap and disinvestment (or partially recycled through the SGE system).
Since all non-monetary gold imported and mine production ends up in the private sector, my estimate for total gold owned by the Chinese people now stands at 16,575 tonnes. Added by a more speculative estimate of 4,000 tonnes held by the PBOC makes 20,575 tonnes.
If you like to learn more about the Chinese gold market please read The Chinese Gold Market Essentials or visit the BullionStar University.
Footnotes
1) Hat tip to Nick Laird from Goldchartsrus.com for providing the HKCSD data from January 2002 until September 2017.
2) Huge hat tip to Winson Chik that went to the HKCSD office in Hong Kong for us to obtain the data from before 2002!
3) The Australian Bureau of Statistics (ABS) amended its gold export data to China and Hong Kong until August 2016. Before that I had my own way of computing direct gold export from Australia to China – which is now obsolete. A few days ago I got confirmed by ABS they stopped amending the data as China has allowed gold import bypassing Hong Kong. ABS data on gold export to China can now be taken at face value. On November 10, 2017, ABS wrote me:
Previously ABS amended exports of gold bullion going to Hong Kong to China as at the time the ABS had been provided with information to suggest that the majority of gold exports to Hong Kong ultimately ending up in China.
In 2016 a review of this methodology was undertaken, and it was determined that in recent years direct imports to the Chinese mainland have become increasingly common. by 2013-14, China eased restrictions on the direct importation of gold to ports outside of Hong Kong, and as a result users have abandoned using Hong Kong gold imports as an appropriate proxy measure for Chinese imports.The ABS implemented improvements to more accurately reflect the country of final destination of gold bullion, non-monetary (excl. unwrought forms and coins of HS 7118 and HS 9705) (AHECC 71081324) exported to Hong Kong and China in August 2016. The series were revised back to January 2012, inclusive. This impacted the country series only, as published in tables 14a and 36a-36j of International Trade in Goods and Services, Australia (cat. no. 5368.0) and detailed country statistics available on request. Total levels were not impacted, nor will there be any implications for other ABS collections. The ABS defines the country of final destination for exports as ‘the last country, as far as it is known at the time of exportation, to which goods are to be delivered’. The ABS conducted a review of the country of final destination of gold bullion into China and Hong Kong. There was evidence that Hong Kong had ceased serving primarily as an intermediate shipping country of gold into China and was importing and transforming gold bullion in its own right.
4) Data from Australia and the US for September hasn’t been released yet, so the numbers disclosed are provisional.
Popular Blog Posts by Koos Jansen
 China’s Secret Gold Supplier is Singapore
 Audits of U.S. Monetary Gold Severely Lack Credibility
 China Gold Import Jan-Sep 797t. Who’s Supplying?
 The Gold-Backed-Oil-Yuan Futures Contract Myth
 Estimated Chinese Gold Reserves Surpass 20,000t
 PBOC Gold Purchases: Separating Facts from Speculation
 U.S. Mint Releases New Fort Knox Audit Documentation
 China Net Imported 1,300t of Gold in 2016
 Why SGE Withdrawals Equal Chinese Gold Demand and Why Not