
How The West Has Been Selling Gold Into A Black Hole

 Koos Jansen
Kindly be advised to have read my posts The Mechanics Of The Chinese Domestic Gold Market and The Great Physical Gold Supply & Demand Illusion before continuing.
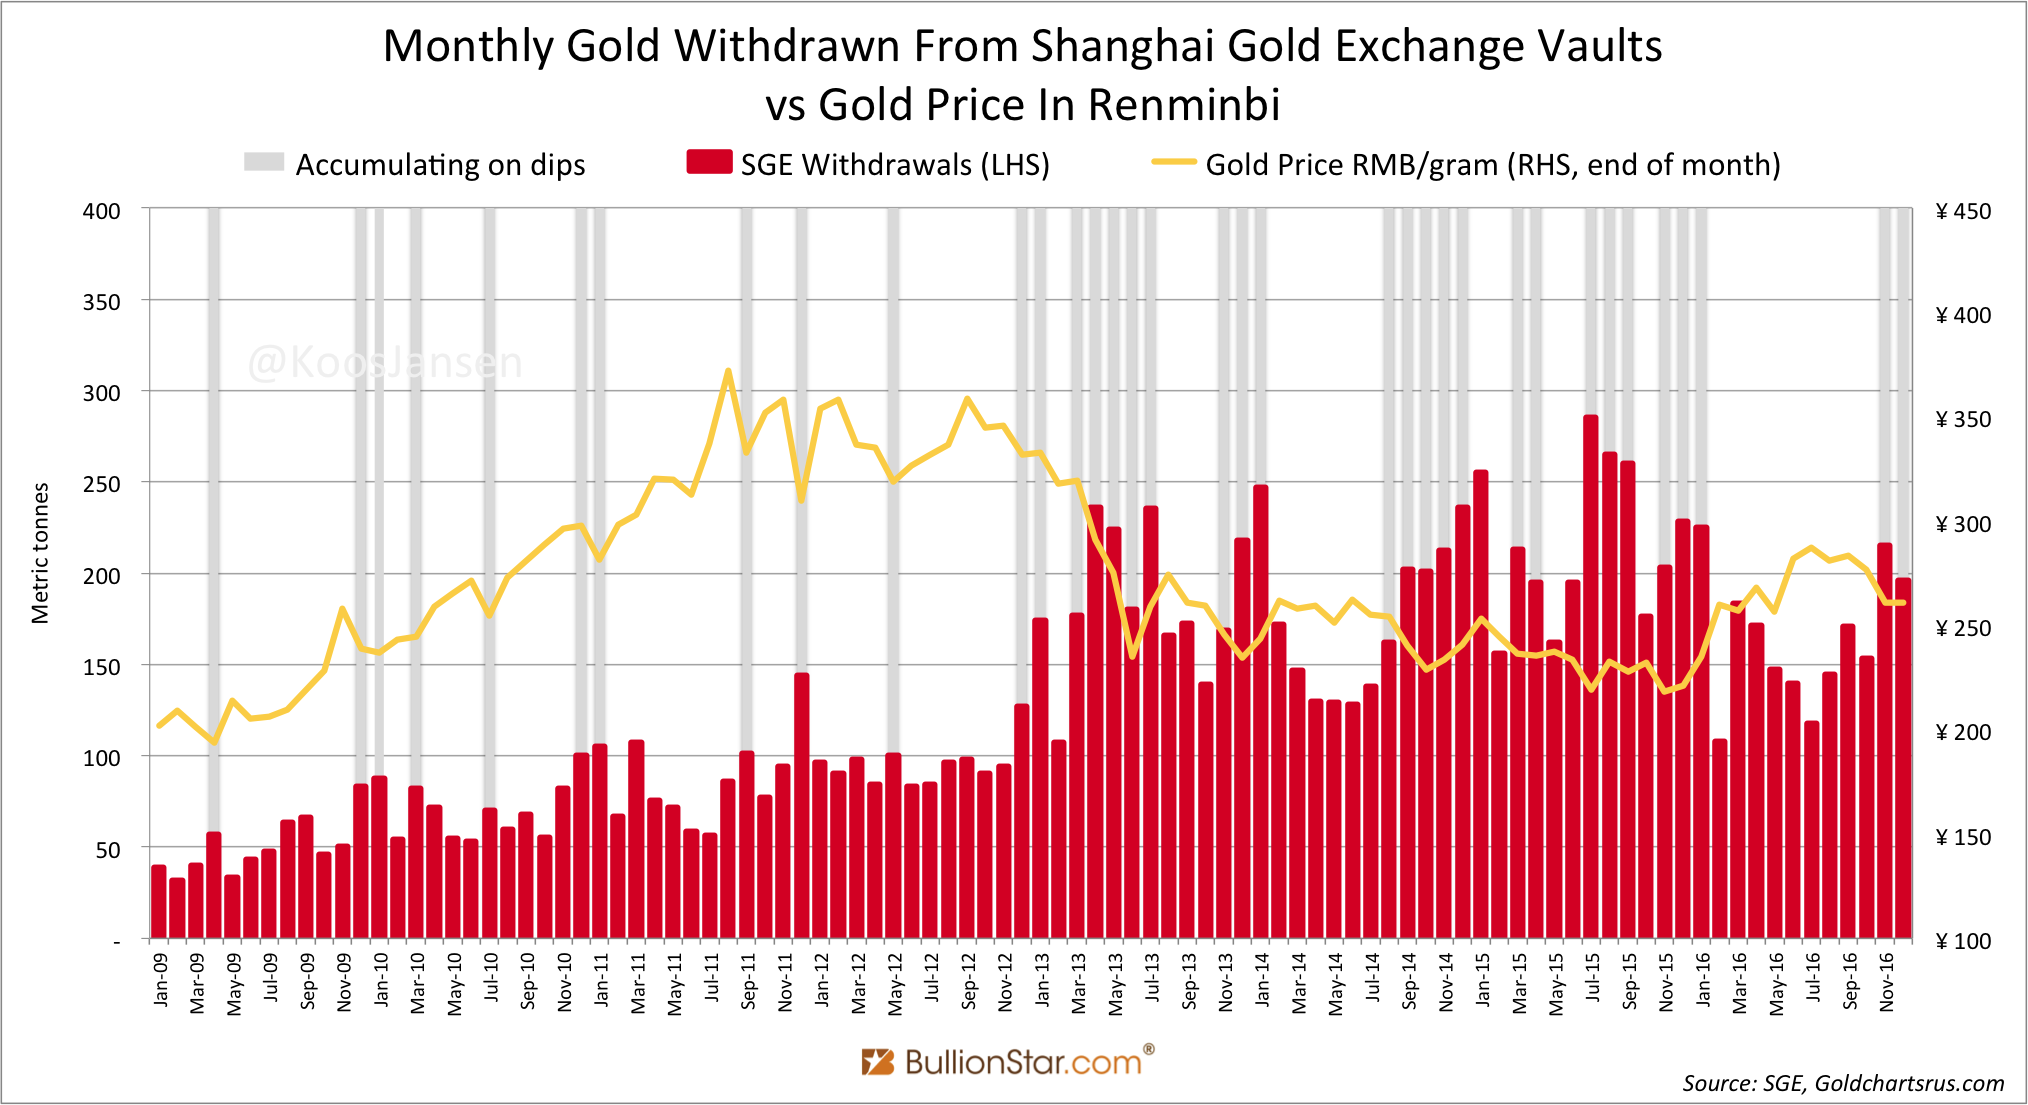
In December 2016 Chinese wholesale gold demand, measured by withdrawals from the vaults of the Shanghai Gold Exchange (SGE), accounted for 196 tonnes, down 9 % from November. December was still a strong month for SGE withdrawals due to the fact the gold price trended lower before briefly spiking at the end of the month, and the Chinese prefer to buy gold when the price declines (see exhibit 1).
In total Chinese wholesale gold demand reached an astonishing 1,970 tonnes in 2016. But will these huge tonnages bought by China ever have an impact on the gold price? I think it will.
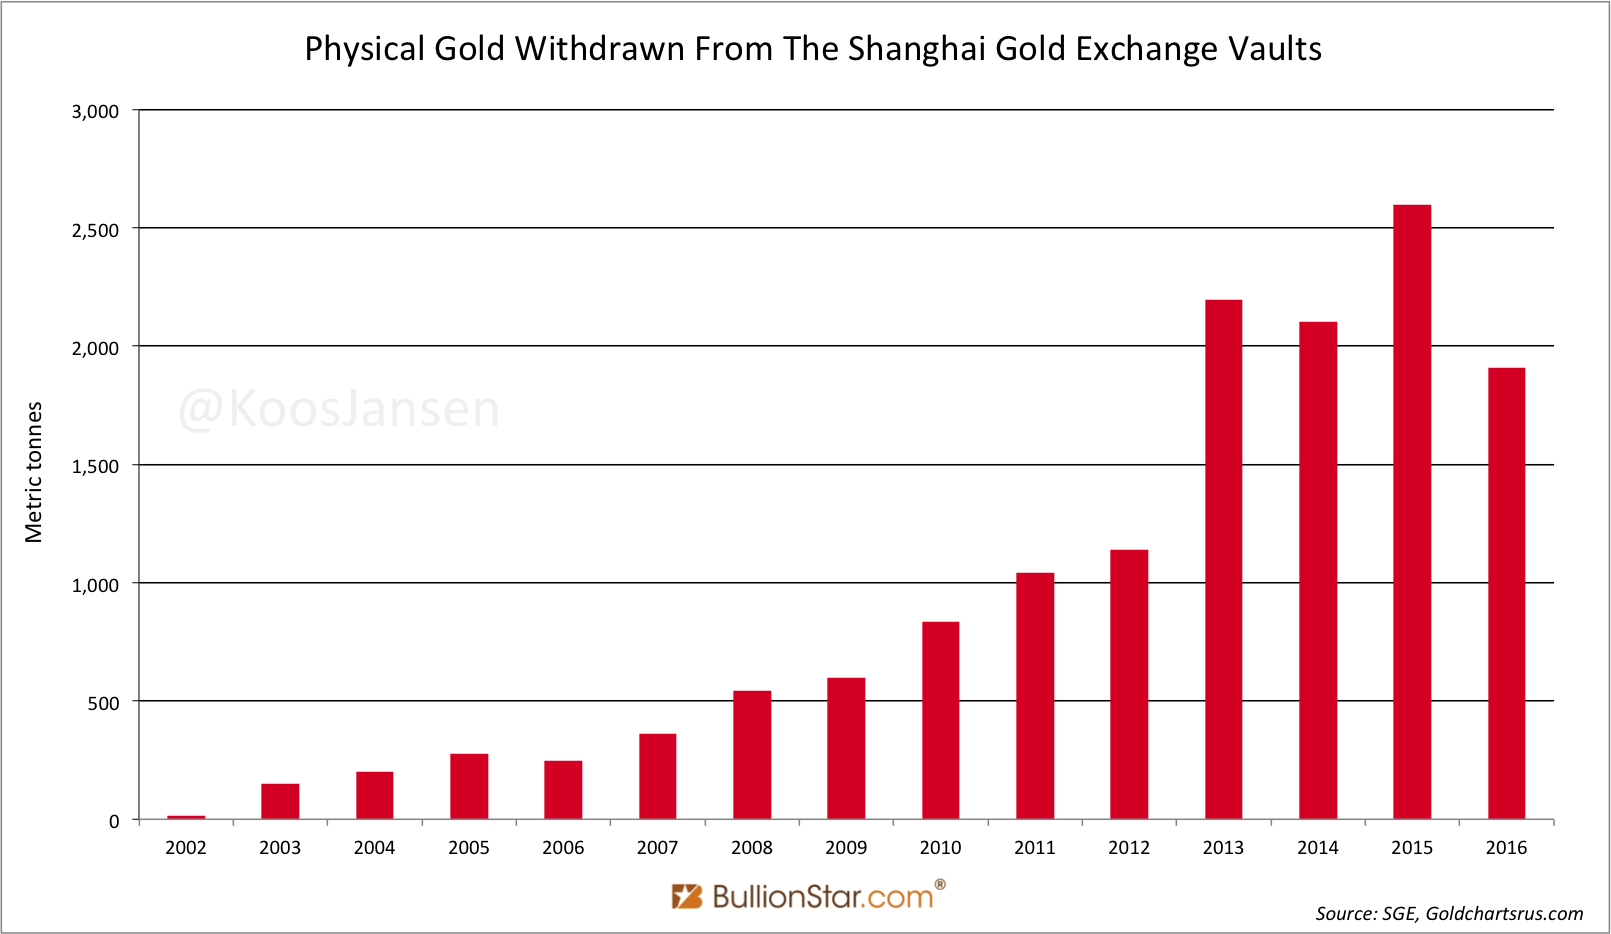
As in previous years, SGE withdrawals were mostly supplied through imports, in 2016 at approximately 1,300 tonnes. And as in previous years, SGE withdrawals were roughly twice the size of Chinese consumer gold demand. The latter is published by all “leading” consultancy firms, such as the World Gold Council and Thomson Reuters GFMS. Because these firms have systematically underreported and eclipsed Chinese gold demand since 2007, a significant share of the financial industry is unaware China has imported 5,000 tonnes in the past years, which is not allowed to be exported. My hypothesis is that this 5,000 tonnes decline in above ground gold reserves outside of the Chinese domestic market will make gold rally stronger in a future bull market than it did in previous bull markets. To the extent many investors are uninformed about the shrinking volume of troy ounces available outside of China, their ignorance will boost any price rally coming.
In this post I would like to share my thoughts on how the gold price is correlated to trade in above ground reserves, and how China has slashed these reserves to the tune of 5,000 tonnes, which will significantly impact the next leg up in gold.
Correlated: The Gold Price And UK Gold Trade
Since many decades large investors in the West set the price of gold. Ever since, the heart of the Western gold wholesale market has been London in the United Kingdom. There is thus a correlation between the gold price and the volume of gold net imported or exported by the UK.
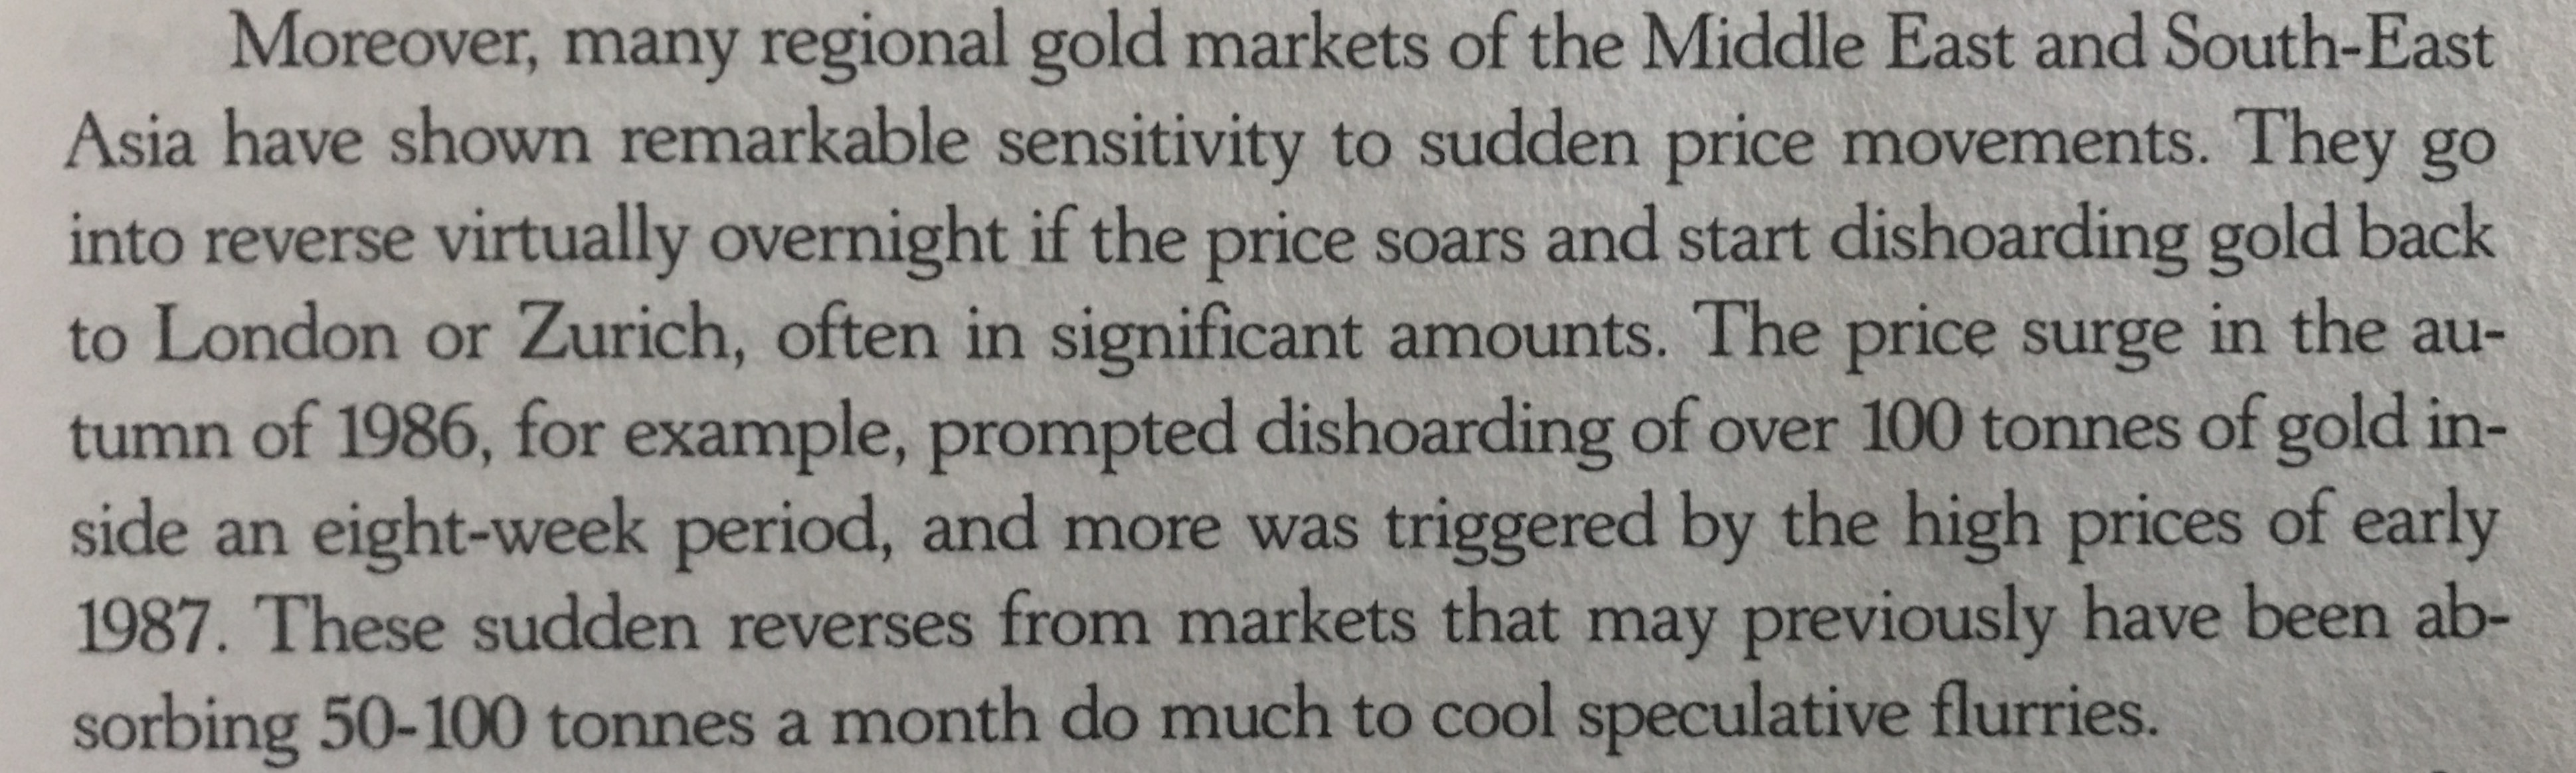
In Asia, on the other hand, gold market participants are more price sensitive, implying they buy low and sell high (the opposite of Western investors). I’ve described this trend frequently on these pages, but the same can be read in books by gold author Timothy Green. In The Prospect For Gold from 1987 Green states:
Before we discuss the connection between Western supply and demand trends to developments in the Chinese gold market of the past decade, let me first recapitulate that global physical gold supply and demand is far in excess of the statistics the World Gold Council and GFMS publish. Below is a chart that shows the quarterly averages of all physical supply and demand categories as disclosed by the World Gold Council from Q1 2002 until Q4 2015. These numbers are more or less the same as figures by GFMS.

We can see that over the course of 13 years, the majority of supply consisted of mine output (73%) and the majority of demand consisted of jewelry consumption (64%).
(Note, the categories official sector, net producer hedging and ETFs can be either supply or demand and volumes can greatly vary per quarter. Though, only in 1 of 52 quarters examined has ETF demand been greater than jewelry consumption (Q1 2009). In all other quarters official sector, net producer hedging and ETFs supply or demand has not been greater than mine output or jewelry consumption.)
If the data by the World Gold Council regarding physical gold supply and demand would be exhaustive, mine output and jewelry consumption should have a positive correlation to each other and the price of gold. But they don’t. Have a look at the next chart.
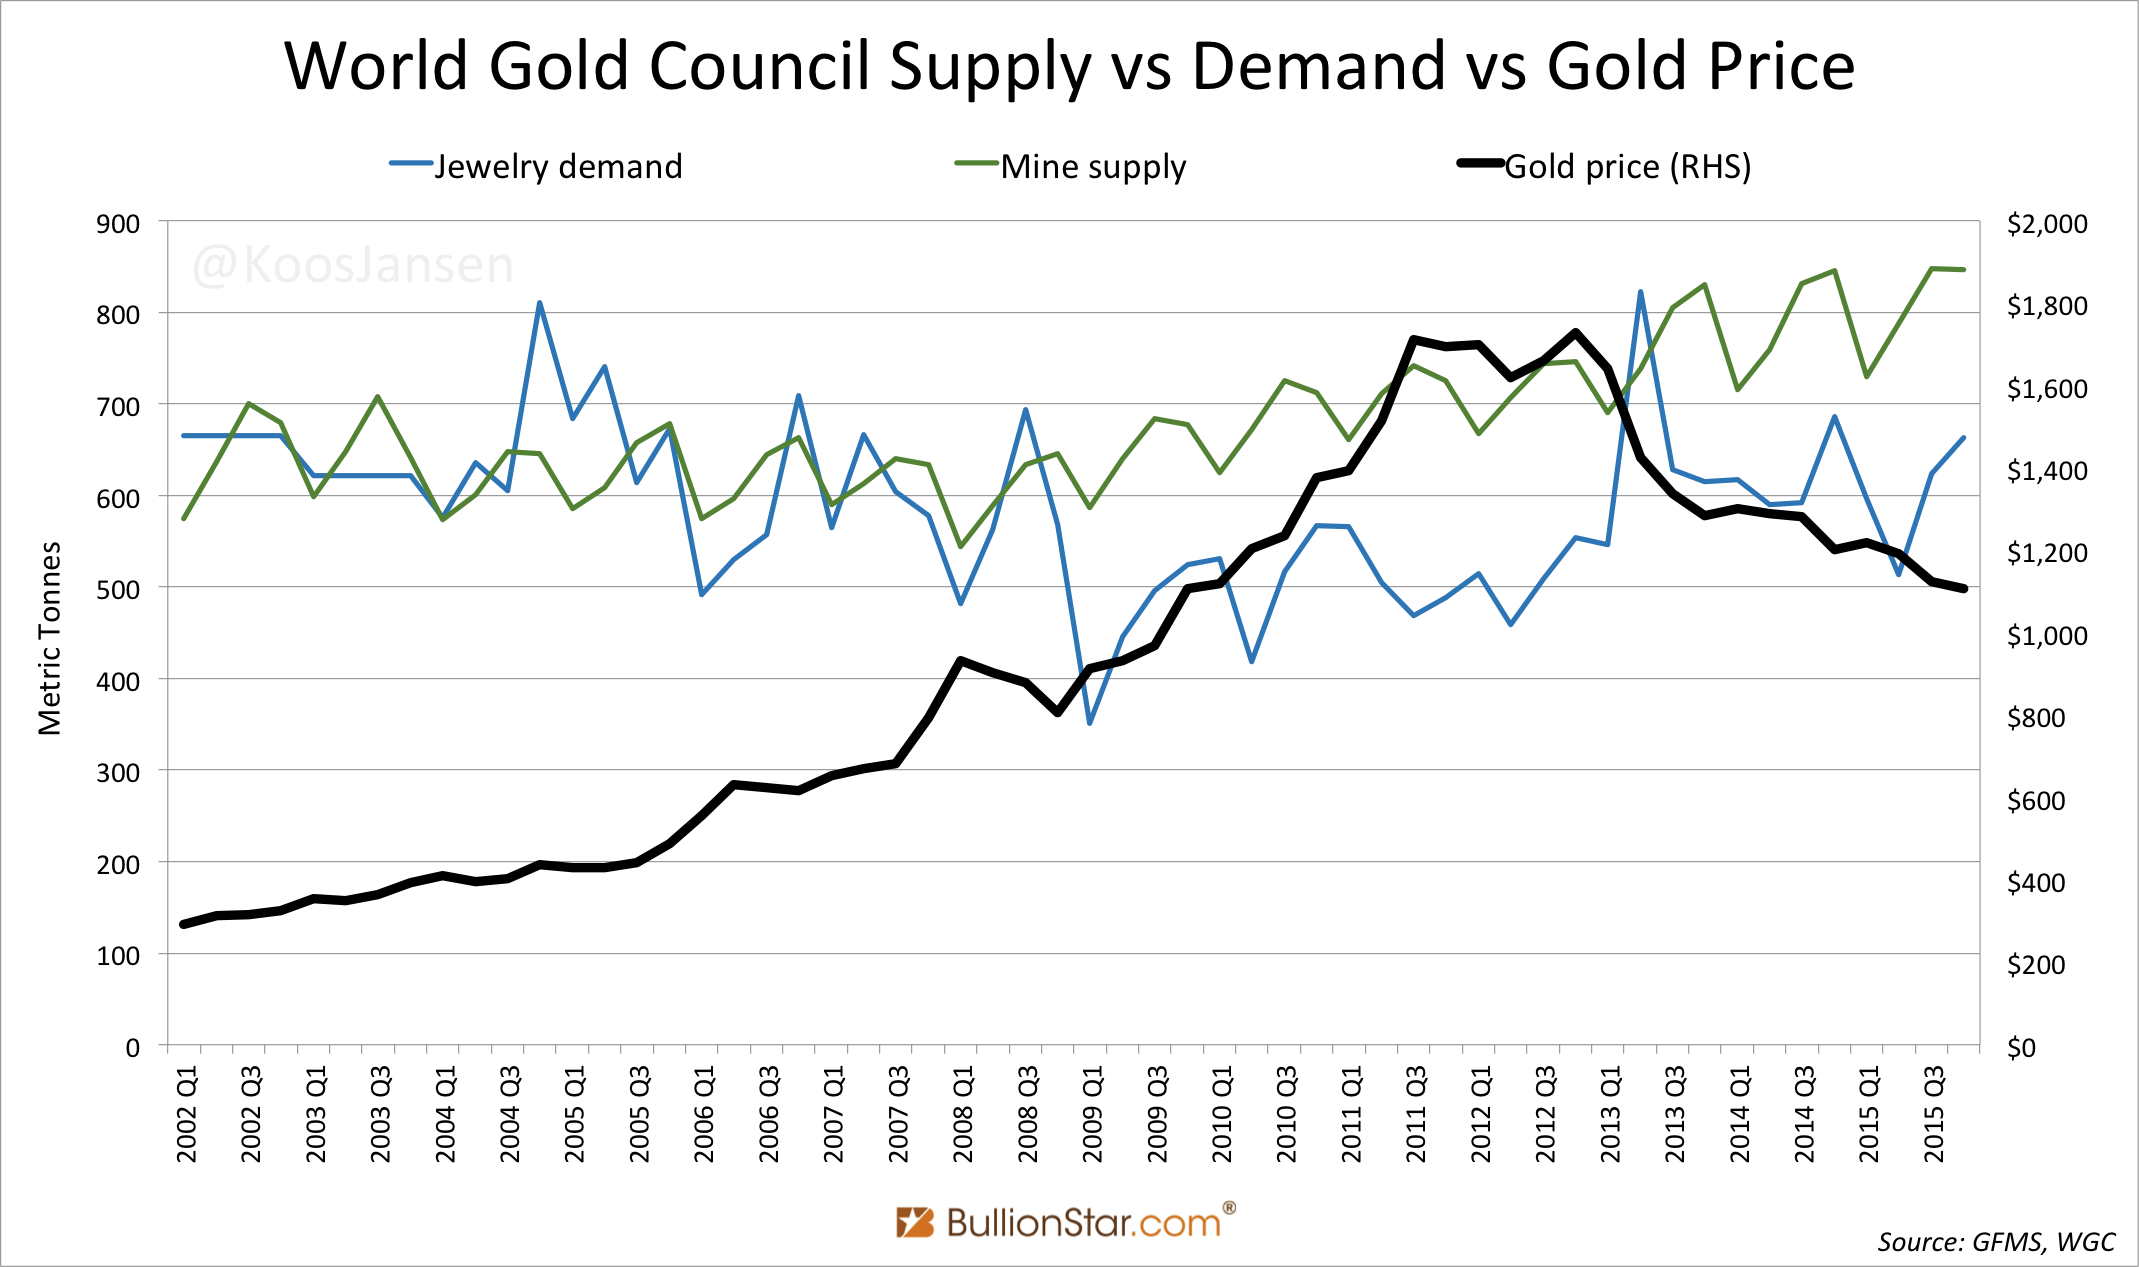
During the bull market from 2002 until 2011 jewelry consumption decreased and it hardly ever transcended mine output. In turn, mine output gradually ascended over this time horizon while the gold price increased six fold! Are the forces between jewelry demand and mine supply driving the medium/long term price of gold? No, clearly not. This shows the data by the World Gold Council is incomplete.
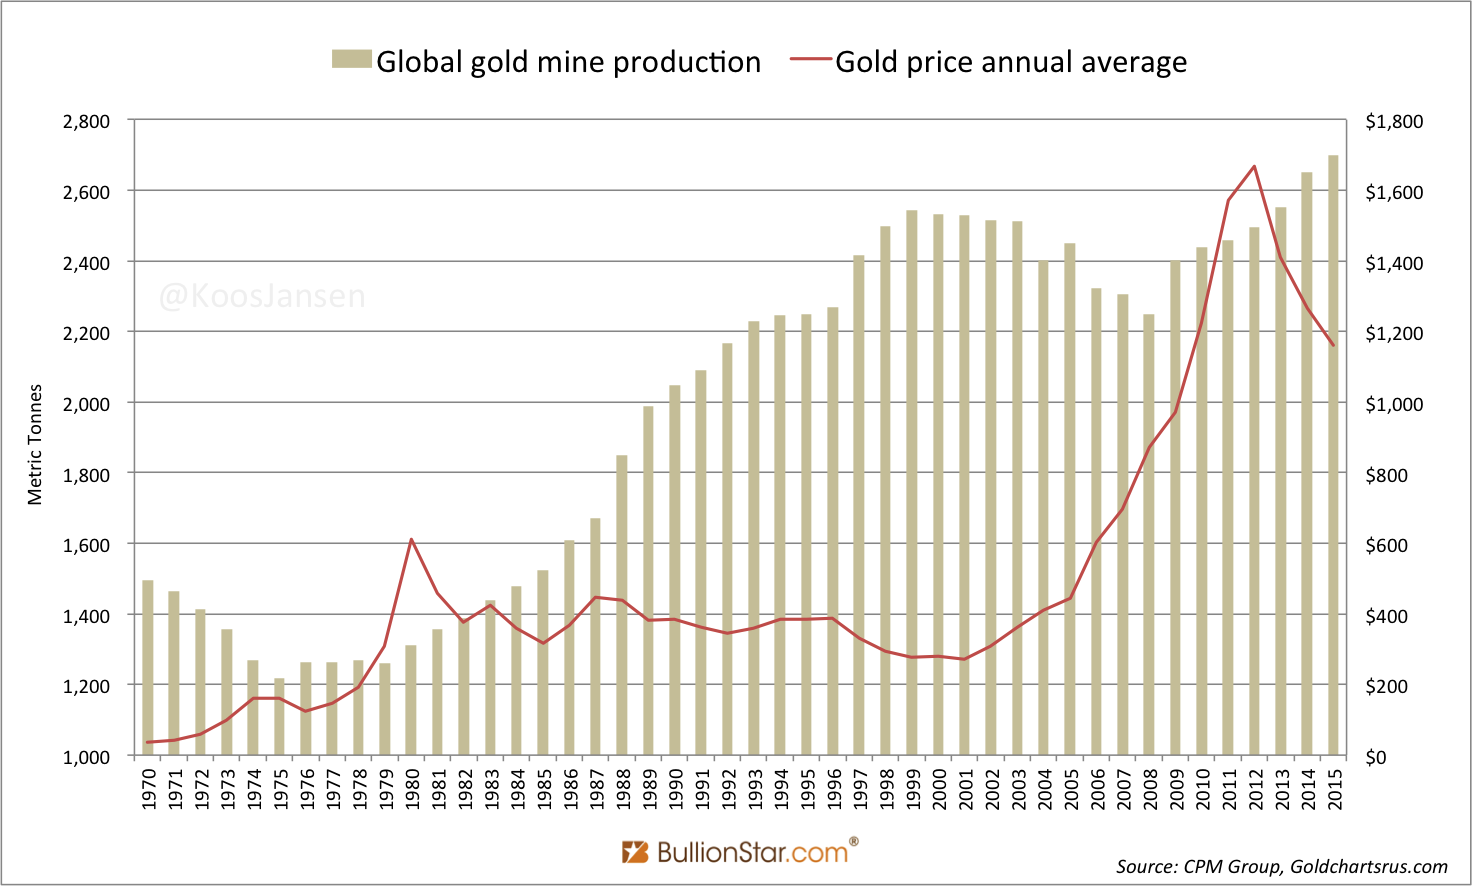
(I should add that mine output does have a correlation to the gold price in the very long term as it can take more than ten years to setup a gold mining project. See the next chart.)
In contrast to the data by the World Gold Council, we can observe a strong correlation between the medium/long term gold price and institutional supply and demand flowing through London. View the chart below.
Strangely, institutional supply and demand are categories not included in the World Gold Council’s data – or in any other precious metals consultancy firm’s data that I’m aware of.
Because in the UK there are no refineries, no gold mines and local consumption demand and scrap supply is immaterial, all gold that is visibly (non-monetary) imported and exported must either relate to ETF holdings stored in London, or Western institutional supply and demand. When we compute the ratio between both, ETF flows compound to roughly 35 % of the UK’s net flow (import minus export) and as a consequence approximately 65 % is Western institutional supply and demand. Effectively the majority of the UK’s net flow is Western institutional supply and demand.
Hereby, consider that all supply and demand categories disclosed by the World Gold Council more or less equal each other (exhibit 4), so for the sake of simplicity we‘ll state that total mine output + scrap supply versus jewelry consumption + bar and coin + industrial demand meets outside the UK and doesn’t set the medium/long term price of gold.
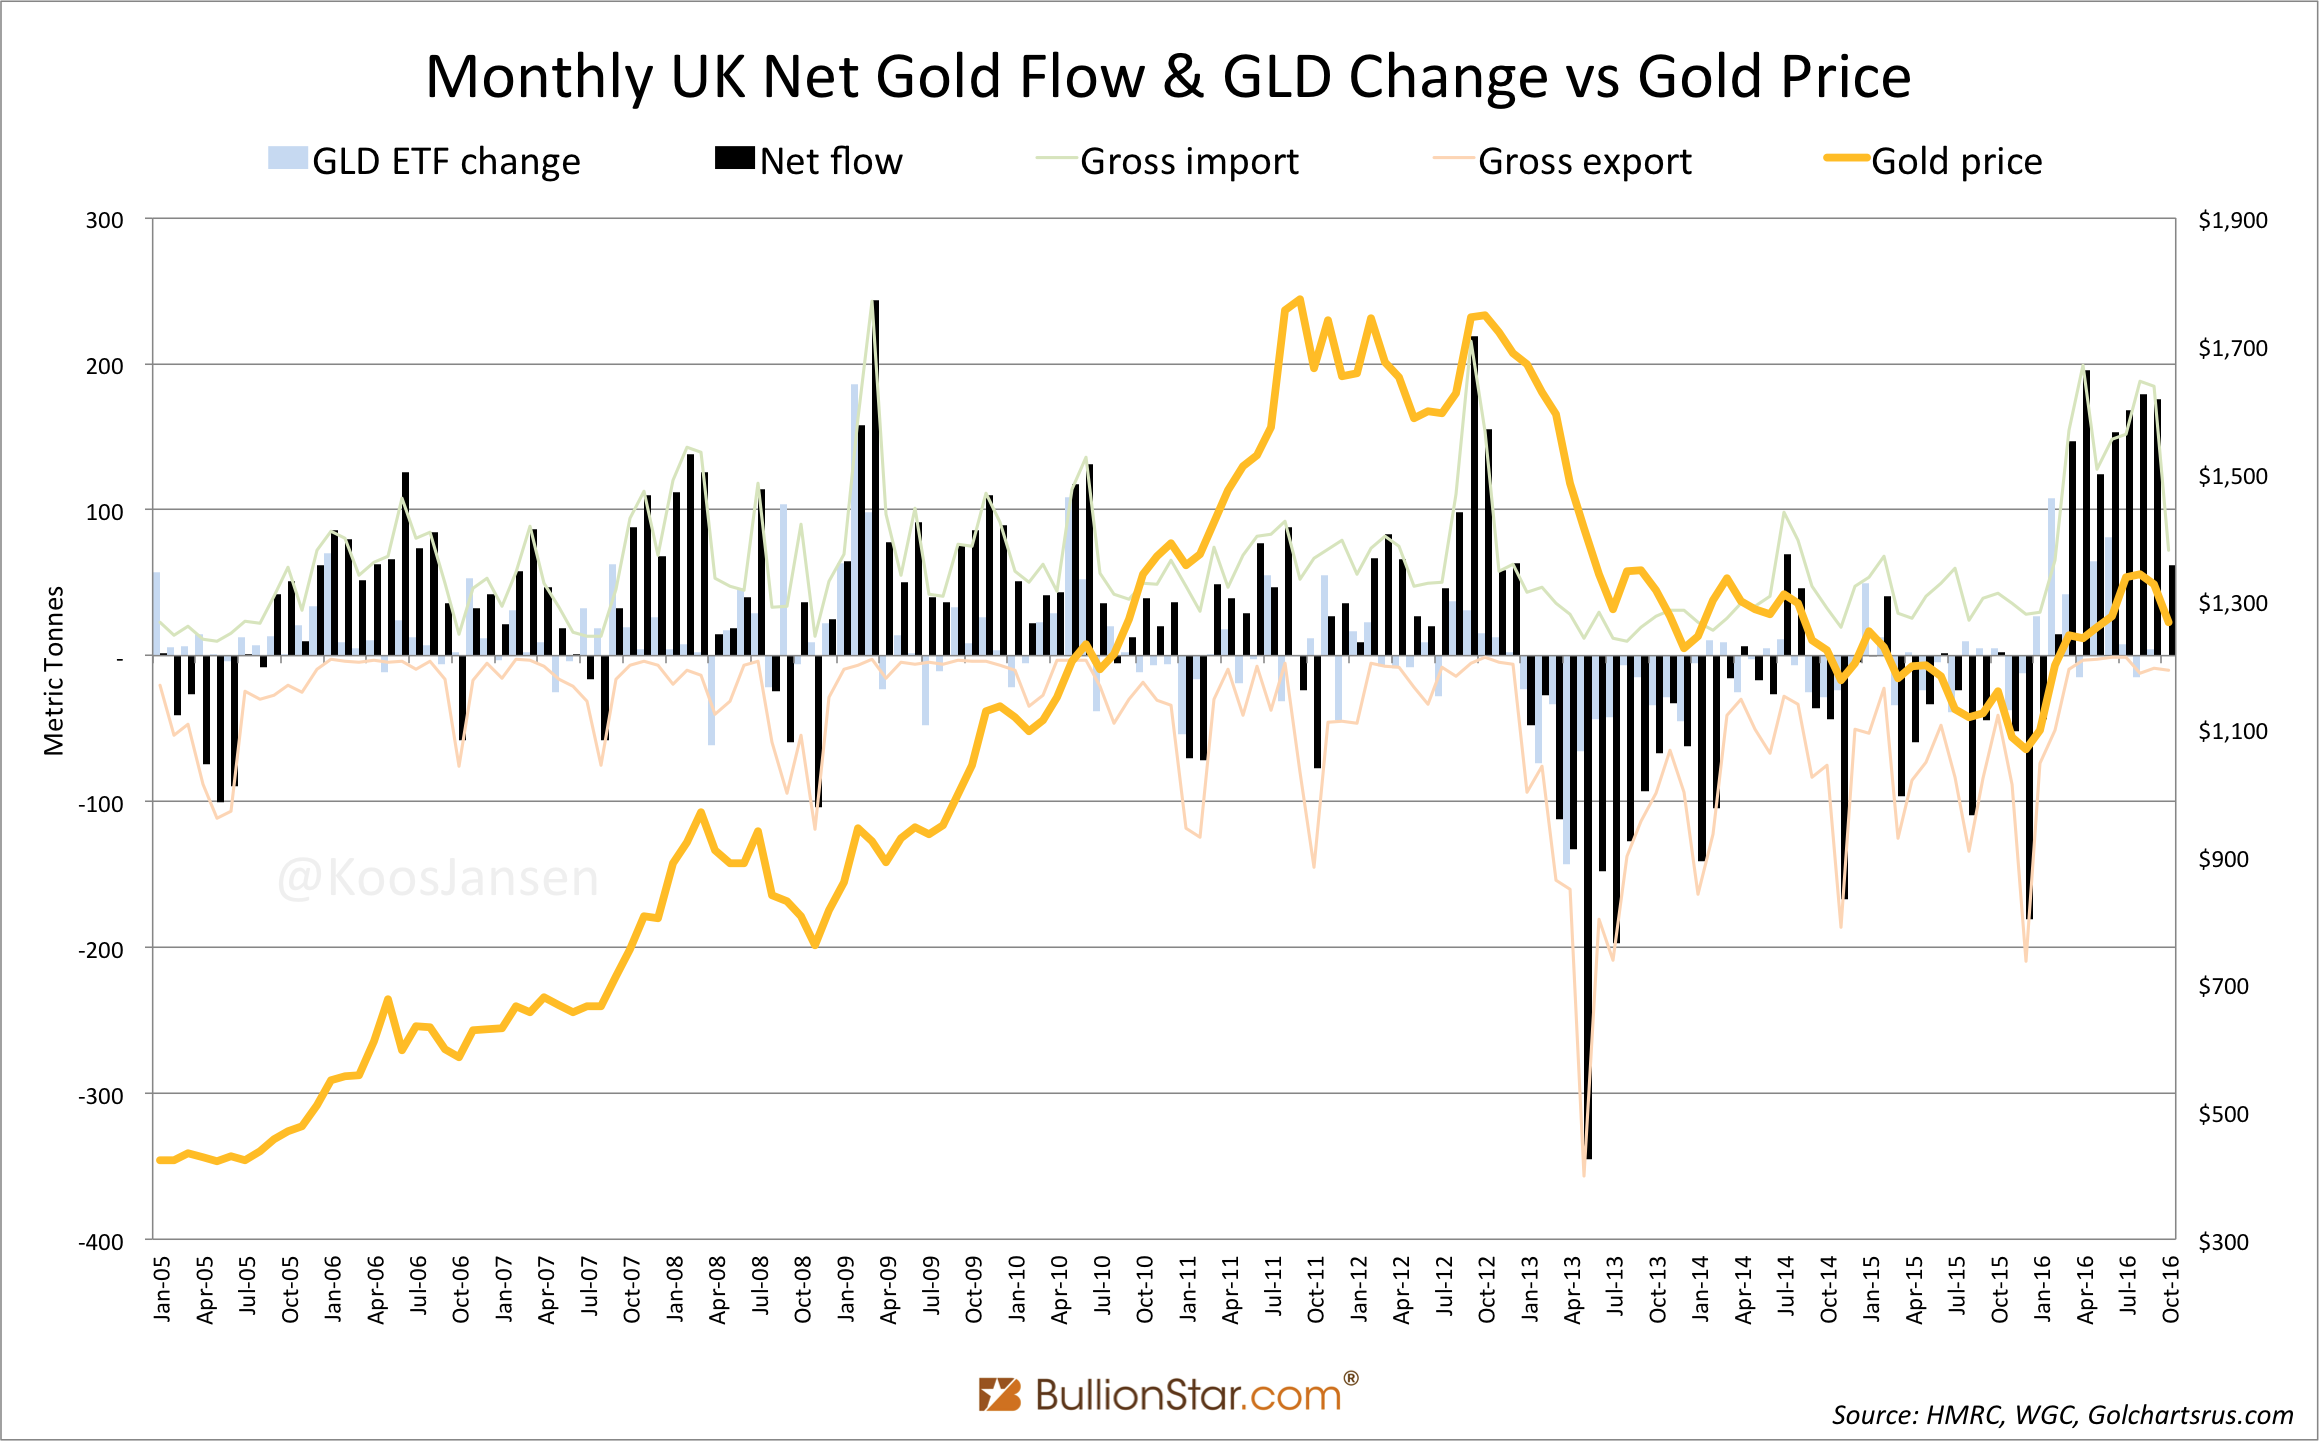
The UK’s net flow, on the other hand, is highly correlated to the medium/long term price of gold. Note how nearly every month the change in net flow corresponds with the direction of the gold price (exhibit 6). Less granular, from the moment my data starts in 2005 the UK has been a net importer until 2012 on a rising price of gold. From 2013 until 2015 the UK was a net exporter on a declining price of gold. And in the first quarter of 2016, when the gold price saw its strongest move up since 1986, the UK was a net importer. Coincidence? I think not.
We can conclude that Western institutional supply and demand in above ground gold reserves is driving the medium/long term price of gold. As it’s likely the price of gold could not have gone up from 2002 until 2011 if there had been no UK net imports, and it’s likely the price of gold could not have gone down from 2013 until 2015 if there had been no UK net exports. (Short term the gold price is pushed around in the paper markets.)
We can think of Western institutional supply and demand (the UK net flow) like this: the majority of the gold gross imported into the UK is demand from above ground reserves outside the UK, and the majority of the gold gross exported from the UK is supply to above ground reserves outside the UK. When the UK is a net importer that means there is a net pull on above ground reserves outside the UK, which corresponds to a rising gold price. When the UK is a net exporter the inverse is true.
Here it becomes apparent that the amount of above ground bullion is essential for future price developments.
The Chinese Black Hole
Let’s turn to China. In the introduction I stated China is importing a lot more gold than is known in the financial industry because most investors base their knowledge on data by the World Gold Council. More precise, China has imported 5,000 tonnes from 2007 until 2016 in addition to what the World Gold Council has portrayed through their demand statistics.
Let’s get our minds around this through some charts. As an example, I’ve drawn a chart showing Chinese gold supply and demand for 2015 (last year I have complete data of).
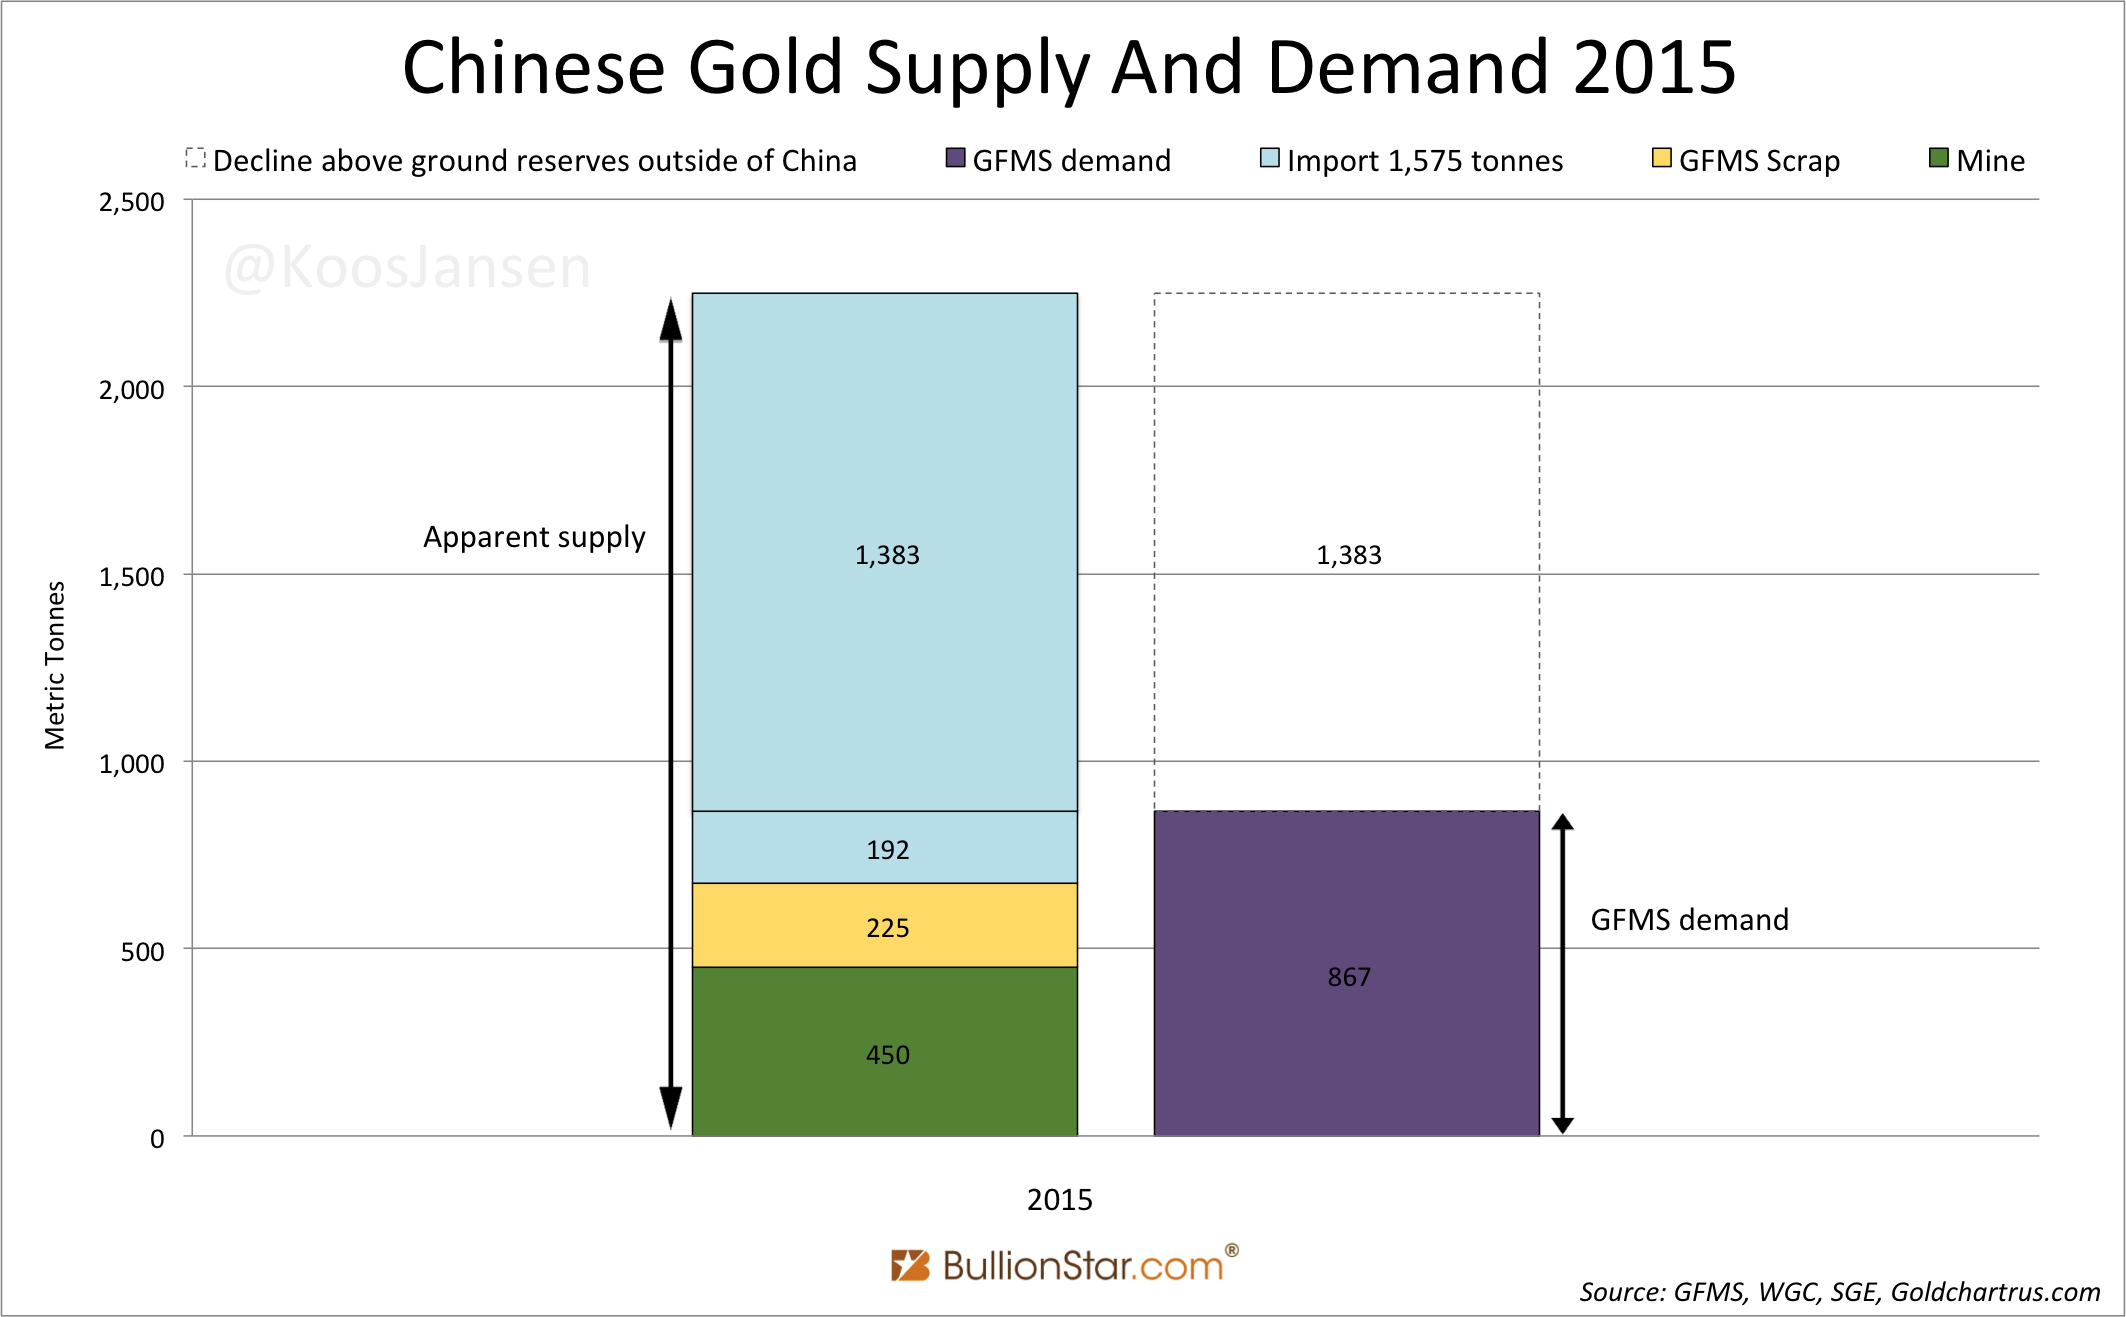
We don’t know every exact data point for China, but we do know GFMS demand (purple) and apparent supply, consisting of domestic mine output (green), scrap supply (yellow) and net import (blue). From here on we’ll use GFMS data, as GFMS publishes scrap supply numbers for China and the World Gold Council doesn’t.
According to GFMS Chinese consumer gold demand in 2015 was 867 tonnes. To meet demand GFMS presents 450 tonnes was domestically mined and scrap supply accounted for 225 tonnes. Indirectly GFMS states China net imported 192 tonnes to complete the supply and demand balance in the Chinese domestic market (exhibit 7). For the additional 1,383 tonnes imported GFMS has floated all sorts of excuses, which I‘ve debunked here and here.
The bottom line is, in addition to the 192 tonnes GFMS reports as imported in 2015 to meet consumer demand, China imported 1,383 tonnes to meet institutional demand and all this metal is not allowed to be exported.
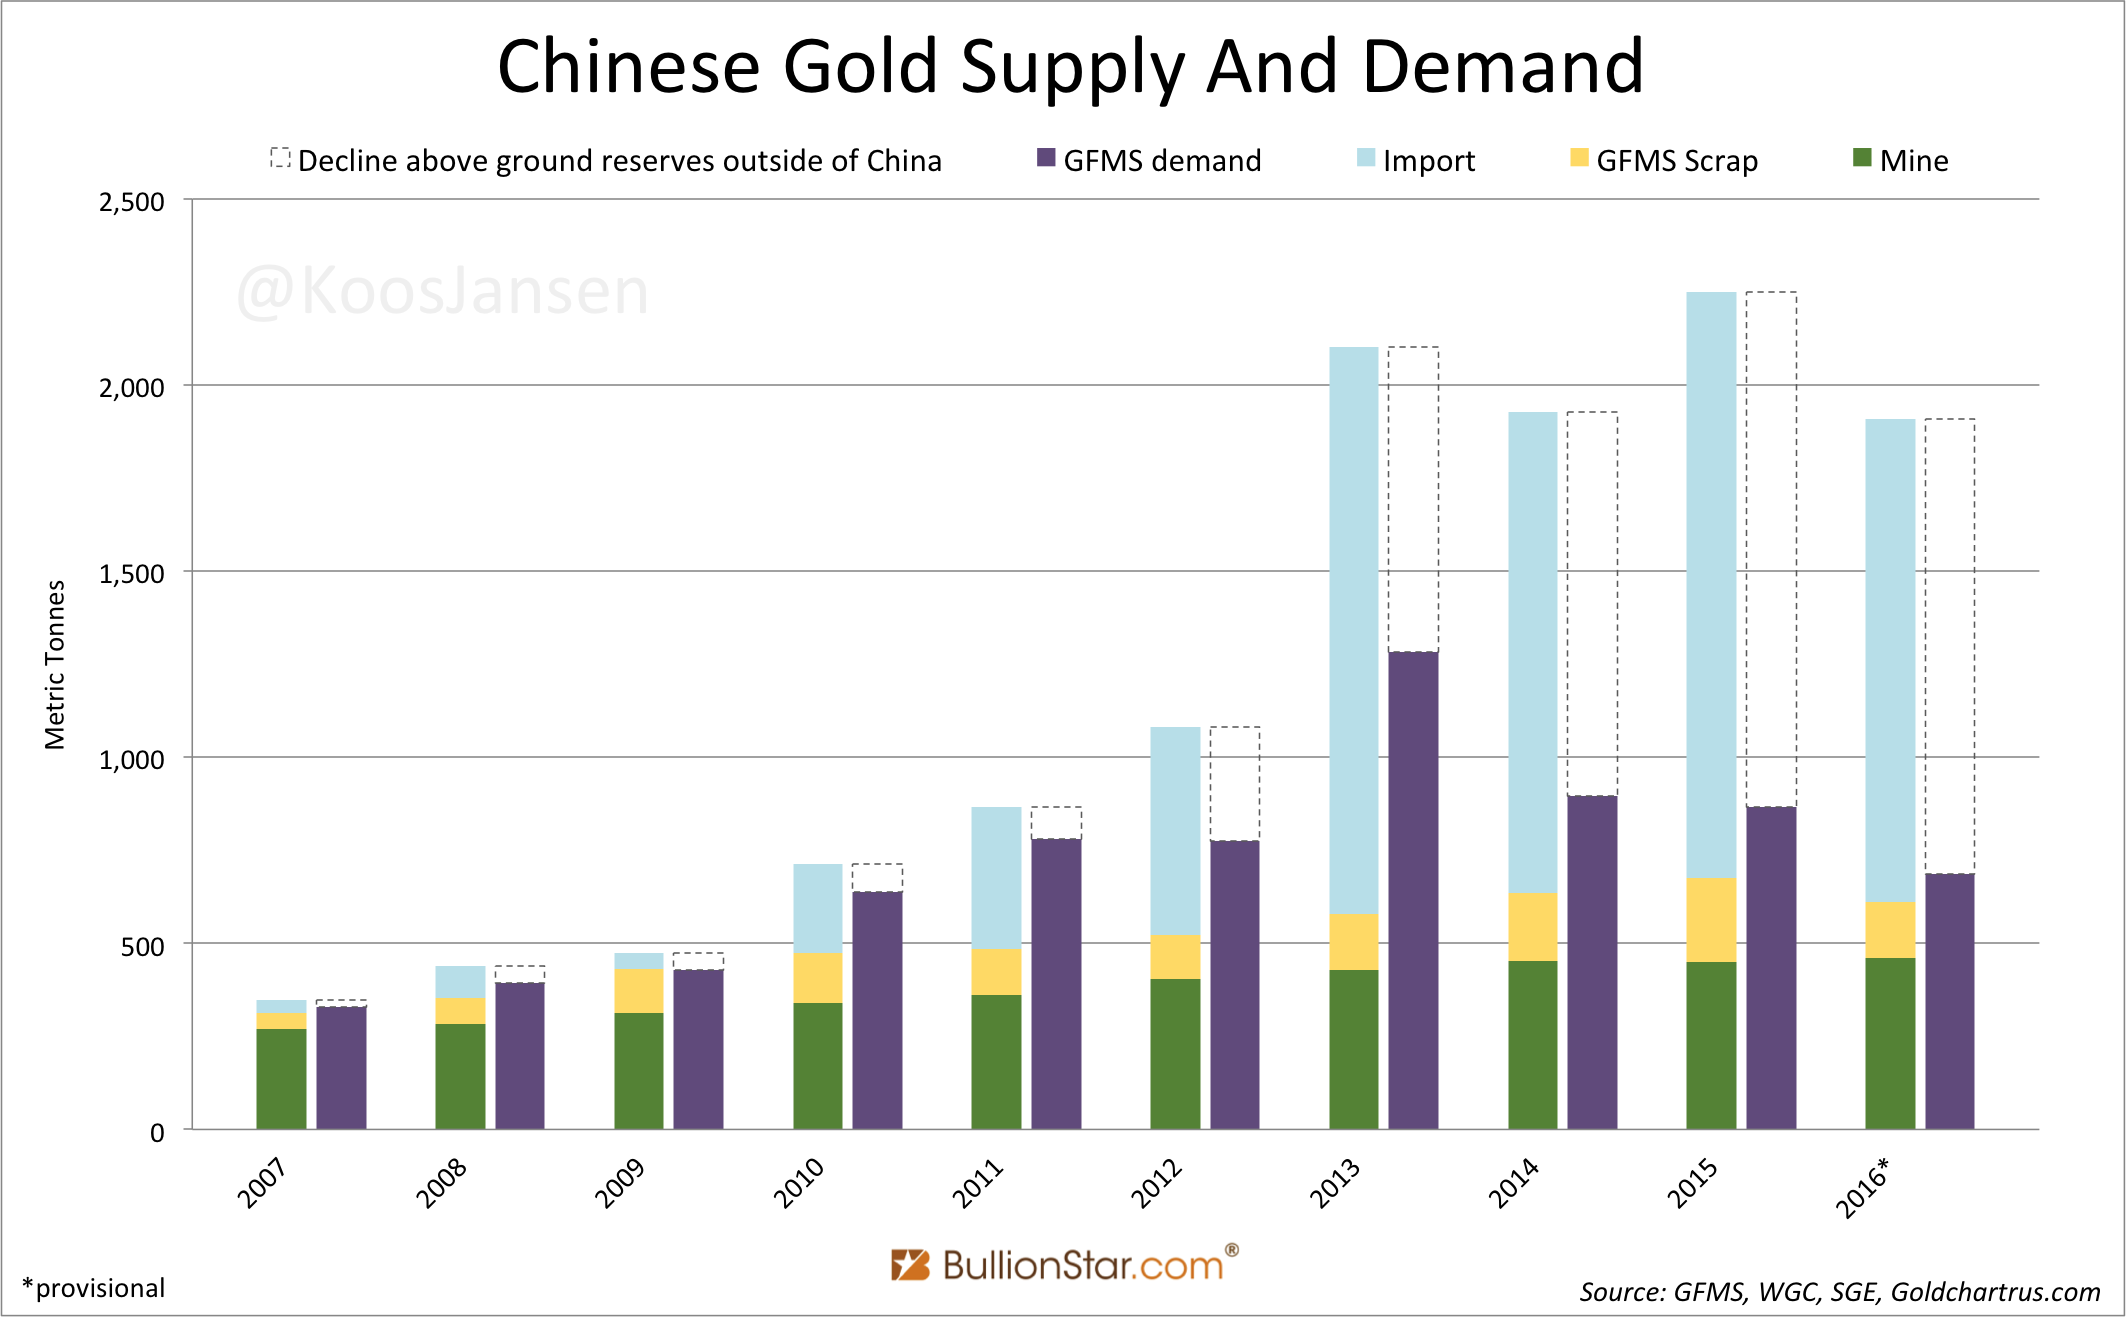
If we repeat the same exercise for every years since 2007, the aggregated net imports by China that have not been included in the statistics by GFMS account for 5,000 tonnes. See the next chart.
Conclusion
You can see now, China has enormously diminished above ground reserves outside of the Chinese domestic market without all investors around the world being fully aware. In my humble opinion this will make the price of gold go up turbo charged next time the West shows interest in the metal.
In The Prospect For Gold Green states:
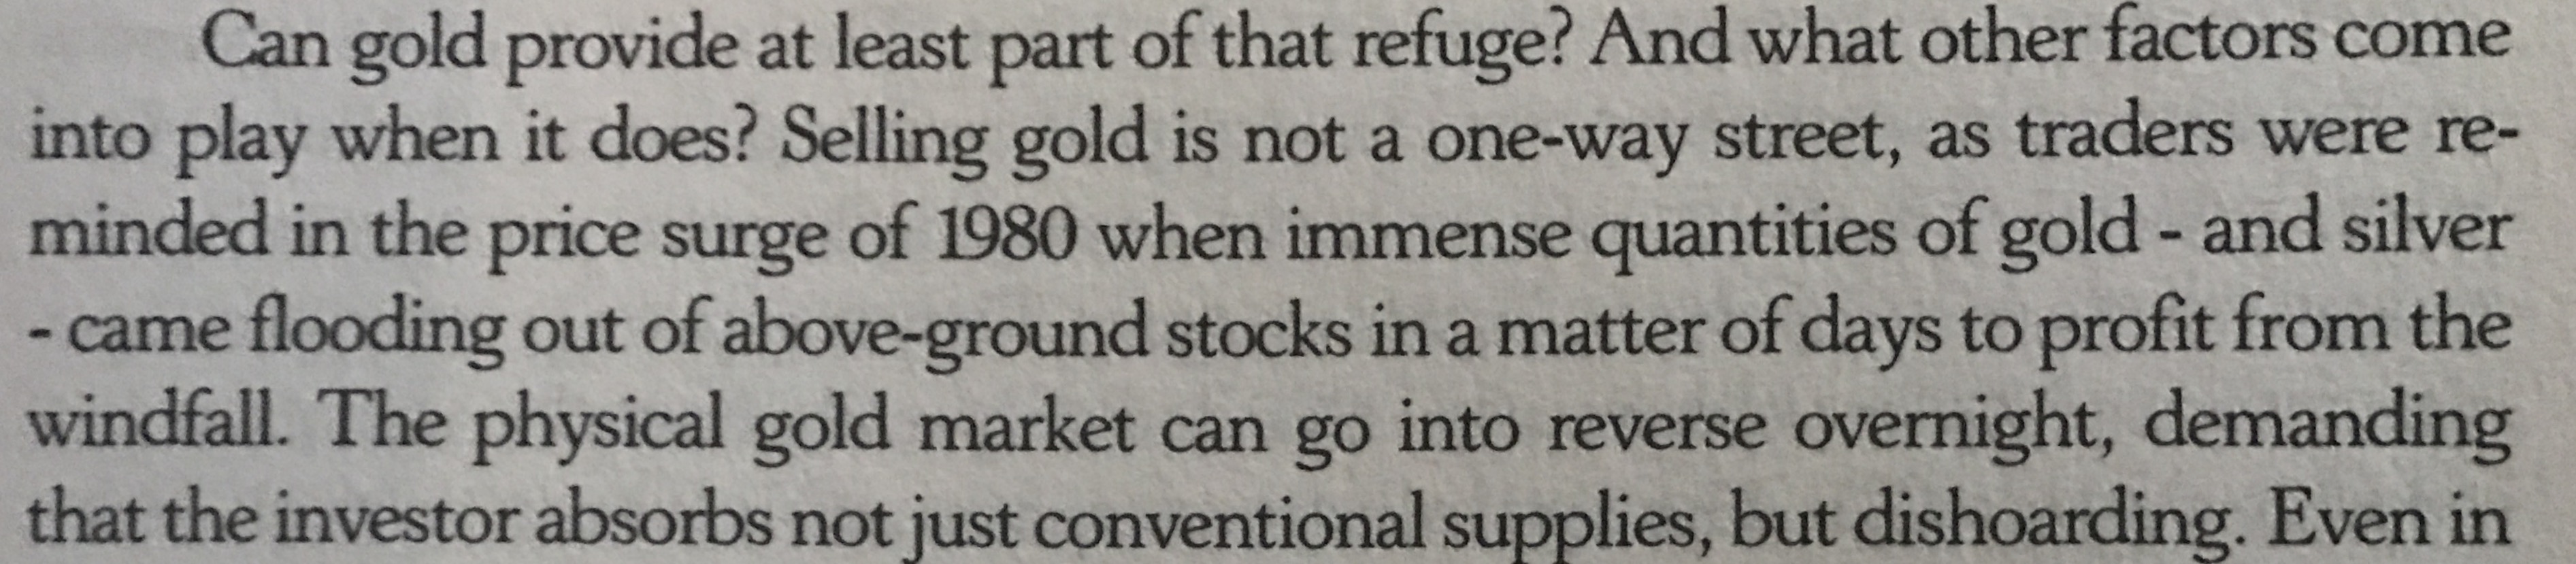
“Selling gold is not a one way street”, wrote Green in 1987. But guess what. Since a few years – from the moment China became an elephant player in the physical market – selling gold is a one way street! Western sell-offs are transhipped to China but do not return. The global gold game has changed.

The consequence is that there are less above ground reserves outside of China for Western investors to buy in a forthcoming bull market, which will elevate the dollar bid per unit gold – in other words the gold price measured in US dollars per troy ounce.

Keep in mind, this phenomenon (China importing vast quantities in addition to Chinese consumer gold demand as disclosed by GFMS) has greatly materialized in 2013, when gold entered a bear market after an 11-year run up. In the previous bull market (2002-2012) above ground reserves outside of China had not been slashed yet. So the ramifications of this phenomenon will only be felt during the next leg up.
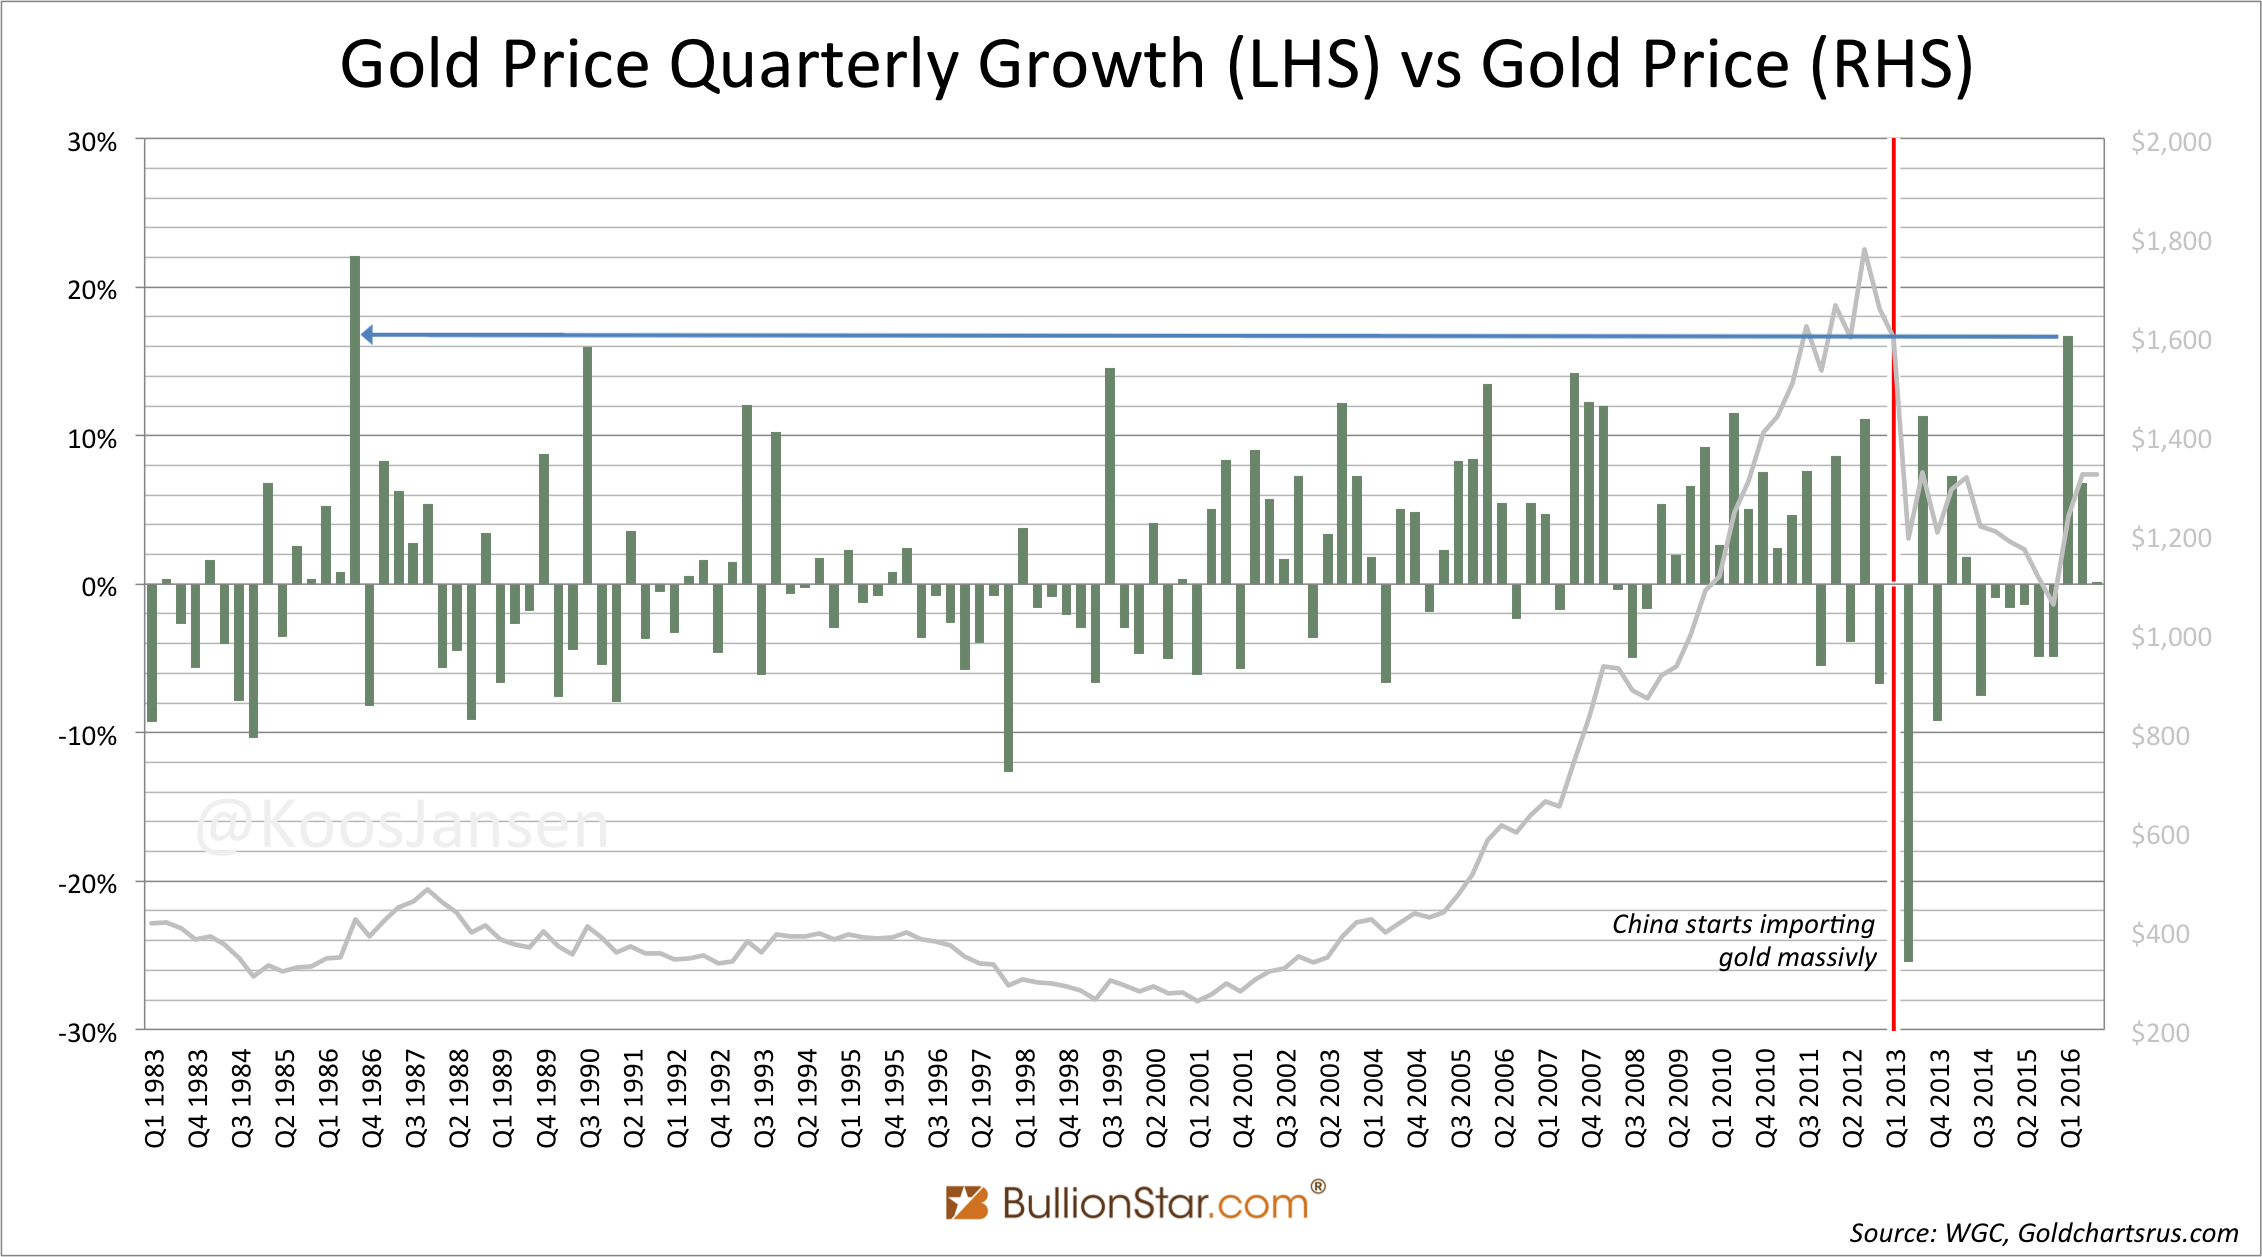
Is there any proof to substantiate my hypothesis? I think so. Early 2016 there was some renewed interest in yellow metal from large Western investors. When the price of gold started to climb it went practically vertical ending the first quarter of 2016 up 16.7 %, the strongest quarter since 1986. Coincidence? I think not. It went up strong as it did because there were fewer ounces in above ground reserves available.
A study on how much above ground reserves there are outside China will be saved for a future blog post.
Popular Blog Posts by Koos Jansen
 China’s Secret Gold Supplier is Singapore
 Audits of U.S. Monetary Gold Severely Lack Credibility
 China Gold Import Jan-Sep 797t. Who’s Supplying?
 The Gold-Backed-Oil-Yuan Futures Contract Myth
 Estimated Chinese Gold Reserves Surpass 20,000t
 PBOC Gold Purchases: Separating Facts from Speculation
 U.S. Mint Releases New Fort Knox Audit Documentation
 China Net Imported 1,300t of Gold in 2016
 Why SGE Withdrawals Equal Chinese Gold Demand and Why Not