
June 2017 Gold Market Charts

 Gold Market Charts
 0 Comments
This monthly series analyses recent developments in the world’s largest physical gold markets such as India, China, Russia and Switzerland and features charts as diverse as Swiss gold imports and exports, Russian Federation gold reserves, Shanghai Gold Exchange physical gold withdrawals, and COMEX gold futures vault inventories. The featured charts have been created by the GOLD CHARTS R US market chart website.
Shanghai Gold Exchange (SGE) – Gold Withdrawals
Shanghai Gold Exchange (SGE) gold withdrawal data for the month of May was reported by the Exchange to have reached 138 tonnes. Note, these gold withdrawal figures refer to actual withdrawals of physical gold bars from the Exchange’s vast vault network, and are a suitable proxy for estimating Chinese wholesale gold demand.
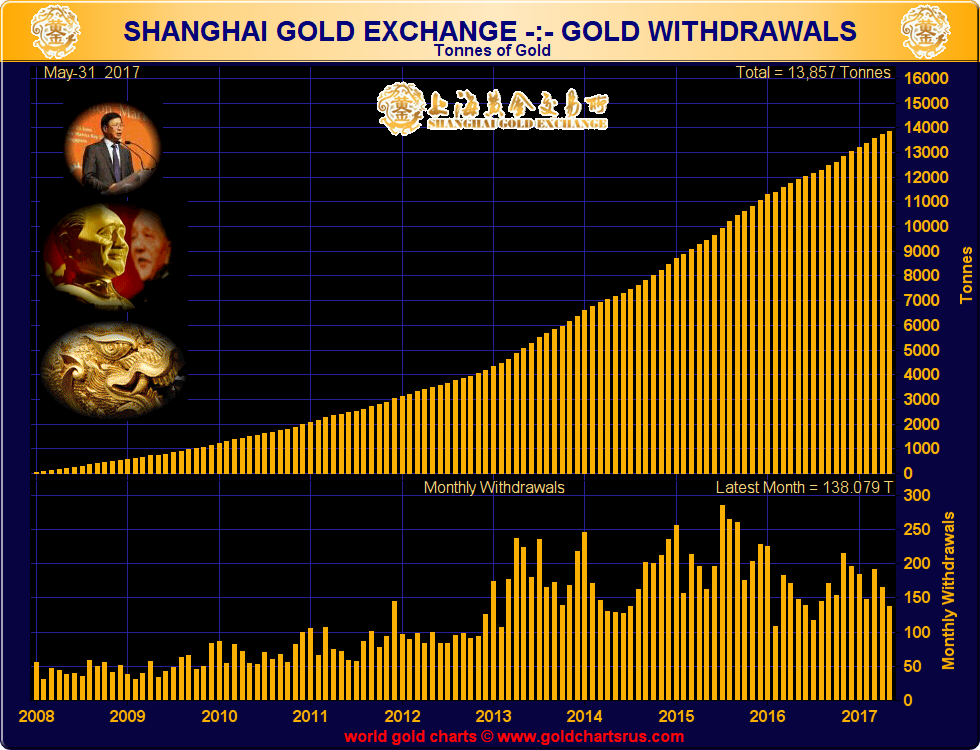
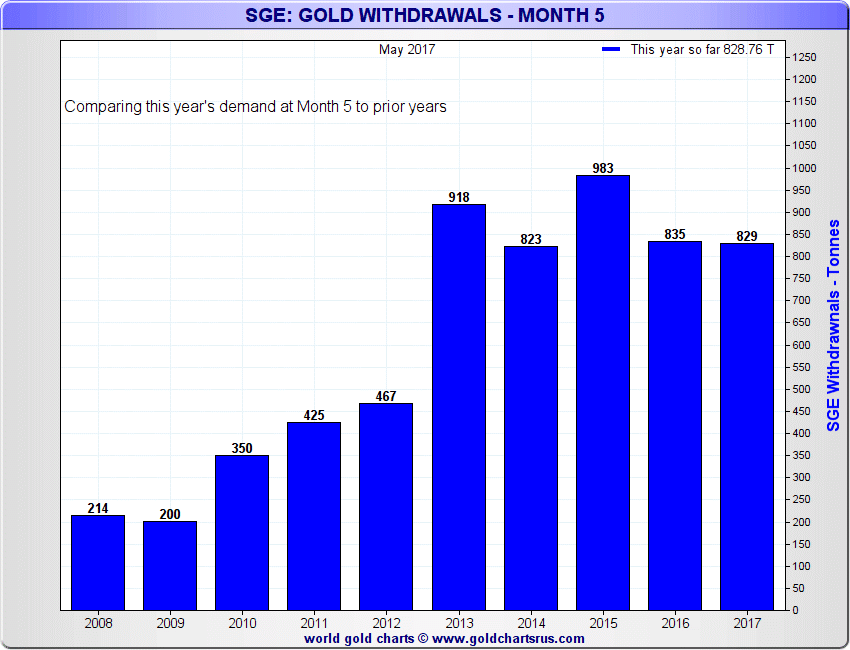
For the year-to-date (end of May ~ Month 5), SGE gold withdrawals are now running at a cumulative 829 tonnes, which interestingly is very similar to cumulative SGE gold withdrawal totals recorded at the same point in 2016 and 2014. This suggests that total SGE gold withdrawals for the Year 2017 will be of the same magnitude as 2016 when they reached 1970 tonnes, or likewise 2014, when total withdrawals that year reached 2102 tonnes.
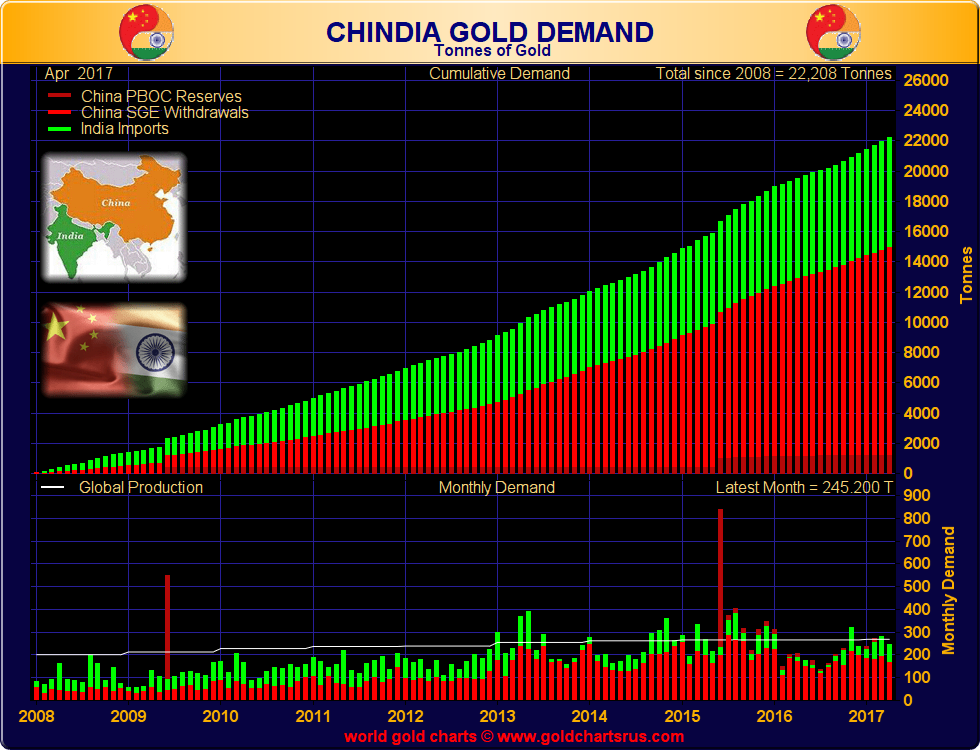
Chinese and Indian Gold Demand (CHINDIA)
The CHINDIA chart below is designed to show cumulative combined gold demand activity in the world’s two largest physical gold markets, China and India. To do this, the chart employs 3 components, namely SGE gold withdrawals (as a proxy of Chinese wholesale gold demand), Chinese central bank gold reserves (which have no connection with the Shanghai Gold Exchange), and Indian gold imports (since India predominantly uses gold imports to meet the nation’s gold demand). Since official Indian gold import data is released with more than 1 month’s lag, the latest CHINDIA chart reflects data as of the end of April.
During April total CHINDIA gold holdings increased by 245 tonnes. This comprised 166 tonnes flowing to the Chinese wholesale market (SGE gold withdrawals), and a net 79 tonnes of gold imports into India during April (94.5 tonnes imports and 15.6 tonnes exports). There was no reported increase in Chinese central bank gold reserves during April.
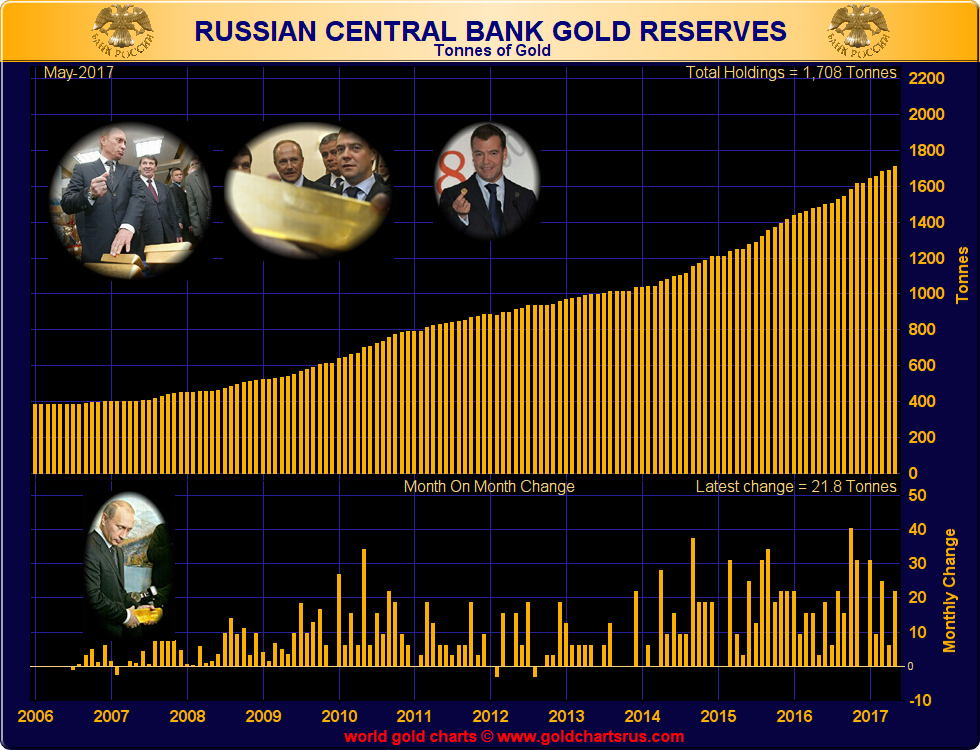
Official Russian Gold Reserves
The Bank of Russia’s latest reserve update shows it having added a sizeable 21.8 tonnes of gold to the Russian Federation’s monetary gold reserves during May. And now for the first time, the official gold reserves of the Russian Federation stand at more than 1700 tonnes. Year-to-date, the Bank of Russia has now added 93.3 tonnes of physical gold to its reserves, which when annualised is 224 tonnes.
To add an extra 200 tonnes of gold to its gold reserves by the end of 2017 (compared to year-end 2016), the Bank of Russia needs to now add 107 tonnes more over the June to december period, or an average of 15.25 tonnes per month for the next 7 months. It may add more, so expect a year-end addition of between 200 tonnes and 220 tonnes. But don’t expect smooth monthly additions. The Bank of Russia’s gold buying trend tends to be choppy, and often consists of a large volume month followed by a month in which it only adds a few tonnes.
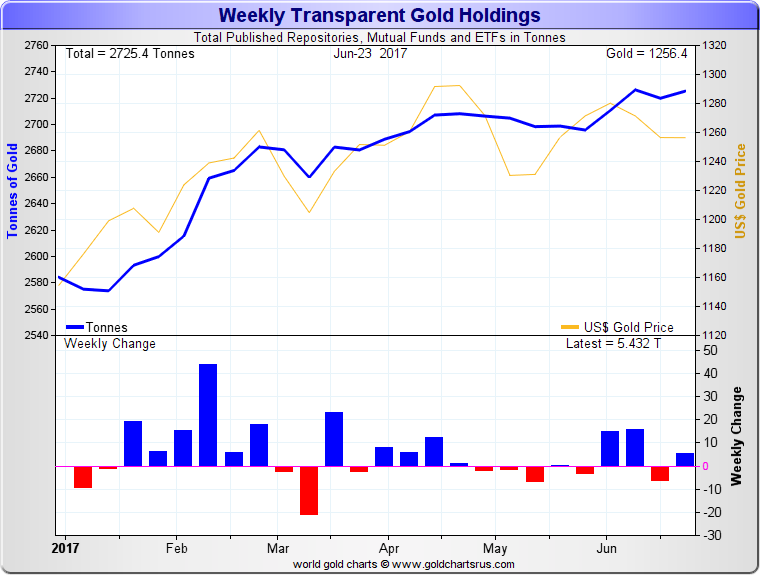
Transparent Gold Holdings – ETFs and Others
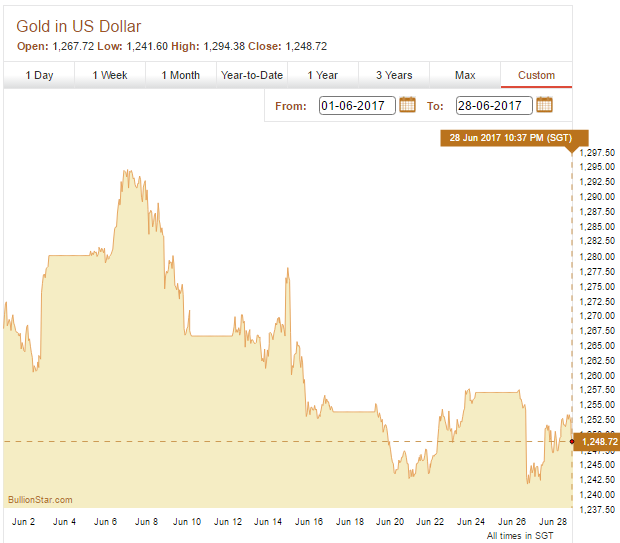
After having risen to just under $1300 during the first week of June, the US Dollar gold price ebbed lower during June, and by mid-month was trading in the $1250 range. The second half of the month saw the USD price trade in an extremely tight trading range between the $1260 and $1240 level, with 26 June witnessing a flash crash of the COMEX gold futures price which looked suspiciously like an intentional takedown during the illiquid hours of a trading day when a number of gold markets were also on holiday. However, the mainstream financial media and establishment precious metals dealers, as always, failed to investigate this movement, taking the lazy approach of attributing the flash crash to a ‘fat finger’.
The physical gold holdings of the group of platforms and vehicles that are tracked in the below chart rose slightly during June, by about 25 tonnes. Gold holdings of this group of products now stand at a combined 2725 tonnes.
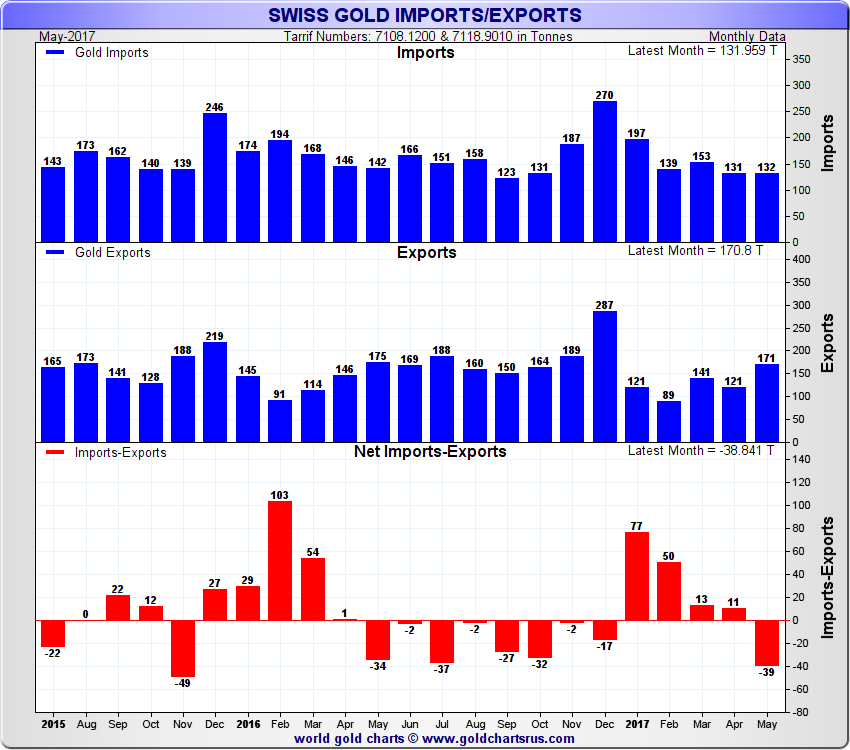
Swiss Gold Imports and Exports
According to Swiss customs statistics, Switzerland imported 132 tonnes of non-monetary gold during May 2017 and exported 171 tonnes of non-monetary gold, for a net 39 tonnes of non-monetary gold exports.
May’s gold export total was the highest monthly total so far this year, and signals that after net importing 151 tonnes of gold during the January to April period, the Swiss refineries are now drawing down on those inventories and shipping higher volumes of gold out to the Asian gold markets.
Last year, a similar trend was observed, during which the Swiss net imported 187 tonnes of gold over the January to April 2016 period, after which the remaining 8 months of 2016 saw Switzerland net export 153 tonnes of gold.
This switch from net imports to net exports during May 2017 suggests that the coming months will see further large volumes of gold exports from Switzerland as the inventory build-up from Q1 is further drawn down.
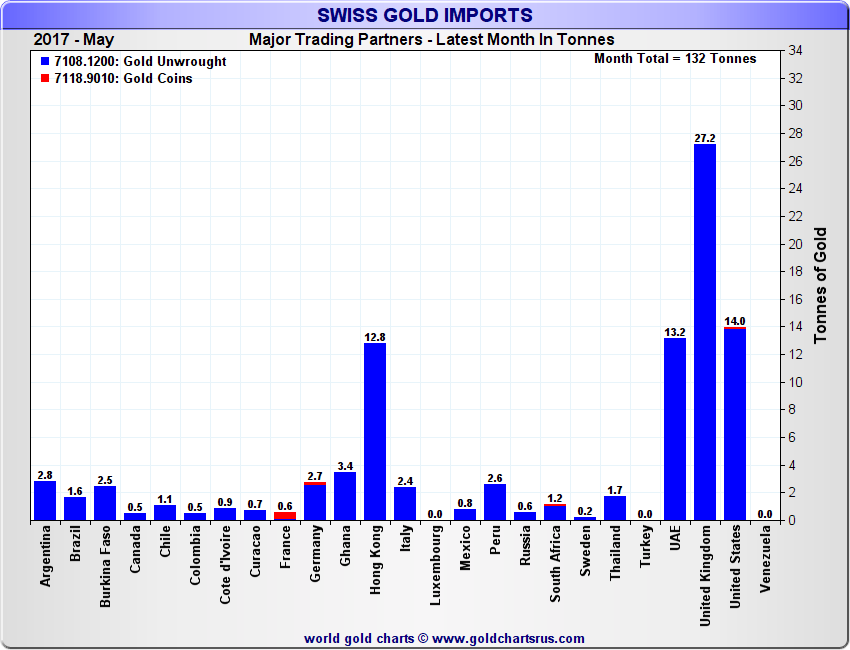
The UK, or more correctly the London Gold Market, reappeared in May as the largest supplier of non-monetary gold to Switzerland, sending 27.2 tonnes to the Swiss. In second place was the US which shipped 14 tonnes of gold to Switzerland, closely followed by the UAE / Dubai, which exported 13.2 tonnes to Switzerland, and Hong Kong, which sent 12.8 tonnes. Together these 4 sources supplied 67.2 tonnes, or just over 50%, of Switzerland’s May’s gold import total of 132 tonnes.
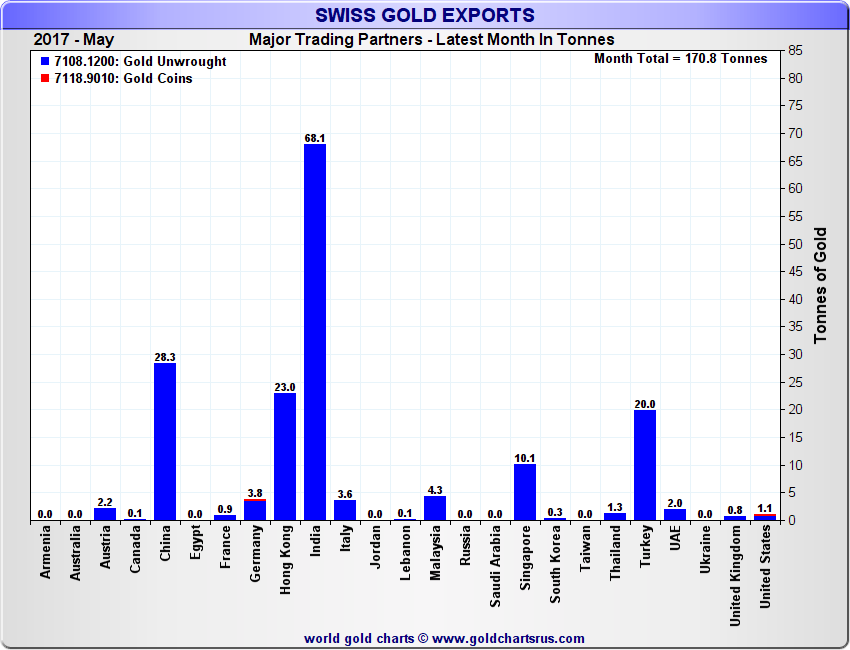
Note that Swiss published gold exports predominantly refer to exports of fine gold bars, mostly in kilobar denominations. During May, Switzerland exported 68.1 tonnes of gold to India, 28.3 tonnes to China, 23 tonnes to Hong Kong, and 20 tonnes to Turkey. Therefore, on a combined basis, India, China and Hong Kong took a whopping 70% of Switzerland’s fine gold bar exports during the month. Adding in Turkey, these 4 markets represented a staggering 82% of Swiss fine gold exports.
India continues its track record as the largest recipient of Swiss gold for every month in 2017. Year-to-date including May, India has now imported 235 tonnes of fine gold from Switzerland, which on an annualised basis is 565 tonnes.
During June, a new harmonised Goods and Service Tax (GST) tax rate of 3% on gold was decided by India’s GST Council. This rate on gold, whose determination had been delayed due to continued discussions within the Indian bullion industry, will now apply nationwide from 1 July 2017, and is part of a significantly overhauled Indian GST regime change.
Although the rate on gold is now settled, the banks approved to import gold into India (nominated banks) who traditionally apply VAT at source on imported gold, still say that they are unclear as how this new GST will be applied and whether they will be shielded from price movements between the time they pay the GST at source and the time they pass the GST on to their customers. This grey area is reported by the Indian media to be causing some banks to defer non-essential gold imports and it may well subdue Indian fine gold import volumes during June and July.
Note that although China now imports more gold directly from Switzerland than it used to, some of the gold flowing into China still goes through the entrepôt of Hong Kong, so its worth keeping in mind that some of Switzerland’s gold exports to Hong Kong will invariably end up in the Chinese domestic gold market.
Swiss Gold Imports from London
Following April during which the London Gold Market only supplied 4.6 tonnes of gold to Switzerland, in May the London market re-emerged as an important gold supplier to the Swiss, sending 27.2 tonnes across Switzerland’s borders. London’s role as a net supplier of gold to the Swiss during 2017 therefore still seems intact, and year-to-date London has now sent 172 tonnes of non-monetary gold into Switzerland.
How this gold outflow is affecting the London commercial gold vaults (and the Bank of England gold vaults) will become clearer over the remainder of the year with the London Bullion Market Association (LBMA) promising to begin publishing the aggregate level of London gold (and silver) vault holdings in July. As reported here, this LBMA vault reporting will be on a three-month lagged basis but will in time allow comparisons between gold-backed ETF outflows, London gold vault holdings changes, and London to Switzerland gold trade flows.

COMEX – Gold in storage New York approved vaults
Towards the end of June, the group of COMEX approved vaulting facilities (such as the vaults of Scotia, HSBC, JP Morgan and Brinks in New York City) which hold gold that can back COMEX 100 oz gold futures contracts, reported holding 26.46 tonnes of gold in the Registered category, and 282.38 tonnes of gold in the Eligible Category.
These quantities were very similar to May month-end when the same group of approved vaults reported holding 27.3 tonnes of Registered gold and 264.8 tonnes of Eligible gold. This relatively low and unchanging level of Registered gold as per usual underscores the fact that COMEX gold futures trading is literally a paper trading casino where 99.96% of contracts never result in physical delivery.
Registered gold refers to 100 ounce bars and 1 kilo bars of approved refiner brands for which a title warrant has been issued by an approved precious metals vault facility signifying delivery of a gold futures contract. Eligible gold refers to all acceptable gold bars (excluding Registered gold) residing in the set of COMEX approved vaults which is acceptable by the COMEX exchange for delivery against gold futures contracts.

COMEX vaulted gold in New York (Registered and Eligible), 2002 – 2016 and current 2017, Source:www.GoldChartsRUs.com
Popular Blog Posts by Gold Market Charts
 November 2018 Gold Market Charts
 May 2018 Gold Market Charts
 December 2017 Gold Market Charts
 November 2017 Gold Market Charts
 October 2017 Gold Market Charts
 September 2017 Gold Market Charts
 August 2017 Gold Market Charts
 July 2017 Gold Market Charts
 June 2017 Gold Market Charts
 May 2017 Gold Market Charts