
August 2017 Gold Market Charts

 Gold Market Charts
 2 Comments
The August wrap-up of BullionStar’s monthly gold charts column looks at the latest data for Chinese gold demand, Indian gold imports, Swiss gold imports and exports, and Russian official gold reserve accumulation.
Separately, note that BullionStar’s website offers a range of dynamic charts under the BullionStar Charts menu. The data underlying these charts spans precious metals, major currencies, stock indices and major stocks, and also charting of BullionStar bullion products. Charting utilities on the BullionStar Charts page allows every asset / financial instrument featured to be measured in terms of every other asset or instrument featured.
Shanghai Gold Exchange (SGE) gold withdrawals
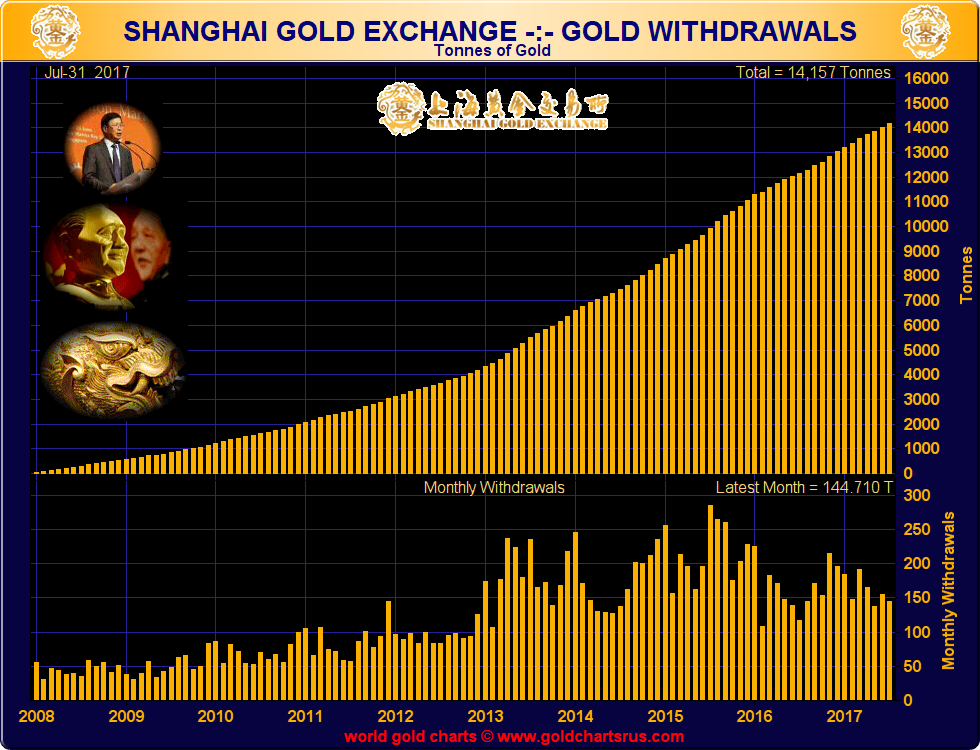
Physical gold withdrawals from the Shanghai Gold Exchange are a good proxy of wholesale gold demand in mainland China. Why this is so is explained in Koos Jansen’s articles and also in summary article in the BullionStar Gold University titled “The Mechanics of the Domestic Chinese Gold Market."
During July, gold withdrawals from the SGE gold vaulting network across China totalled 144.7 tonnes, which was the second lowest SGE monthly gold withdrawals so far this year.
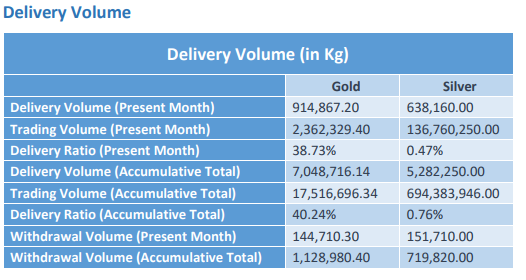
SGE gold withdrawals: July 2017: 144.71 tonnes. Source: SGE July Data Highlights Report
For the year-to-date to the end of July 2017, physical gold withdrawals from the SGE vaults in China have now reached a cumulative 1129 tonnes, which if annualized would be 1935 tonnes, or approximately two-thirds of annual primary global gold supply.
Chinese and Indian Gold Demand (CHINDIA)
Adding SGE Gold withdrawals to Chinese central bank gold reserves gives a reasonable proxy for the combined amount of physical gold within China’s borders that is controlled by both the Chinese population and the Chinese State. Further adding net Indian gold imports to this Chinese total gives a resulting figure known as Chinese and Indian Gold Demand (CHINDIA). CHINDIA gold demand is then a convenient metric of the total physical gold demand emanating from the world’s two largest physical gold markets, i.e. China and India.
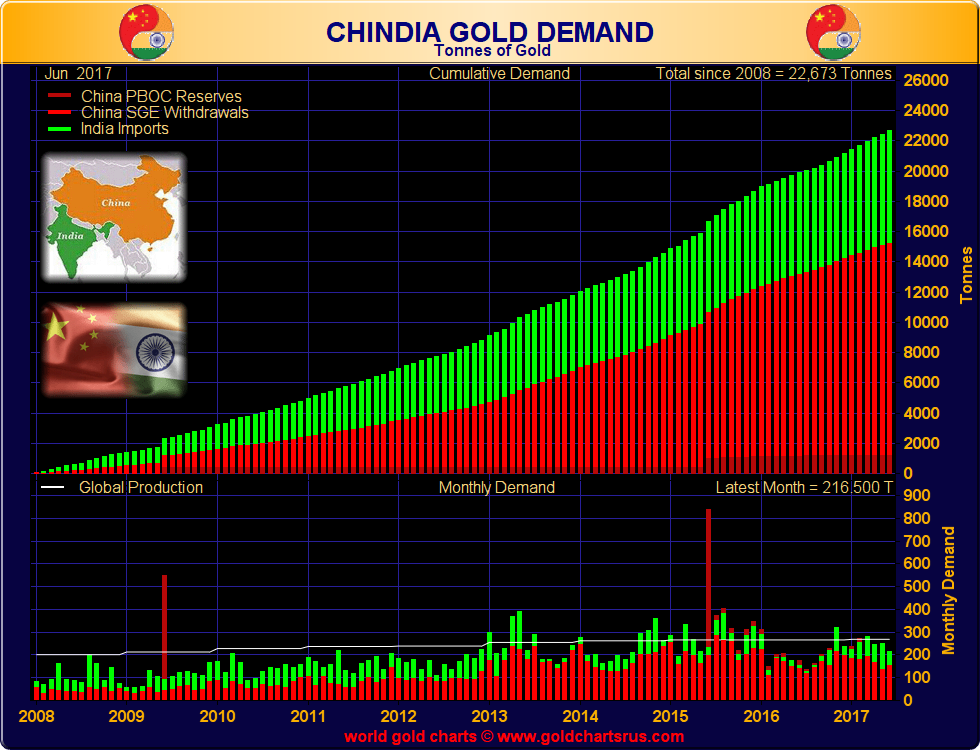
During June 2017 (the latest month calculated due to a 2 month lag on official reporting of Indian gold imports), total CHINDIA gold demand reached 216 tonnes.
Russian Gold Reserves
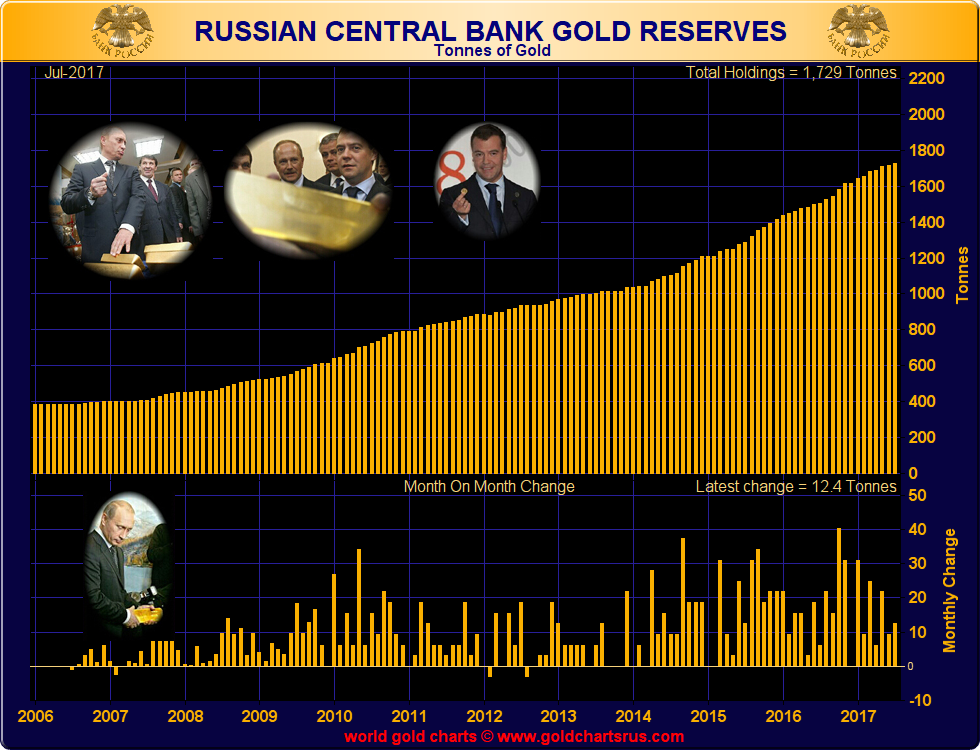
The central bank of the Russian Federation (Bank of Russia) reported official gold reserve additions of 12.4 tonnes during July 2017. For the year-to-date to end of July, Russian official gold reserves have now risen by 115 tonnes. With 5 months remaining in the year, the Russian central bank will now most likely need to announce average monthly gold purchases of 17 tonnes per month if it is to ensure total gold reserve accumulation of 200 tonnes for the full year of 2017. Therefore, expect the sensationalist reporting of Russian gold purchases, from some elements of the media, to intensify over coming months.
Transparent Gold Holdings
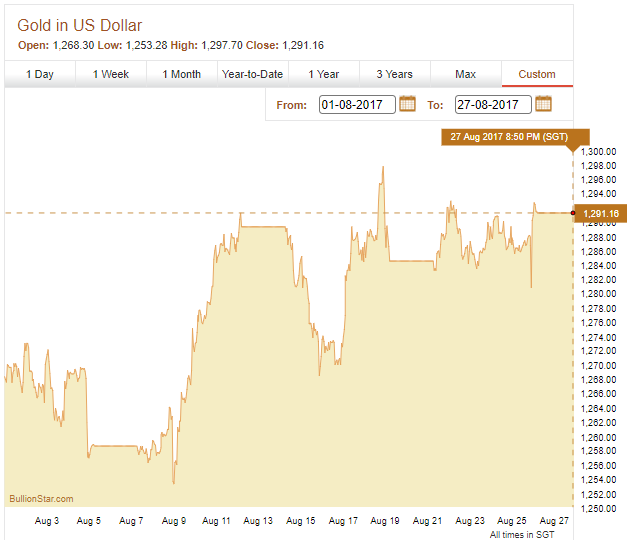
The gold price as measured in US Dollars ebbed lower during the first few trading days of August while remaining in a tight trading range near the $1260 level. Then from August 9 the price made a move up towards the $1300 level but this level was denied. A second attempt by the US dollar gold price a few days later made a brief move above $1300 but this was also short-lived. The remainder of August was the same story, with the gold price failing to rise above the $1300 mark, a situation which, from one perspective, continues to offer buying opportunities below this $1300 level.
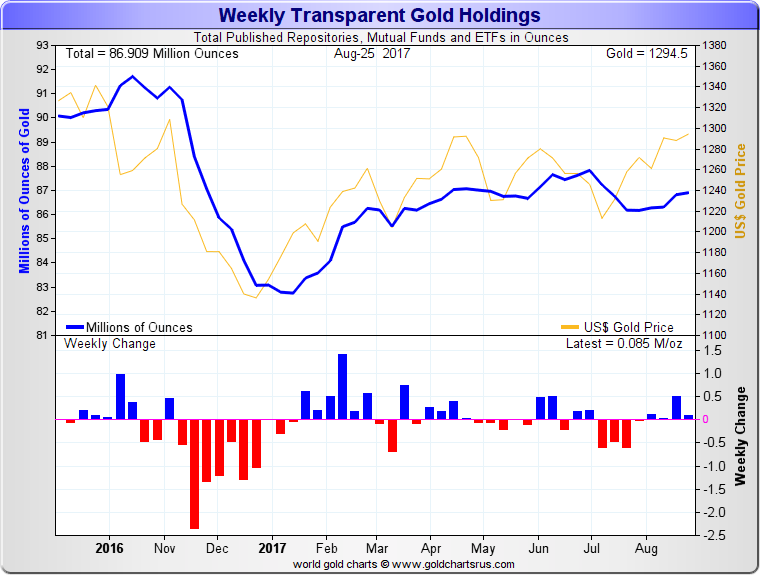
The following chart shows the amount of physical gold held across a broad array of Exchange Traded Funds, futures exchanges and other products which regularly divulge their gold holdings.
During August, there was a slight increase in the quantity of gold reported in this combined category, however, but the change was practically imperceptible. This continues the trend for the year-to-date in which there is very little change month-on-month for the overall quantity of gold flowing into or out of these products and holdings.
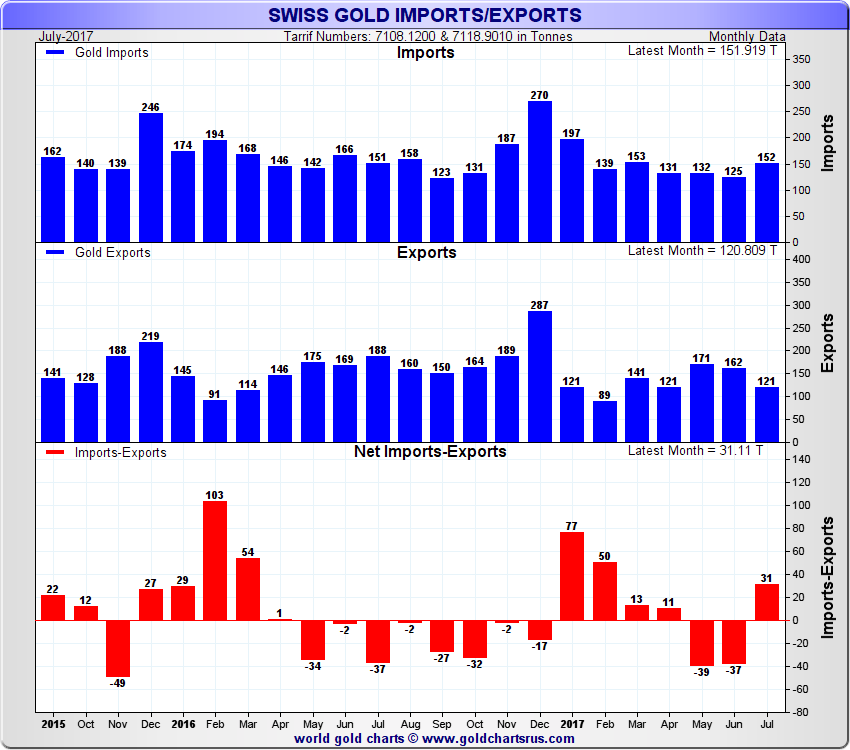
Swiss Gold Imports and Exports
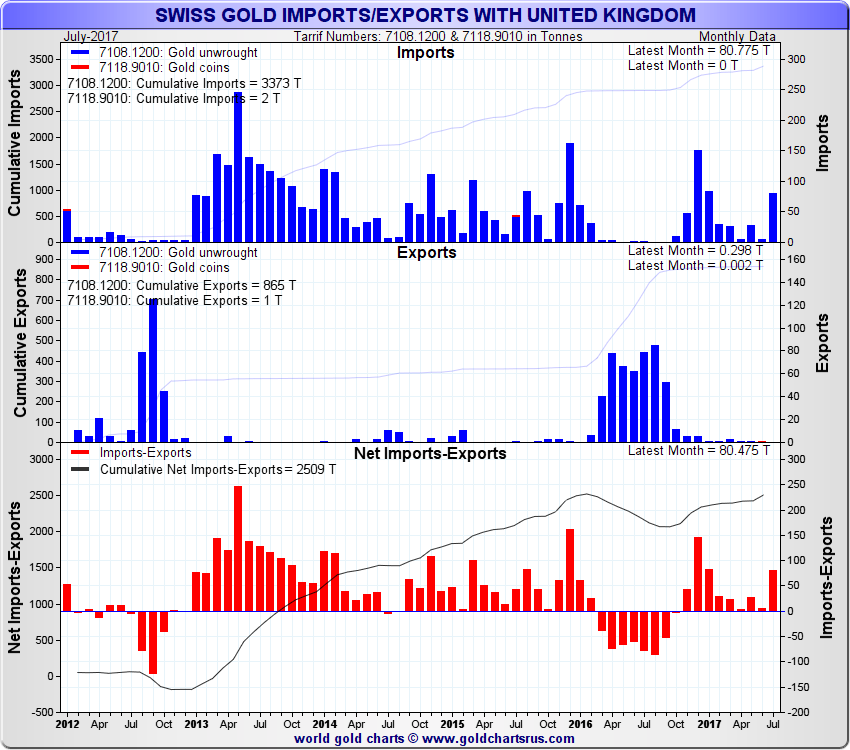
The most recent trade statistics from the Swiss Federal Customs Administration reveal that during July, Switzerland imported 152 tonnes of non-monetary gold, and exported 121 tonnes of non-monetary gold. Note that non-monetary gold refers to gold that is not central bank (a.k.a. monetary gold).
After only sending 5 tonnes of gold to Switzerland during June, the UK (or more correctly the London wholesale Gold Market) returned in July to being the top exporter of gold to the Swiss, sending 81 tonnes into Switzerland’s borders.
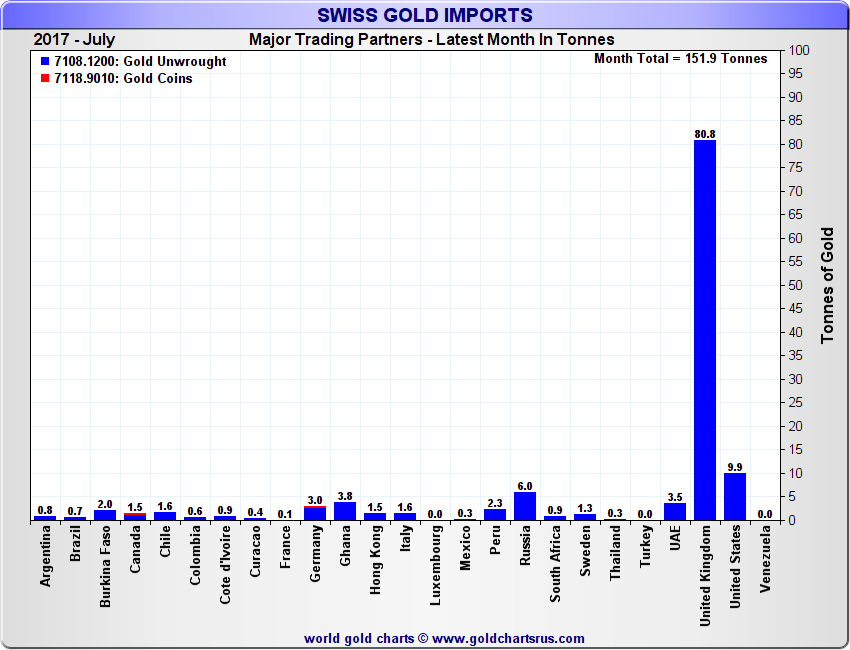
Apart from January 2017 when the UK exported 84 tonnes of non-monetary gold to Switzerland, July was by far the busiest month of 2017 for gold shipments from the London vaults to the Swiss, as this next chart illustrates.
As was noted in last month’s issue of BullionStar’s monthly charting article:
“during July, the world’s largest gold ETF, the SPDR Gold Trust (GLD), saw its gold holdings shrink from about 840 tonnes to under 800 tonnes. This was a continuation of the downward trend that saw GLD gold holdings fall from the 865 tonne level in early June.
Could the bullion banks in London be raiding the GLD so as to source physical gold to send to the Far East via Switzerland? Possibly, but if so, this has not shown up in Swiss gold imports for June (see below), but could possibly show up in Switzerland’s July import figures, which will only be released in August.“
With the SPDR Gold Trust having lost approximately 65 tonnes of gold over June and July, it appears that at least some of this 81 tonnes of gold that flowed from London to Switzerland during July was gold that had been in the SPDR Gold Trust (GLD), or at least there is a correlation between outflows of gold from the SPDR Gold Trust, and London to Switzerland gold exports over the same period.
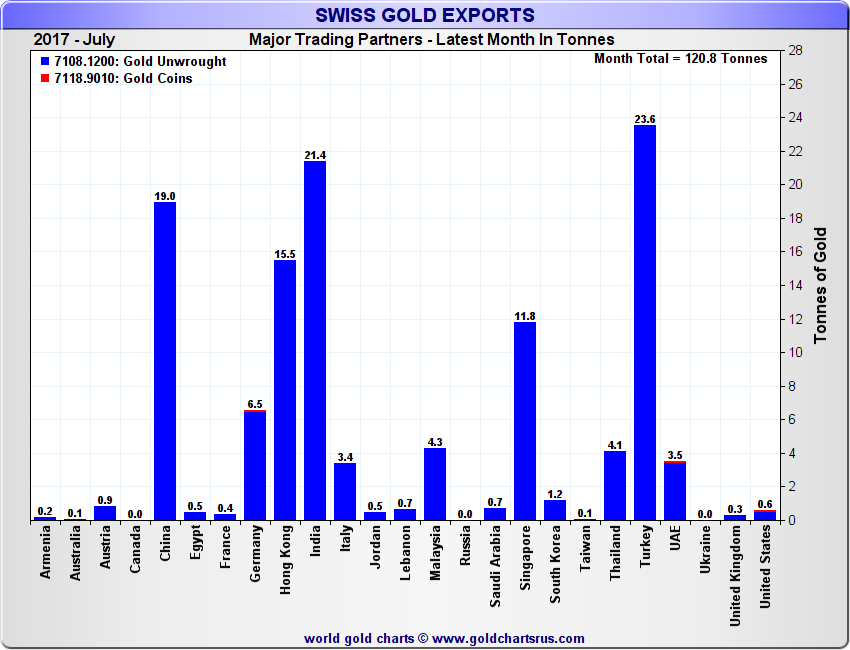
Turkey, India, Hong Kong, China and Singapore were the 5 largest destinations for Swiss non-monetary gold exports during July. Between them, these 5 economies imported 91.3 tonnes of gold from Switzerland in July, or 75% of the month’s total gold exports. All of these markets host buoyant physical gold markets and testify to the dominance of Eastern markets in generating the bulk of global physical gold demand.
Popular Blog Posts by Gold Market Charts
 November 2018 Gold Market Charts
 May 2018 Gold Market Charts
 December 2017 Gold Market Charts
 November 2017 Gold Market Charts
 October 2017 Gold Market Charts
 September 2017 Gold Market Charts
 August 2017 Gold Market Charts
 July 2017 Gold Market Charts
 June 2017 Gold Market Charts
 May 2017 Gold Market Charts