
May 2017 Gold Market Charts

 Gold Market Charts
 0 Comments
This monthly column looks at developments and trends in the world’s major physical gold markets via a series of gold market charts created by the GOLD CHARTS R US website. In most cases, the charts featured capture data to month-end April 2017 from official data which has become available during May.
Separately, the BullionStar website offers a large selection of dynamic charts under the BullionStar Charts menu. The data underlying these charts covers precious metals, major currencies, stock indices and major stocks, other commodities, and also BullionStar bullion products. The charting utilities on the BullionStar Charts page allows every asset / financial instrument featured to be measured in terms of every other asset or instrument featured.
Shanghai Gold Exchange (SGE) – Gold Withdrawals
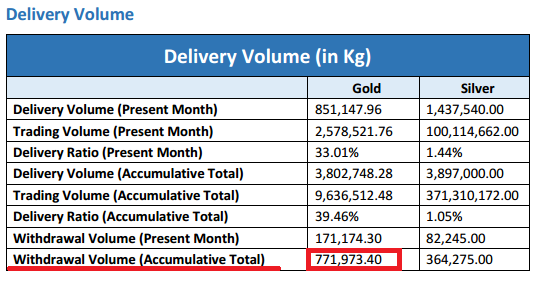
In BullionStar’s “An update on SGE Vault Withdrawals and SGE Price Premiums“, dated 17 May, it was noted that the SGE’s monthly ‘Data Highlights‘ report for the end of April 2017 stated that the Year-to-Date gold withdrawal total from the Exchange’s vaults was “771.9734 tonnes" which was “44.9 tonnes higher than the figure implied by the summation of the 4 individual months’ figures“. This was because the 4 individual months’ SGE gold withdrawal figures were 184.412 tonnes (January), 179.237 tonnes (February), 192.250 tonnes (March) and 171.174 tonnes (April), which total 727.073 tonnes.
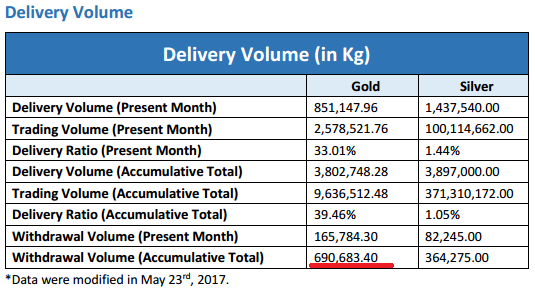
After calling for the SGE to clarify the discrepancy, less than a week later the SGE re-published modified data on 23 May, in which it revised downward the cumulative withdrawal total for the January – April period to 690.6834 tonnes, i.e. 81.29 tonnes less than the initial cumulative figure. Of this 81.29 tonnes discrepancy, 5.39 tonnes was a downward revision of the April gold withdrawal total from 171.1743 tonnes to 165.7843, another 44.9 tonnes was the above mentioned difference, and the final 31 tonnes was an extra downward revision to the SGE year-to-date withdraw figures.
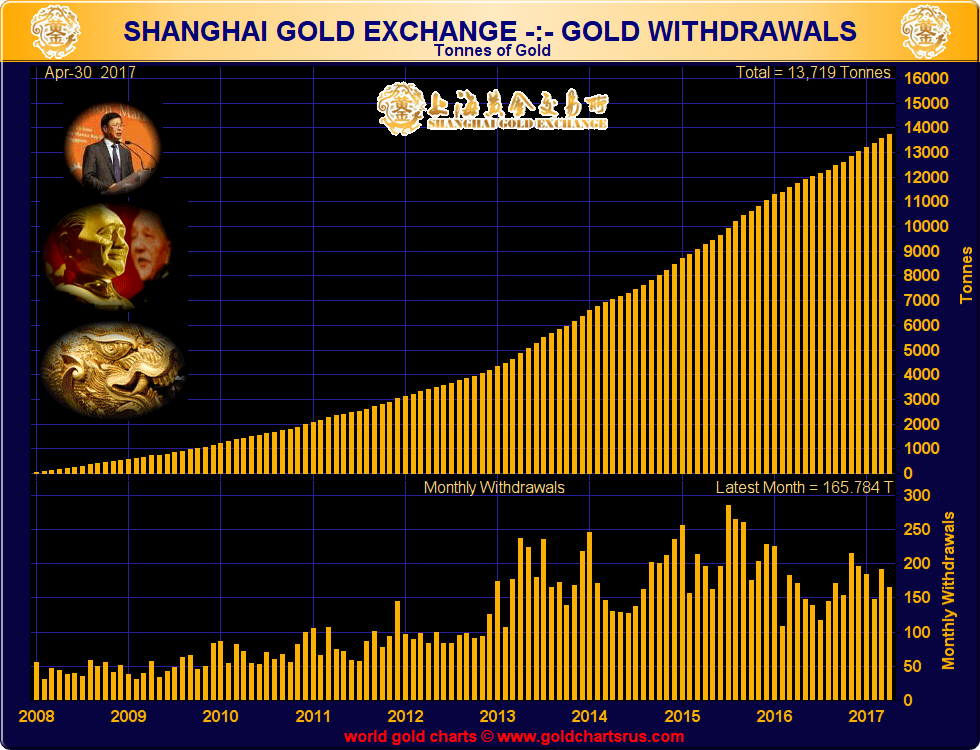
Therefore, based on a revised SGE gold withdrawal figure of 165.784 tonnes for April, the latest cumulative SGE gold withdrawal chart is as below.
Chinese and Indian Gold Demand (CHINDIA)
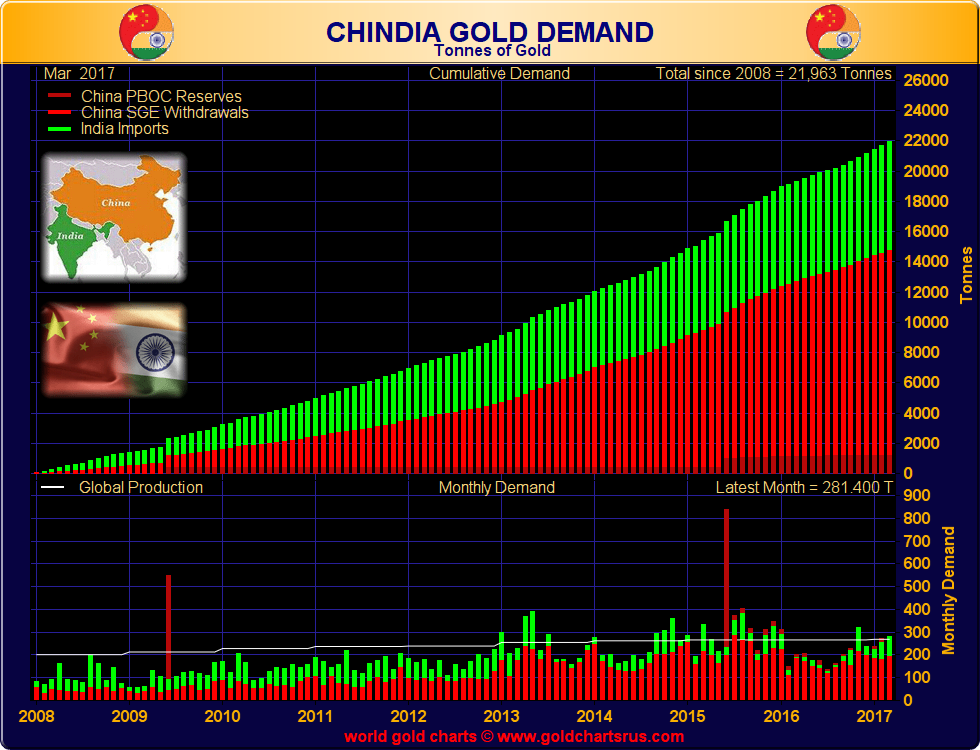
The ‘CHINDIA’ chart includes the 3 components of Shanghai Gold Exchange gold withdrawals, Chinese central bank official gold holdings, and gold imports into India. The calculation aims to capture total Chinese and Indian gold demand as far as possible. Indian gold import data is relatively slow in being released and has a two month lag, so the latest CHINDIA chart is dated end of March. For the month of March, SGE gold withdrawals added to Indian gold imports totalled 281.4 tonnes, which now brings the cumulative total for this calculation since the beginning of 2008 to 21,963 tonnes.
The People’s Bank of China (PBoC), China’s central bank, reported that its official gold reserves stood at 1842.6 tonnes (59.24 million ounces) as of the end of March, unchanged from the previous month. The PBoC also reported unchanged gold reserves at the end of April.
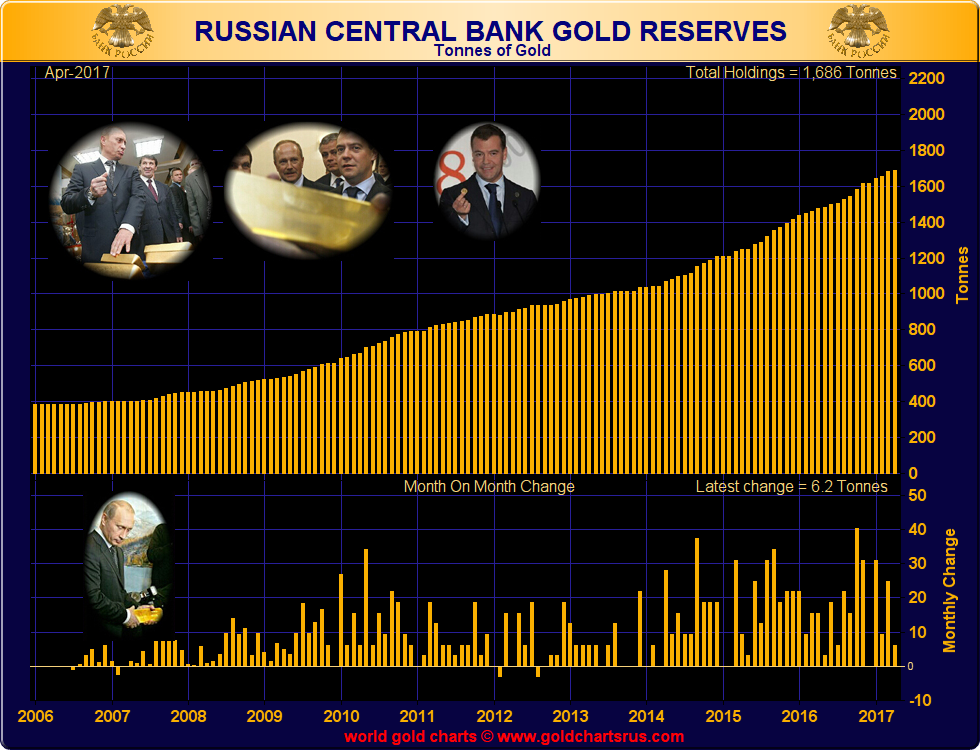
Official Russian Gold Reserves
The central bank of the Russian Federation, Bank of Russia, reported a relatively small increase in its official gold reserves during April, at 200,000 ozs or just 6.2 tonnes. This follows gold reserve accumulation of 65.3 tonnes during the first quarter of 2017.
Last month’s BullionStar gold chart commentary noted that 65.3 tonnes added during Q1 2017 would be 261 tonnes on an annualised basis but that:
“The Russians will probably not maintain this rate of gold accumulation for the entire year, and latter months could see smaller monthly purchases but would still come in with full year gold purchases in the 200 tonne range, similar to 2016 and 2015."
April therefore looks like one of these months of smaller monthly purchases, and is to be expected. For the 4 months to end of April, the Bank of Russia has now added 71.5 tonnes of gold to its reserves, which annualised is 214 tonnes, which is a lot closer to the assumed 200 tonne target. It will take an average monthly addition of just under 18 tonnes per month for the remainder of this year to achieve an accumulation of 200 tonnes for 2017, but expect some months of chunky large additions interspersed with other months of small additions, as was demonstrated in April.
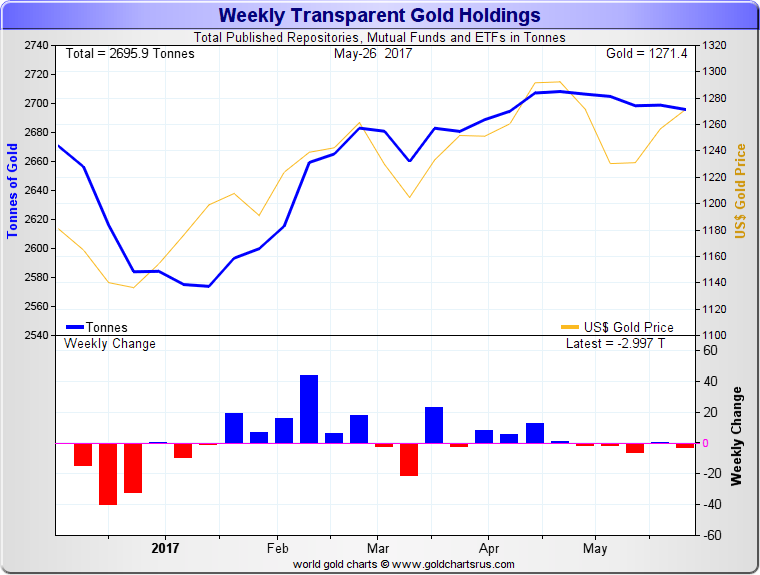
Transparent Gold Holdings – ETFs and Others
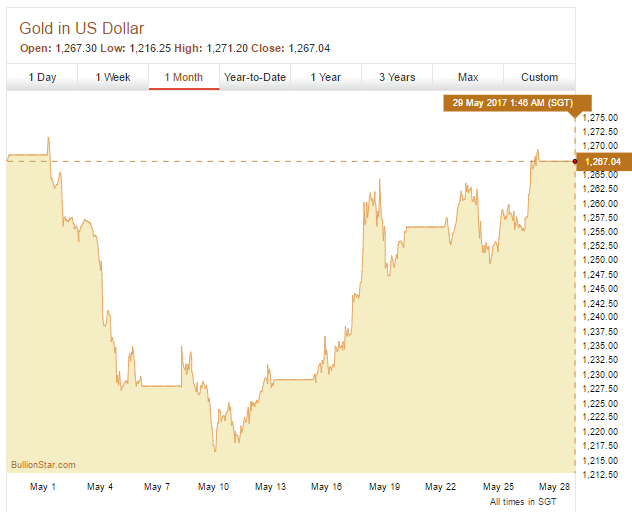
The US dollar gold price traded in a moribund and tight trading range of approximately $60 during May. The price began the month near the $1270 level before trending south mid-month to below $1220, after which it retraced the same range back up towards the $1270 level towards the end of the month.
Movements in physical gold holdings of the gold-backed Exchange Traded Funds (eg. SPDR Gold Trust) and similar vehicles were likewise lacklustre during May, with very small net changes to holdings over the course of the month. The funds and vehicles captured in the chart below held a combined 2696 tonnes of gold as of 26 May 2017.
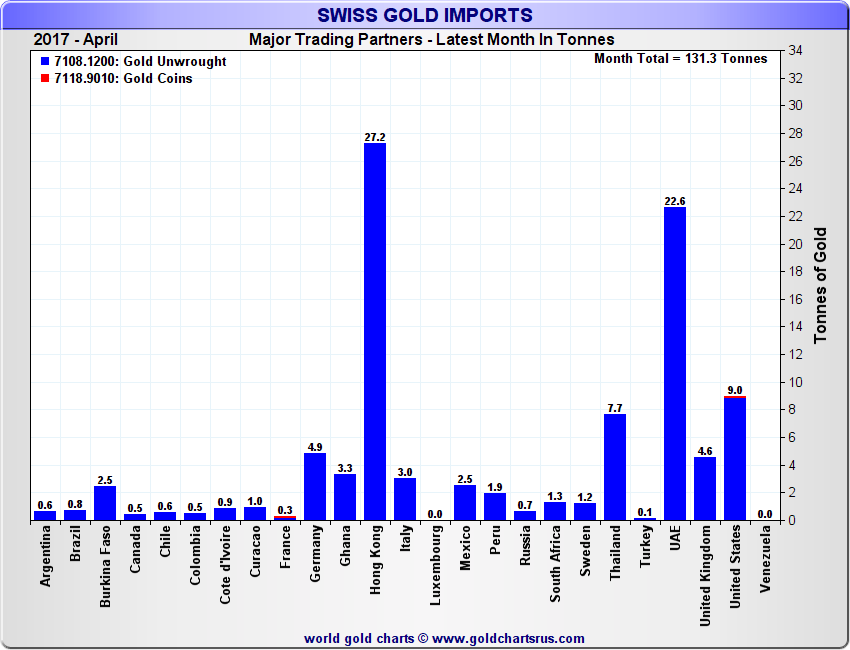
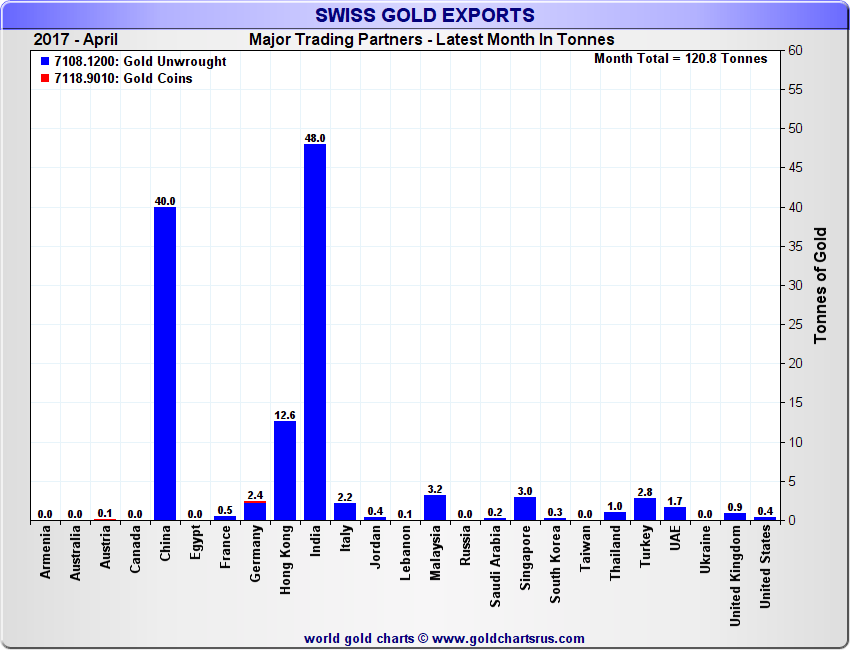
Swiss Gold Imports and Gold Exports
Swiss gold imports in April amounted to 131 tonnes, one of the lowest monthly gold import levels to Switzerland within the last 12 months. Likewise, Swiss gold exports in April, at 121 tonnes, were also one of the lowest monthly gold export quantities within the last year. While net gold imports into Switzerland remain positive for every month so far during 2017, the size of the monthly net position is dwindling and is now far smaller than in January and February.
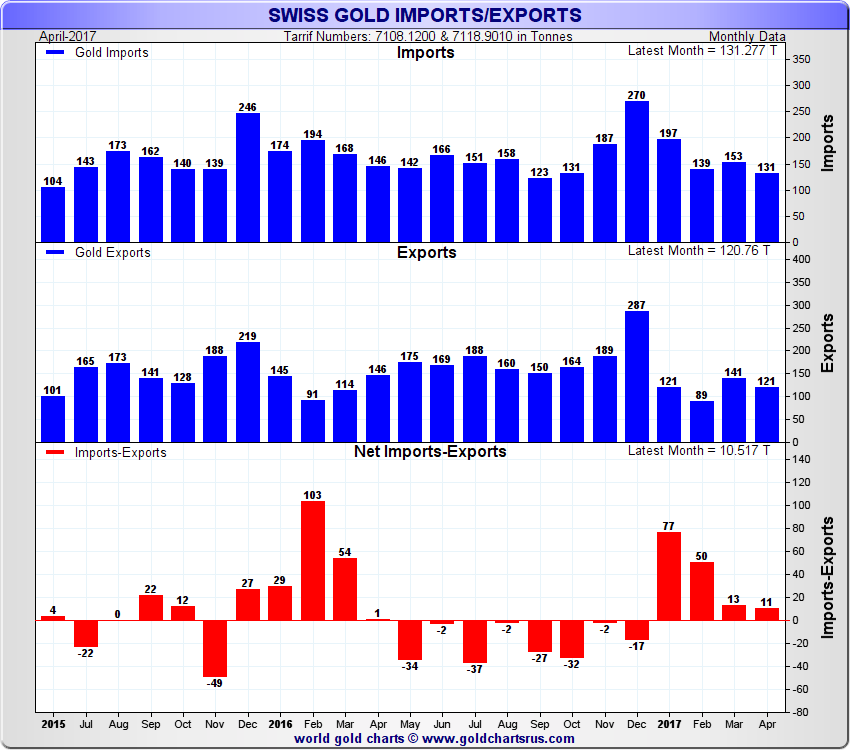
The largest suppliers of gold imported into Switzerland during April were Hong Kong, United Arab Emirates (Dubai), the US, and Thailand, respectively. Hong Kong (with 27.2 tonnes) and UAE (with 22.6 tonnes) together supplied 38% of Switzerland’s April gold inflows. The direction of these gold flows is notable, since markets such as Hong Kong, the UAE, and also Thailand (which sent 7.7 tonnes of gold to Switzerland during April), are historically recipients of gold from Switzerland, so these contra flows underline the dynamic nature of gold flows, some of which are likely to be in the form of recycled gold jewellery from these traditionally large gold jewellery markets returning to be re-refined in Switzerland.
Since February, Hong Kong and the UAE have consistently been among the top sources of non-monetary gold arriving into Switzerland.
The Indian gold market maintained its pole position in April as the largest export market for Swiss gold bars, receiving 48 tonnes of fine gold from the Swiss. In second place was China whose gold imports from Switzerland totalled 40 tonnes. Together, the world’s two biggest gold markets accounted for 73% of all Swiss non-monetary gold exports during April. Adding in Hong Kong, which was the recipient of 12.6 tonnes during the month, then these three markets accounted for 100.6 tonnes, or 83%, of all Swiss gold exports during April.
India has now been the largest recipient of Swiss gold every month this year, taking in a cumulative 167.2 tonnes from the Swiss refineries between January and April. In January, the Indian market imported 26.4 tonnes of gold from Switzerland, in February 37.2 tonnes, and in March 55.6 tonnes. These strong import flows to the Indian market suggest that the Indian gold sector and consumer demand are recovering following last year’s chaotic demonetization exercise (Modi’s currency ban).
On 1st July this year, a new nationwide harmonised Goods and Service Tax (GST) regime harmonised is being introduced by the Indian government. The GST rate applicable to gold has not yet been decided due to industry squabbling, with the decision on the rate for gold deferred until the 3 June meeting of the GST Council. Overall, the new GST rate will probably be slightly higher when compared to existing state and local excise duty, VAT and local ‘octroi’ taxes. The new effective rate may be in the 4% range and could have a slightly knock-on effect on Indian gold imports in H2 2017.
However, as with the recent de-monetization and re-monetization of cash in India, Indian consumers and the bullion and jewellery sectors are adept at adjusting quickly to the new reality, and Indian gold demand is generally resilient, especially during the October to December wedding season and during Diwali. Furthermore, even if official gold imports into India are negatively impacted due to GST, unofficial gold imports into India in the form of smuggling have a habit of filling the gap, since gold smuggling into India can be anything between 200 tonnes and 500 tonnes per year.
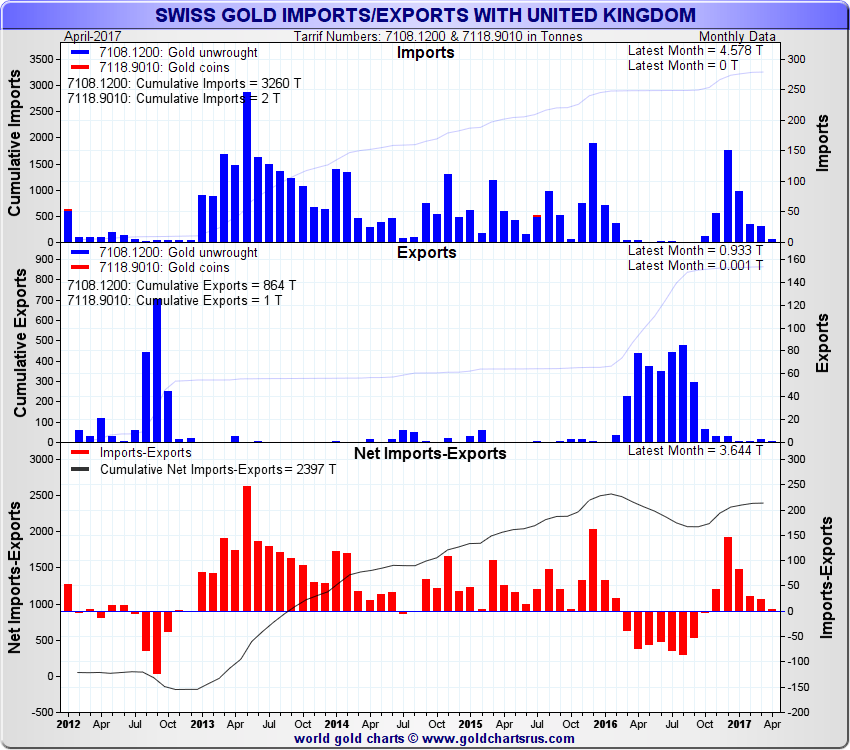
Swiss Gold Imports from London
From October 2016 to March 2017, London supplied a cumulative 325 tonnes of non-monetary gold (non central bank gold) to the Swiss gold sector. Of this total, 140 tonnes flowed into Switzerland during the first 3 months of 2017. However, in April, the UK (London) only sent a tiny 4.6 tonnes of gold to Switzerland.
This halt of the London gold vaults as gold suppliers to the Swiss market is notable, and is perhaps signalling that the London vaults no longer have the ability to service Swiss gold demand, which may suggest tight physical gold availability in London, or alternatively that the London vaults are attempting to maximise their gold bar holdings in advance of the London Bullion Market Association (LBMA) imminent move to begin reporting vault gold holdings levels of the commercial London vaults.
It is therefore worth watching the UK to Switzerland gold flow data in May, June and July when this data becomes available, as it will clarify if there is indeed a shortage of unspoken for gold bars in the London Gold Market.
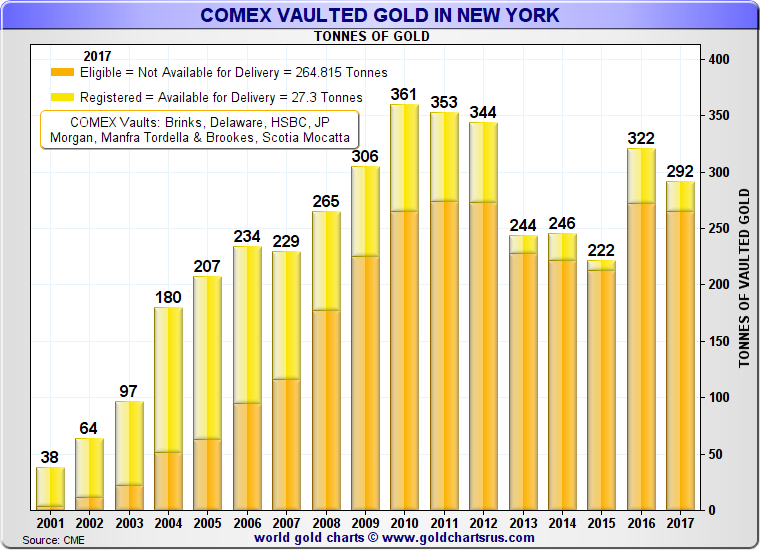
COMEX – Vaulted gold in New York COMEX vaults
Registered gold in COMEX approved New York City vaulting facilities that back US gold futures trading totalled 27.3 tonnes towards the end of May compared to 28.4 tonnes of Registered gold at the end of April. Another 264.815 tonnes of gold was reported to be in the Eligible category (this compares to 275.7 tonnes of gold in Eligible at the end of April).
Note that “Registered" gold is gold in the form of 100 ounce bars or 1 kilo bars for which a Warrant (Document of Title) has been issued by an approved precious metals vault facility in satisfaction of delivery of a gold futures contract. “Eligible" gold refers to all gold (excluding Registered gold) residing in a COMEX approved vault which is acceptable by the COMEX for delivery against gold futures contracts.
Popular Blog Posts by Gold Market Charts
 November 2018 Gold Market Charts
 May 2018 Gold Market Charts
 December 2017 Gold Market Charts
 November 2017 Gold Market Charts
 October 2017 Gold Market Charts
 September 2017 Gold Market Charts
 August 2017 Gold Market Charts
 July 2017 Gold Market Charts
 June 2017 Gold Market Charts
 May 2017 Gold Market Charts