
November 2017 Gold Market Charts

 Gold Market Charts
 5 Comments
BullionStar’s monthly ‘Gold Market Charts’ articles examine recent developments in the world’s largest physical gold markets using graphical gold charts created by the GOLD CHARTS R US market chart website. The physical gold markets covered include India, China, Russia and Switzerland and where relevant, the COMEX gold futures vault inventories.
Note additionally that BullionStar’s website also hosts gold and silver price charts under the BullionStar Charts menu, which also allows you to chart currencies, commodities, stock indices and Bitcoin in terms of gold and other precious metals.
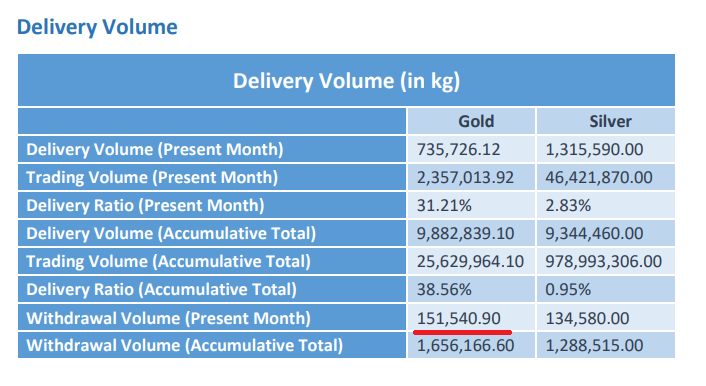
SGE Gold Withdrawals
Physical gold withdrawals from the vaults of the Shanghai Gold Exchange (SGE) during October 2017 reached 151.54 tonnes. SGE gold withdrawals are a suitable proxy for Chinese wholesale gold demand due to the fact that nearly all gold supply in the Chinese gold market makes its way through the SGE vaulting network to be traded on the SGE’s gold trading platform.
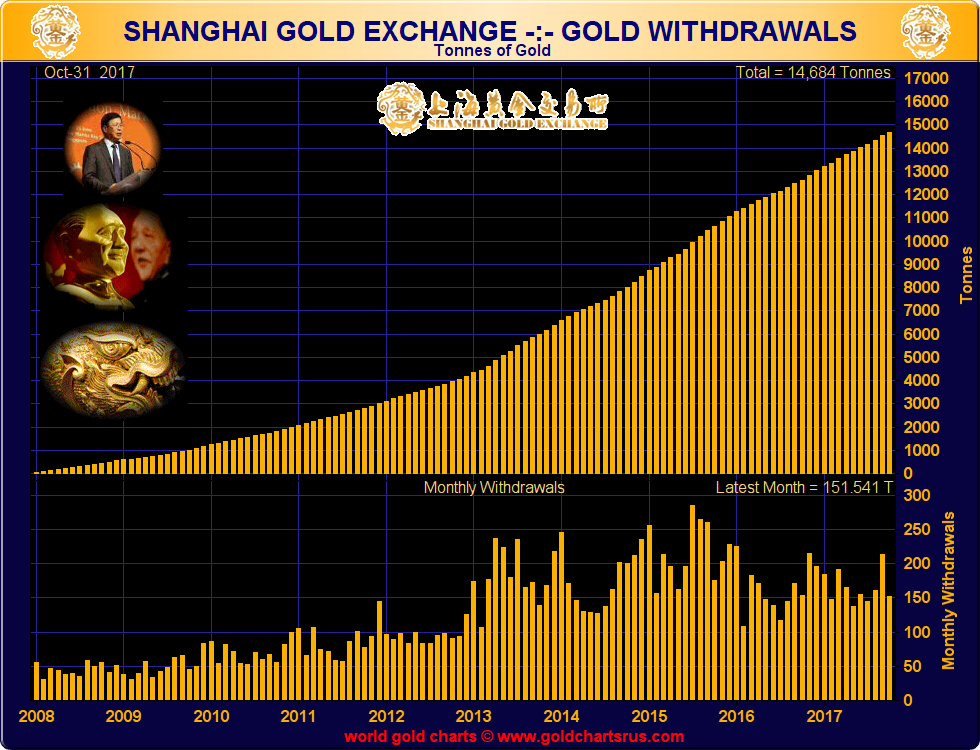
For the 10 months from January to October 2017 inclusive, cumulative gold withdrawals from the SGE have now reached 1656 tonnes. On an annualised basis, this would be 1987 tonnes, and would be the third highest year of SGE gold withdrawal activity on record.
Chinese and Indian Gold Demand (CHINDIA)
The regularly featured chart below of combined Chinese and Indian gold demand captures a gold demand estimate from the world’s two largest gold consuming nations. The methodology of the chart data takes the latest month’s SGE gold withdrawals as a proxy for Chinese wholesale gold demand, and to this figure adds total reported gold holdings of the Chinese central bank. This is because the People’s Bank of China sources gold from other supplies sources independent of the SGE. Since India sources nearly all of its gold demand from abroad, net gold imports (imports – exports) into India are used as a proxy for total Indian gold demand.
For the month of September, CHINDIA gold demand is estimated to have been 253.1 tonnes. This comprised 214.24 tonnes of Chinese wholesale gold demand (SGE gold withdrawals), and 38.8 tonnes from net official gold imports into India.
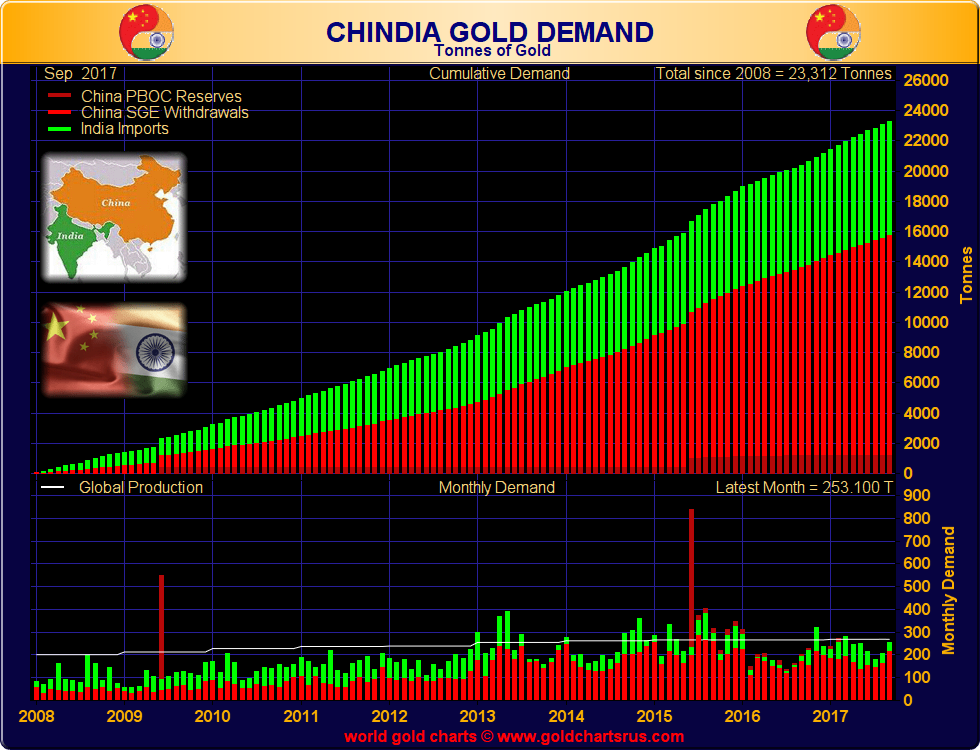
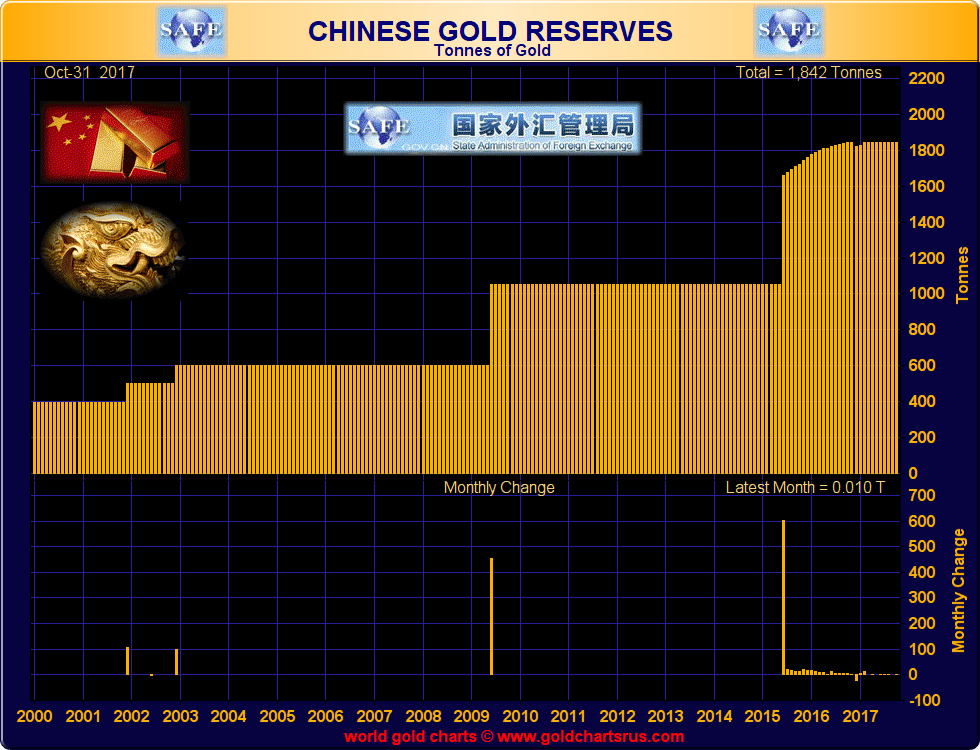
For September 2017, there was zero contribution to CHINDIA gold demand from the Chinese central bank demand. This is because since October 2016, the Chinese authorities have not reported any changes to their official gold reserves, and Chinese state gold reserves remain (at least according to the official data) at 1842 tonnes. The following chart of monthly changes to official Chinese state gold holdings illustrates this lack of change in Chinese gold holdings since October 2016.
Russian Gold Reserves
During October 2017, the Russian Federation through the Bank of Russia added 21.8 tonnes to its official gold reserves. This addition brought the total gold reserves of the Russian central bank to 1801 tonnes. On a year-to-date basis, the Russians have officially added 186 tonnes to their gold reserves and are on target to add a total of about 200 tonnes of gold to Russian central bank reserves during 2017.
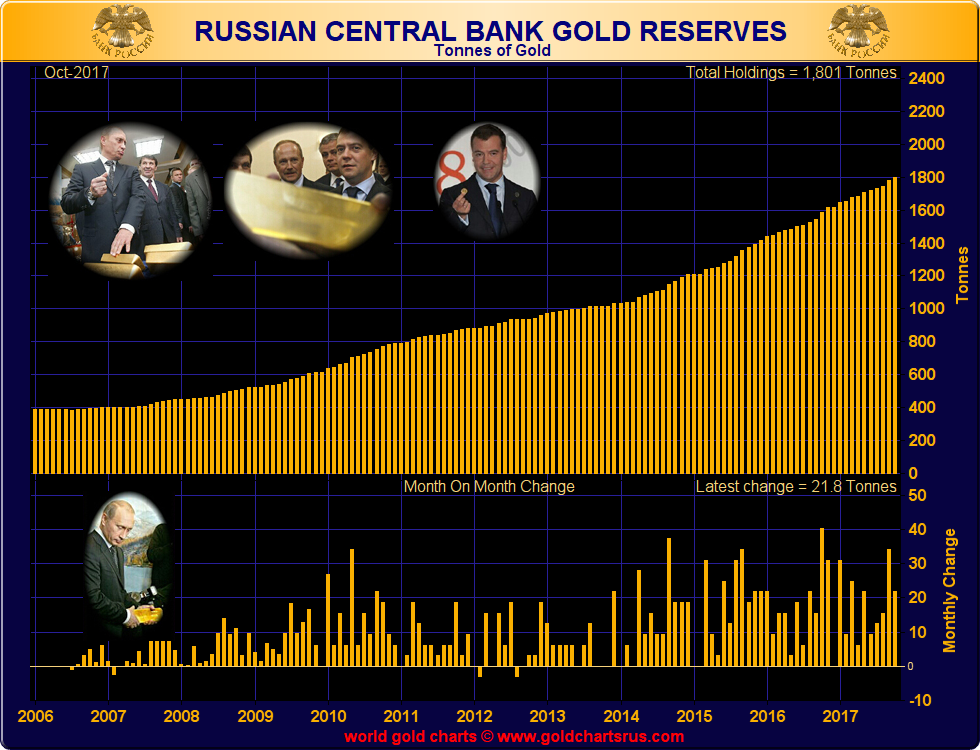
At 1801 tonnes, the Bank of Russia’s gold reserves are now nearly on a par with those of the Chinese central bank (which holds 1842 tonnes). See recent BullionStar article “Neck and Neck: Russian and Chinese Official Gold Reserves" for full details of the nearly identical size of current official Russian and Chinese gold reserves.
The nature of Russian and Chinese central bank gold figures could give the impression that these 2 central banks are competitors in the gold market. However, the reality is that they should be seen more so as collaborators due to the fact that Russia and China, along with other BRIC nations, are now actively cooperating on a joint trading system to link their gold markets. See recent BullionStar blog “Russia, China and BRICS: A New Gold Trading Network" for full details.
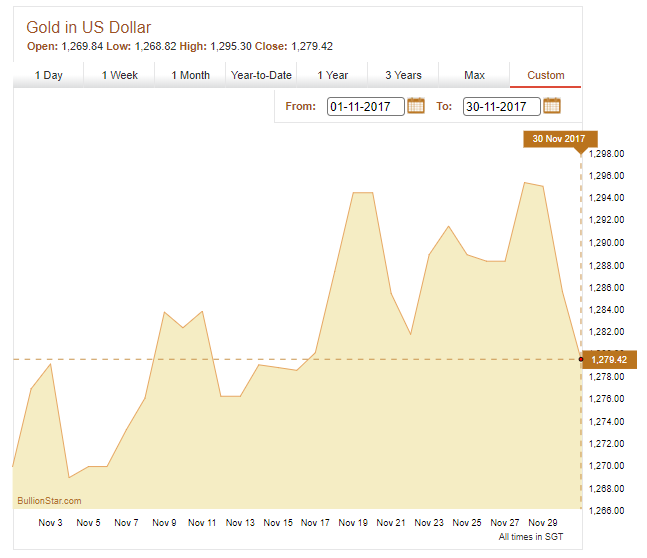
Transparent Gold Holdings and Gold Price
The gold price in US Dollars continued to trade in a very tight trading range during November, fluctuating within the US$ 1270 and US$ 1290 range. The price trend was generally upwards as the month progressed, with the price approaching the US$ 1300 level a number of times, but not being able to breach this zone.
The US Dollar gold price finished the month at the US$ 1280 level. It remains to be seen whether the US$ 1300 range can be successfully surpassed for any length of period during the remainder of the year.
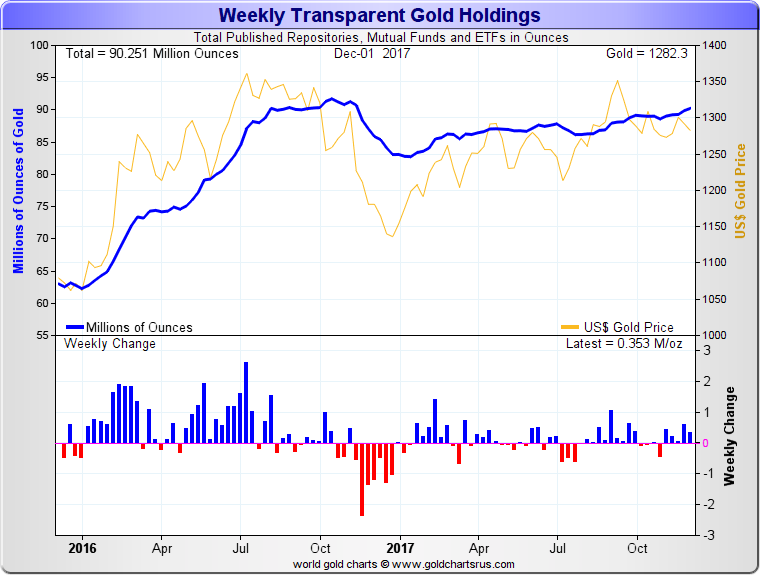
The last few weeks have seen net inflows of gold into the group of transparent gold products and platforms that publish their gold holdings on a regular basis. This group includes gold-backed ETFs and similar products, as well as the vault inventories of futures exchanges which trade gold futures.
As of 01 December, the group of platforms, vehicles and exchanges captured by the below chart held a combined 90.25 million ounces of gold, or 1282.3 tonnes.
Swiss Gold Imports and Exports
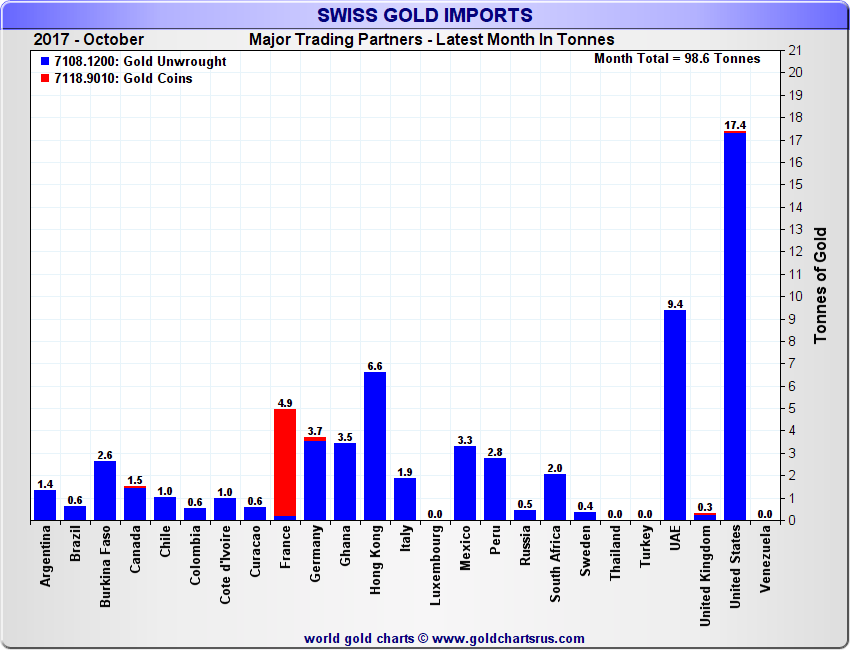
According to data from Swiss Federal Customs, Switzerland imported 99 tonnes of non-monetary gold during October, and exported 140 tonnes of non-monetary gold. This resulted in a net outflow of 41 tonnes of non-monetary gold. Monetary gold is gold that is classified as central bank gold. Monetary gold is exempt from trade reporting when it moves across borders. Non-monetary gold is any gold that is not classified as monetary gold.
October’s Swiss gold import figure was the lowest of the year-to-date, and also lower than any month in 2016.
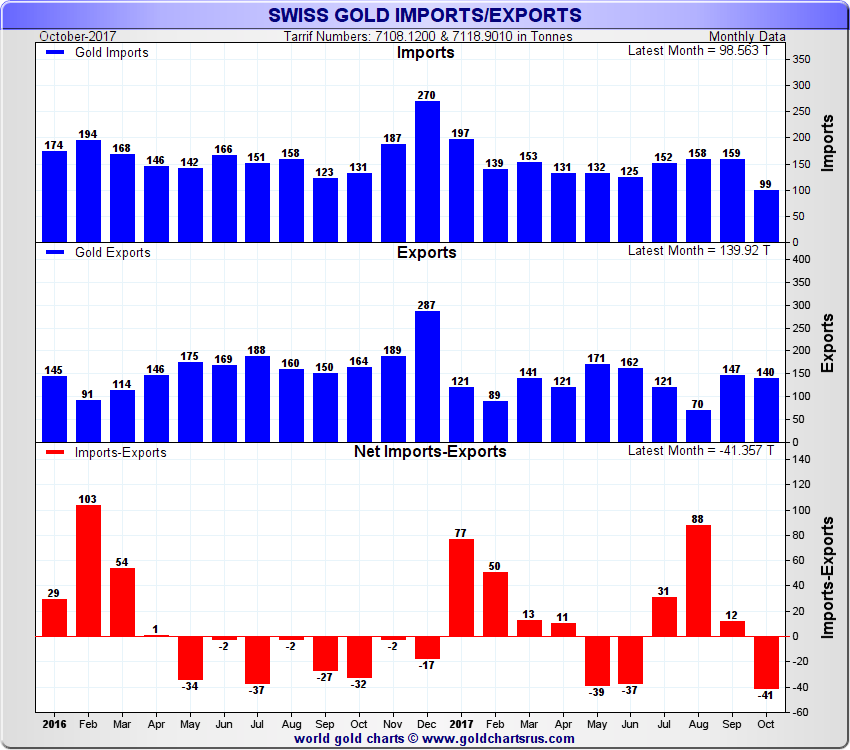
The US, Dubai and Hong Kong accounted for the largest import sources of gold flowing into Switzerland during October. Interestingly, October also saw nearly 5 tonnes of gold coins being sent across the border from France to Switzerland. This trend of gold coins flowing from France to Switzerland also showed up in Switzerland’s gold import statistics during September. Where exactly these coins are originating from is unclear.
On the export side, of the 140 tonnes of non-monetary gold that were exported from Switzerland during October, a combined 66% of this total went to India, China and Hong, with India taking in 38 tonnes, China receiving 34.6 tonnes, and Hong Kong taking in 19.5 tonnes. In fourth place was the UK (more correctly the London Gold Market) which received 9.5 tonnes of gold from the Swiss during the month.
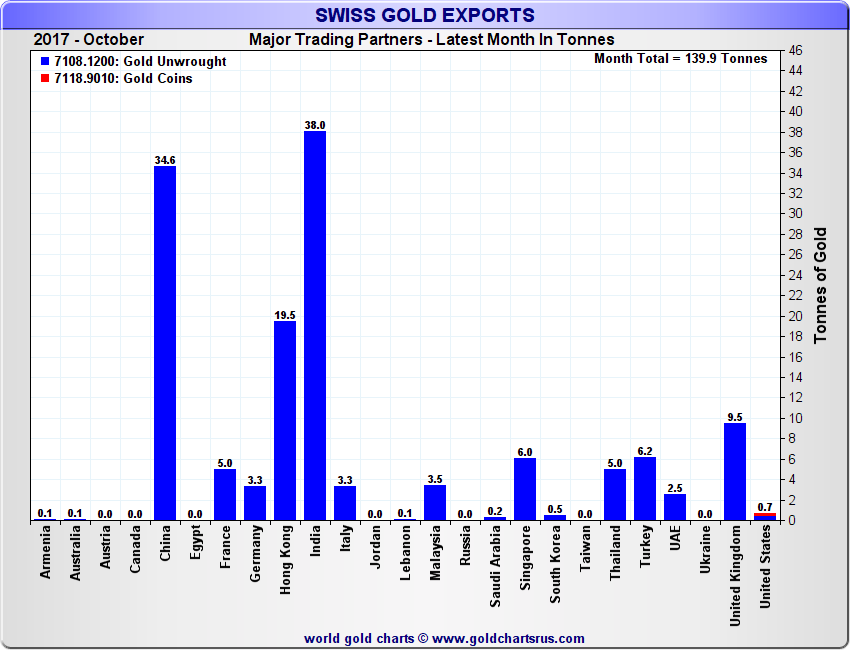
Swiss Gold Exports by top source countries, Month of October 2017, Source:www.GoldChartsRUs.com
COMEX Vault Inventories
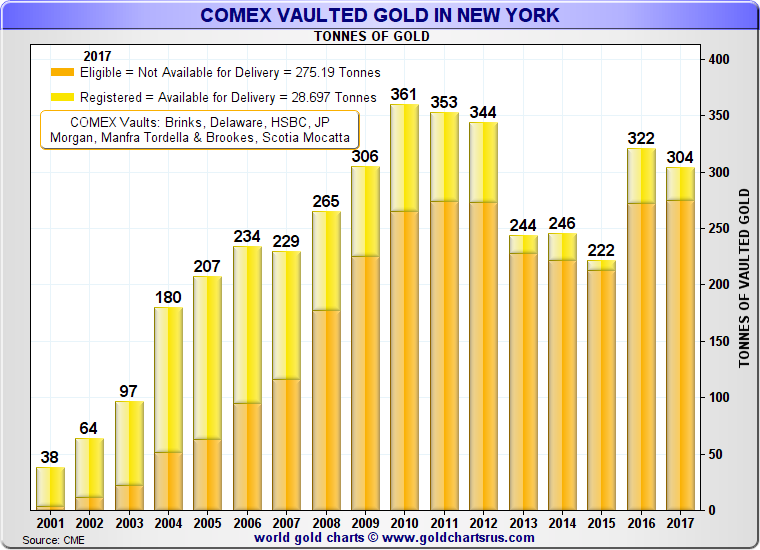
Currently, there are approximately 29 tonnes of gold classified as ‘Registered’ residing in the COMEX approved gold vaults in New York, and 275 tonnes classified as ‘Eligible’ in the same group of vaults.
Registered gold is gold held in COMEX approved vaults for which warrants of title have been issued against COMEX gold futures contracts. Eligible gold is gold acceptable by the COMEX for delivery against the Exchange’s gold futures contracts but for which warrants have not been issued. This eligible gold could be owned by anyone and is not connected to COMEX trading at the point in time that its classified as eligible. Note that the acceptable forms of gold bars for physical settlement of the COMEX 100 oz gold futures contract are gold kilobars and 100 oz gold bars.
Popular Blog Posts by Gold Market Charts
 November 2018 Gold Market Charts
 May 2018 Gold Market Charts
 December 2017 Gold Market Charts
 November 2017 Gold Market Charts
 October 2017 Gold Market Charts
 September 2017 Gold Market Charts
 August 2017 Gold Market Charts
 July 2017 Gold Market Charts
 June 2017 Gold Market Charts
 May 2017 Gold Market Charts