
November 2018 Gold Market Charts

 Gold Market Charts
 12 Comments
BullionStar’s series of ‘Gold Market Charts’ articles look at recent developments in the world’s largest physical gold markets using illustrative gold market charts generated by the unique and insightful GoldChartsRUs.com gold market chart website. Physical gold markets covered include China, India, Russia, Switzerland, and of course, the London Gold Market.
BullionStar’s website also has a full range of charts under the ‘Charts‘ dropdown menu on BullionStar’s new website, which allow you to create the latest charts of everything from currencies, to commodities, to stock indices to crytpocurrencies in terms of gold and other precious metals.
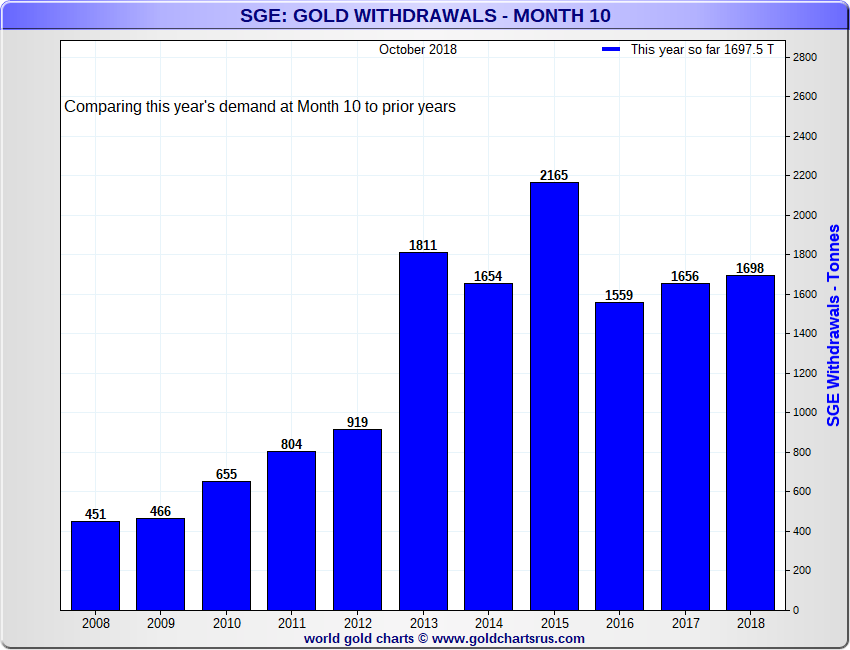
SGE Gold Withdrawals
As well as being the world’s largest physical gold market, China is also the world’s largest importer of gold and the world’s number one producer of gold (mining output). Importantly, nearly all of this mined gold and imported gold, as well as recycled scrap gold, enters the nationwide vaults of the Shanghai Gold Exchange (SGE) for trading on the SGE.
As such, physical gold withdrawals from the vaults of the SGE are a good proxy for wholesale gold demand in the Chinese market, and more generally a good indication of the general health of the mainland China gold market. In simple terms:
Physical Gold Supply to the SGE = SGE Withdrawals = Chinese Wholesale Gold Demand
See here for an explanation of the Mechanic of the Chinese Gold Market.
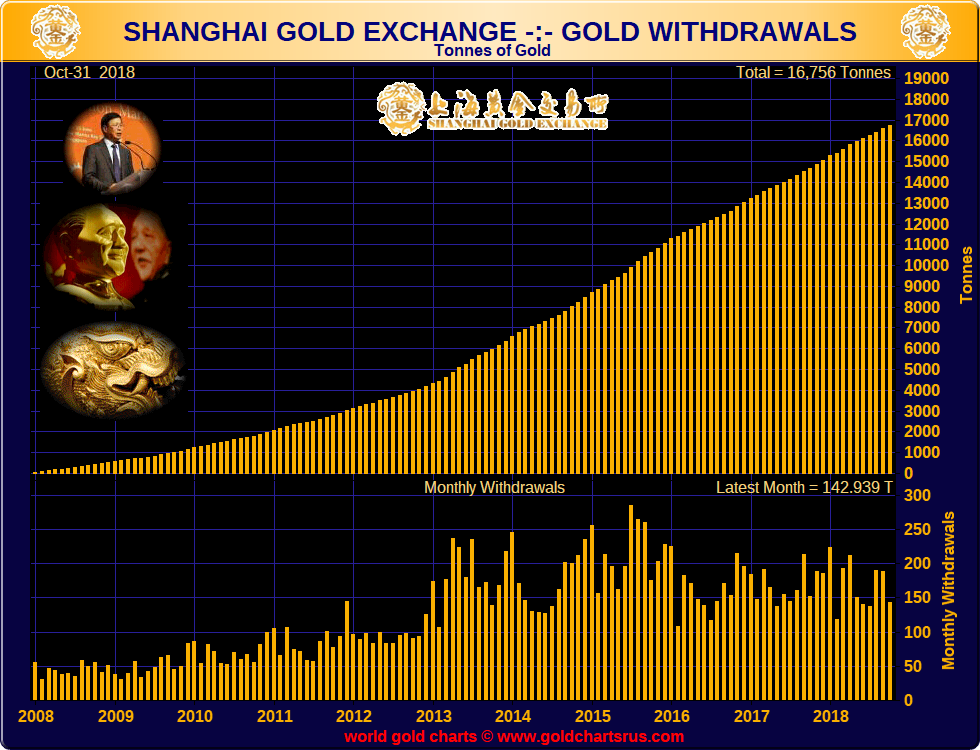
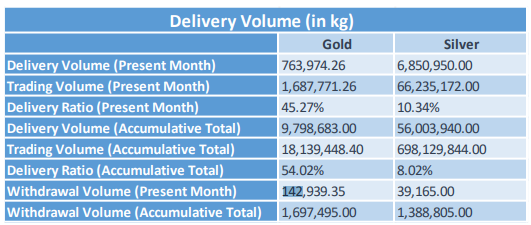
During October 2018, physical good demand from the vaults of the SGE totalled 143 tonnes. Year-to-date, from January to October, gold withdrawals from the SGE now total 1698 tonnes. As things stand, this would put 2018 as the third highest gold demand year on record for the Chinese gold market, just behind 2013 and 2015.
Full year SGE gold withdrawals for 2018 (including November and December) should now come in just above 2000 tonnes, which means that the Chinese gold market is currently absorbing the equivalent of about two thirds of annual global gold mining output, an incredible statistic.
Note also that SGE gold withdrawals do not reflect direct purchases of gold by the Chinese central bank, as the PBoC (central bank) does not buy gold on the Shanghai Gold Exchange but sources its gold in other ways such as from purchases on the international gold market, including in London.
Russian Federation Gold Reserves
The Russian Federation through the Federation’s central bank, the Bank of Russia, added 28 tonnes to its gold reserves during October, and now officially reports to be holding 2065 tonnes of monetary in its strategic gold reserves.
So far during 2018, the Bank of Russia has added 227 tonnes of gold to its reserves. For the full year 2017, the Bank of Russia purchased 223 tonnes of gold, so already by the end of October, the central bank has accumulated more gold this year than it did during the whole of last year. Assuming significant purchases over the November to December period, Russia now looks to be on course to accumulate over 250 tonnes of gold this year, which would be a record year for Russian state gold purchases, and signifies an upward shift in Russian state gold accumulation compared to its previous buying trajectory.
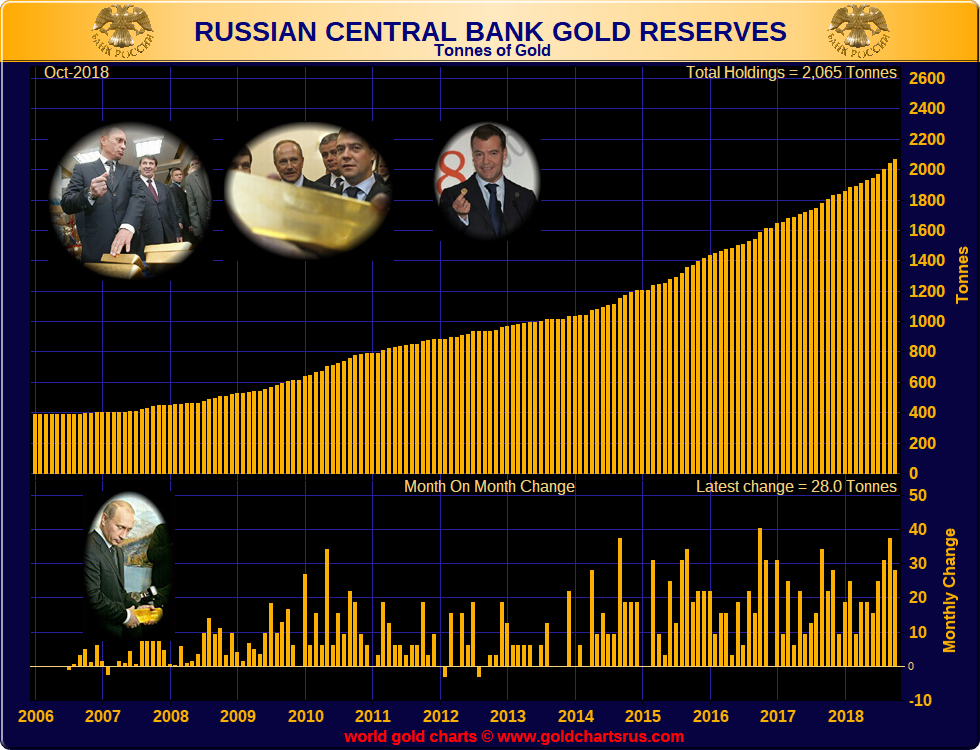
Russia is arguably unique in that it sources its monetary gold reserves from domestic gold production through a system in which the large Russian commercial banks intermediate between the Russian gold mining companies and the Bank of Russia. Therefore, most Russian gold production ends up in the State gold vaults.
To illustrate this point, recent data from the Russian finance ministry confirms that Russia produced 231.65 tonnes of gold in the first nine months of the year. This means, that at its current purchase rate, the Russian central bank is now buying about 86% of all Russian gold mining output.
Swiss Gold Imports and Exports
According to the latest gold trade data from Swiss customs, Switzerland imported 171 tonnes of non-monetary gold during October and exported 115 tonnes, for a net import of 56 tonnes. Non-monetary gold is any gold that is not central bank gold. This gold shows up in Swiss customs data. Central bank gold is exempt from cross-border trade reporting, not just in Switzerland but globally, so it never shows up in customs data anywhere.
Looking at the following chart, Switzerland has continued to import more gold than it has exported for four months now, importing a net 153 tonnes of gold since July.
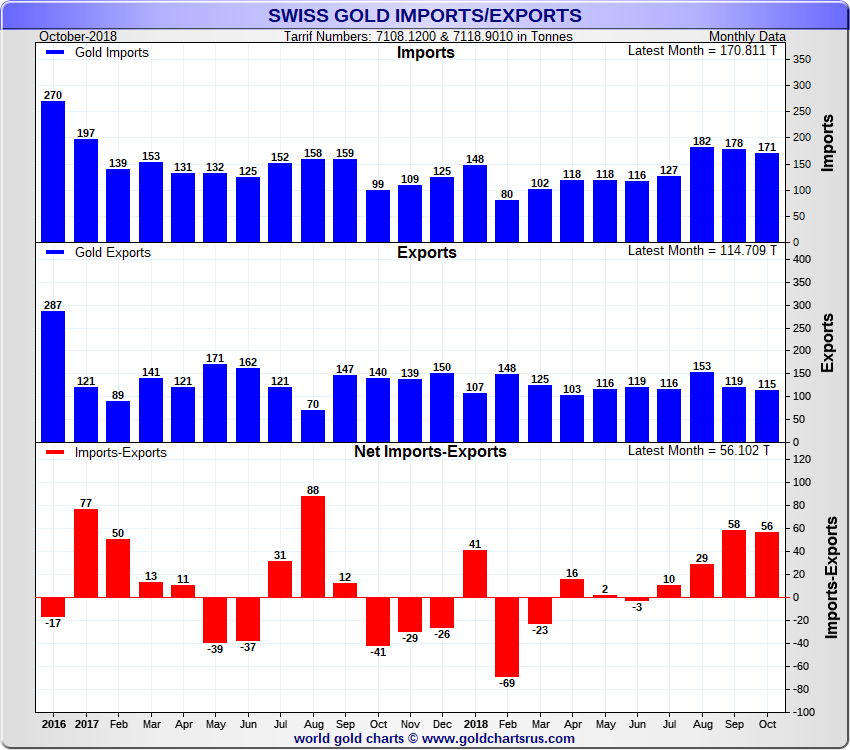
This trend could have a number of explanations such as Swiss gold refineries building up their inventories, Swiss banks bringing in gold to Switzerland for investment storage or a combination of the two. Another possibility is that some gold is being imported as non-central bank gold but it then reclassified as central bank (monetary gold), and re-exported. These exports would not show up in trade statistics.
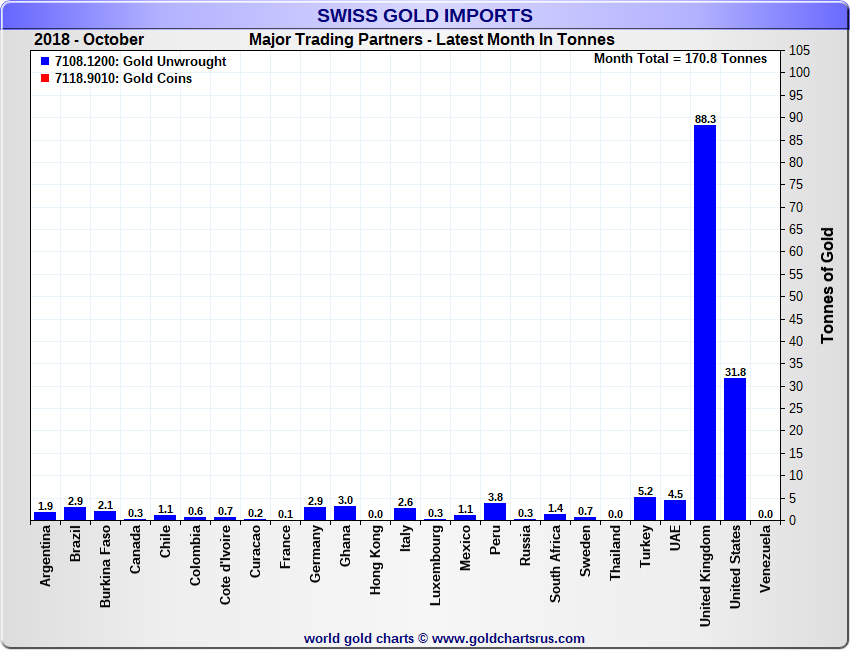
In October, Switzerland sourced over half gold imports from the London gold market, importing 88.3 tonnes from London. The second largest source was the United States, from which Switzerland imported 31.8 tonnes, or another 19%. Together, the Swiss tapped London and the US for over 70% of the gold that they brought in over the month.
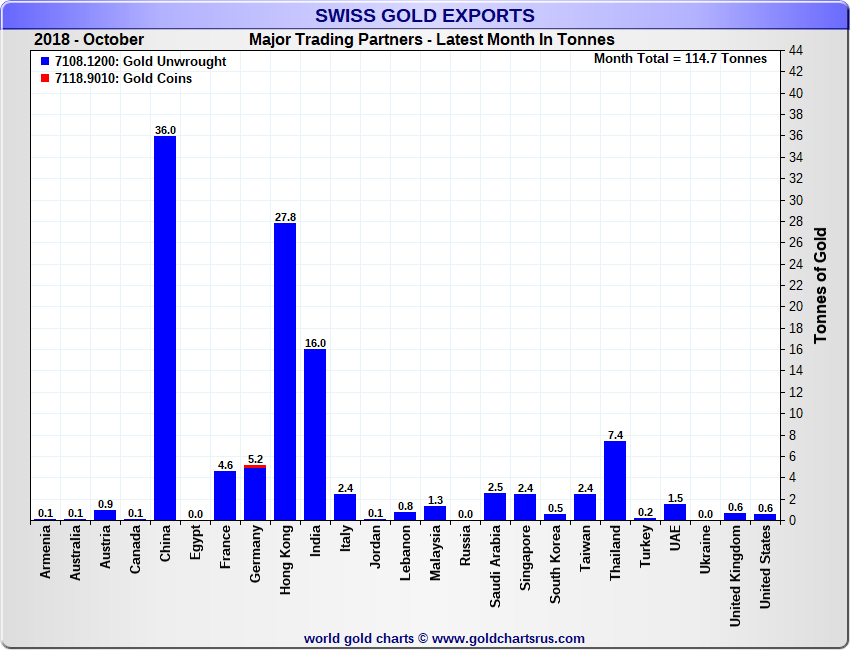
On the export side, the top four for destinations for Swiss gold exports in October were China mainland, Hong Kong, India, and Thailand which together accounted for 87.2 tonnes or 76% of all gold exports from the world’s largest gold refining hub, Switzerland.
This continual flow of physical gold from West to East is astounding and is probably the single most important trend to watch in the global physical gold market.
London Gold Vault Holdings and Gold Exports
Back in August 2017, the London Bullion Market Association (LBMA) began publishing monthly data showing the total amount of physical gold (in gold bar form) held in the set of precious metals vaults which comprises the LBMA system in London, England. This data covers the commercial vaults in London run by banks and security operators such as JP Morgan, HSBC, Brinks and Malca Amit and the gold held in the Bank of England’s vaults in London.
A few months earlier in 2017, the Bank of England had itself began to report vault holdings data on the amount of gold held just within the Bank of England vaults. Both sets of data are now published each month on a three month lagged basis. With data published by both the Bank of England and the LBMA, its possible to split out how much physical gold is claimed to be in the LBMA commercial vaults versus how much gold is claimed to be in the Bank of England vaults. However, in neither case are there any published gold bar audits to verify these claims, so for the purposes of analysis, we will have to assume that the figures are as the LBMA and Bank of England claim.
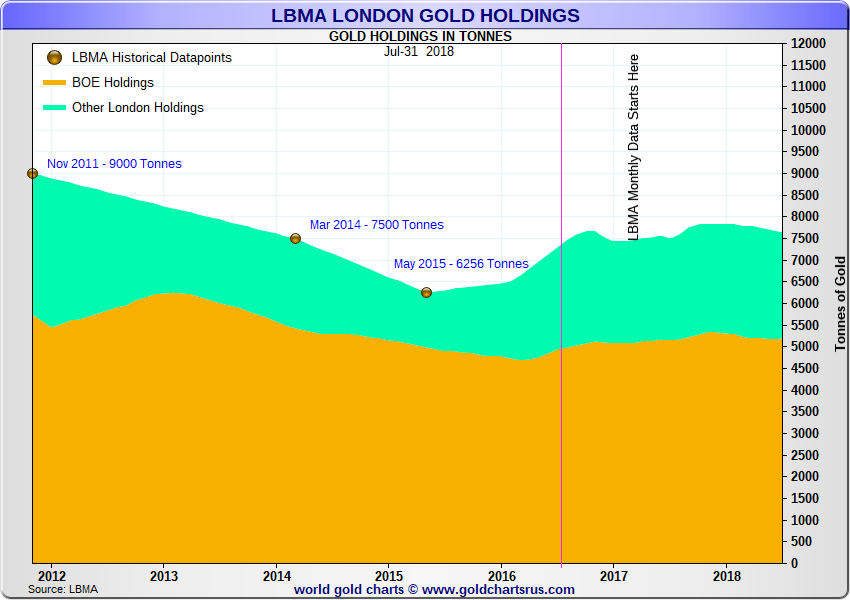
Looking at the latest data, which covers up until the end of July 2018, the LBMA data, which covers the London gold vaults including the Bank of England vaults, are reported to have held a combined 7,632 tonnes of gold. Of this amount, 5,186 tonnes of gold were claimed to be held in the Bank of England vaults, the orange shaded area in the chart above. The remainder, represented by the green shaded area in the chart above, and totaling 2,446 tonnes, is the amount of gold claimed to be held in the seven LBMA commercial vault operators in London.
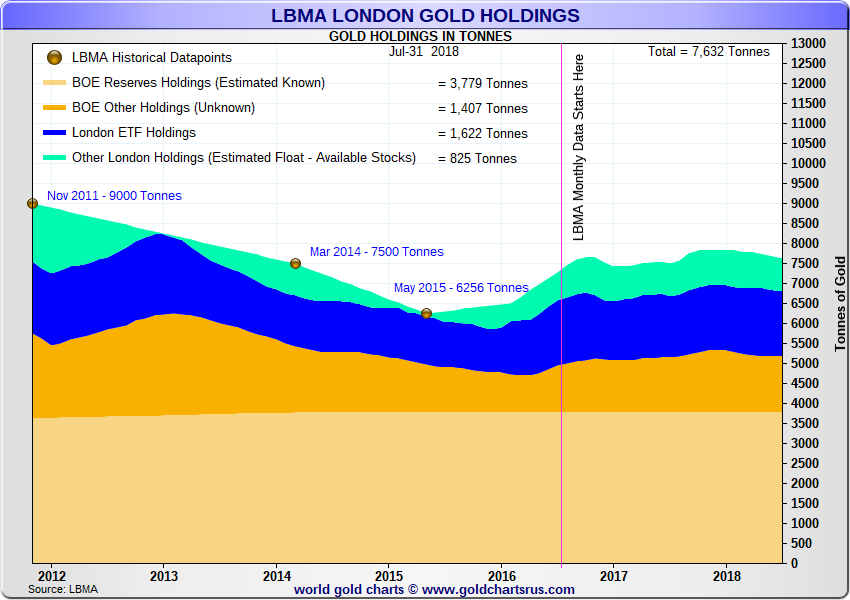
But importantly, a majority of the gold in the LBMA commercial vaults in London is allocated to gold-backed Exchange Traded Funds (ETFs) that store their gold in London, so this gold cannot be used by the ‘London Gold Market’ for other purposes, and this gold is not owned by bullion banks.
Looking at the data, on the same date, 30 July, when the London gold vault holdings excluding Bank of England vault holdings were 2,446 tonnes (i.e. 7,632 tonnes – 5,186 tonnes), there were 1622 tonnes of gold held in London by these ETFs (see dark blue shaded area in chart above). Excluding this 1622 tonnes, that left only 824 tonnes of gold held in the London LBMA vaults (excluding Bank of England vaults). Note, that this 824 tonnes of gold is less than the daily average traded volume of gold in London, which was 939 tonnes of gold equivalent according to recently released LBMA trade volume data.
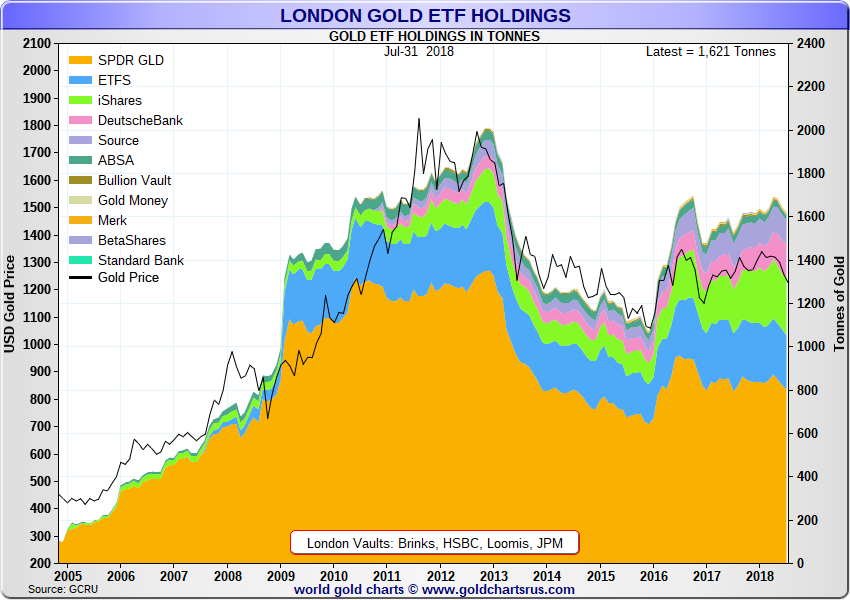
The 1622 tonnes of ETF held gold (rounded to 1621 in the above chart) was held mainly by gold-backed ETFs operated by five ETF providers, namely the SPDR Gold Trust, ETFS, Source, iShares, and Deutsche Bank (i.e. the five main shaded sections of the above chart).
With only 824 tonnes of gold held in London that was not ETF gold and that was not gold vaulted at the Bank of England, it is revealing to compare this to the large amounts of gold that have been exported from London during 2018.
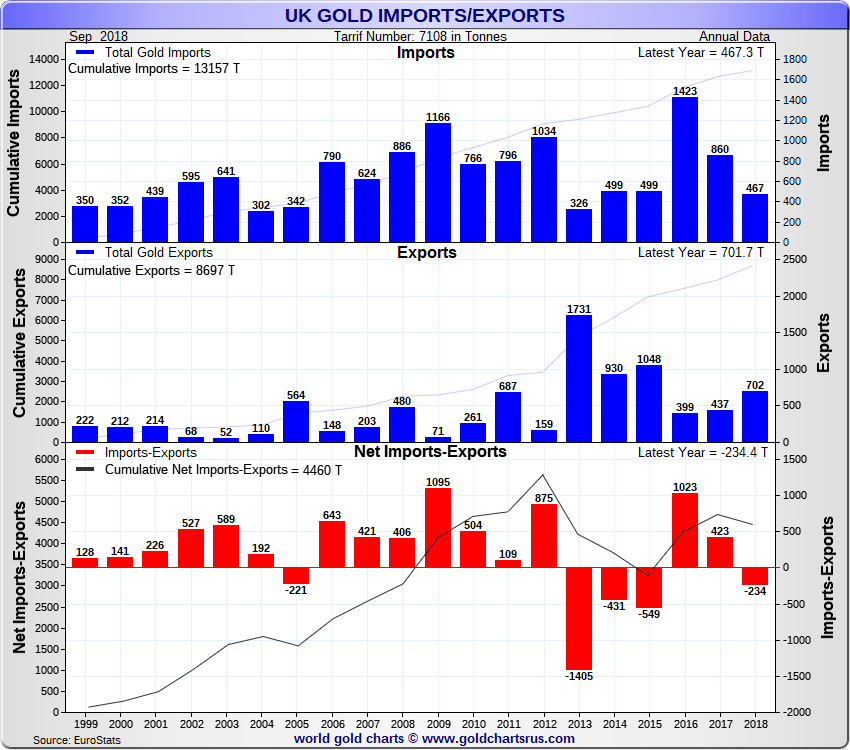
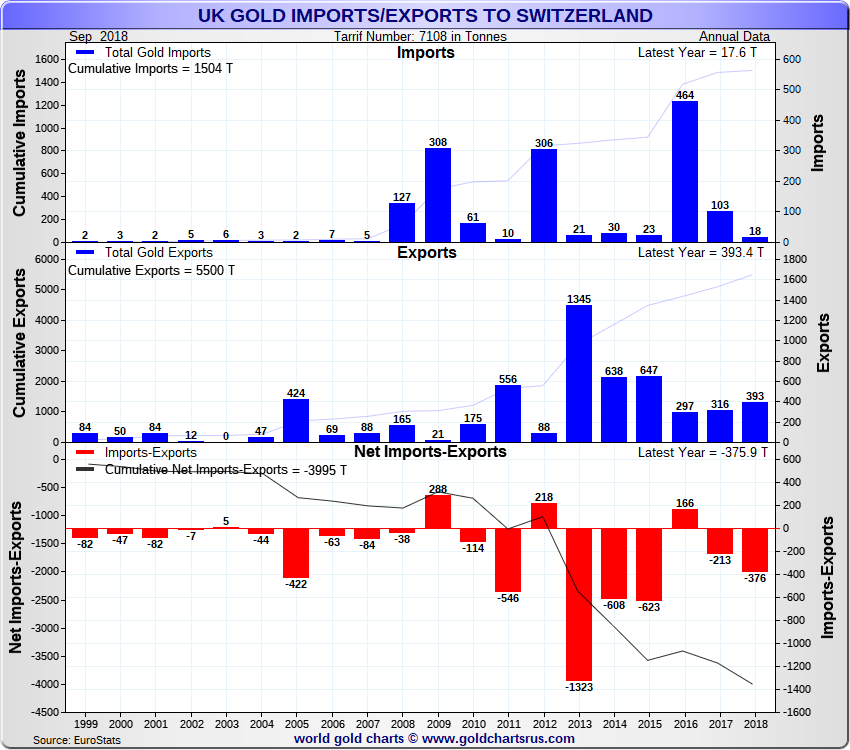
Looking at the above chart of UK gold imports / exports, it can be seen that for the year to the end of September 2018, the UK imported 467 tonnes of gold and exported a much larger 702 tonnes of gold, for net exports of 234 tonnes of gold. Of this 702 tonnes of gold exported from the UK in the nine months to the end of September 2018, a majority, i.e. 393 tonnes (56% of the total) was exported to Switzerland, the home of the world’s largest gold refineries.
The 234 tonnes of net gold exports from the UK for the nine months to end of September, when annualised would be 312 tonnes, a significant amount, which looks to make 2018 a year in which there is a drain on the gold holdings of London, from gold inventories which cannot be much more than about 800 tonnes (taking he 824 tonnes in the London gold vaults at the end of July as a proxy).
With the equivalent of more than 900 tonnes of gold traded on a daily basis in the London market, based on the newly published LBMA trade data, then it can be seen that what passes for gold trading in London is, in the majority, nothing more than unallocated, fractionally-backed, speculative trading on the gold price that has very little to do with physical gold movements in and out of London.
Popular Blog Posts by Gold Market Charts
 November 2018 Gold Market Charts
 May 2018 Gold Market Charts
 December 2017 Gold Market Charts
 November 2017 Gold Market Charts
 October 2017 Gold Market Charts
 September 2017 Gold Market Charts
 August 2017 Gold Market Charts
 July 2017 Gold Market Charts
 June 2017 Gold Market Charts
 May 2017 Gold Market Charts