
September 2017 Gold Market Charts

 Gold Market Charts
 1 Comments
Featuring charts produced by the GOLD CHARTS R US market chart website, the BullionStar chart series focuses on a number of the world’s most important physical gold markets including China, Russia, India, Switzerland and the London gold market, and provides background and commentary on the selected charts.
Shanghai Gold Exchange (SGE) Gold Withdrawals
Gold withdrawals from the Shanghai Gold Exchange network of precious metals vaults totalled 161.4 tonnes during August. These withdrawals are in the form of actual physical gold bars and ingots which leave the Exchange’s vaults and enter the downstream investment, jewellery and fabrication markets. Since most gold flowing through the Chinese gold market from the supply side to the demand side is traded through the SGE, this makes SGE Gold Withdrawals a suitable proxy for wholesale gold demand in China. See “Mechanics of the Chinese Domestic Gold Market" for more details.
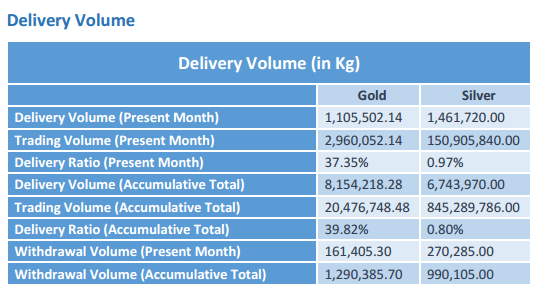
On a year-to-date basis for the first 8 months of 2017, total gold withdrawals from the Shanghai Gold Exchange are running at a cumulative 1290 tonnes of gold. This makes 2017’s year-to-August gold withdrawals the SGE’s 3rd highest year-to-date gold withdrawal total ever, somewhat less than 2013 and 2015, but on a par with 2014 and 2016. On a annualised basis, full year 2017 SGE gold withdrawals look like they will exceed 1900 tonnes.

Chinese and Indian Gold Demand (CHINDIA)
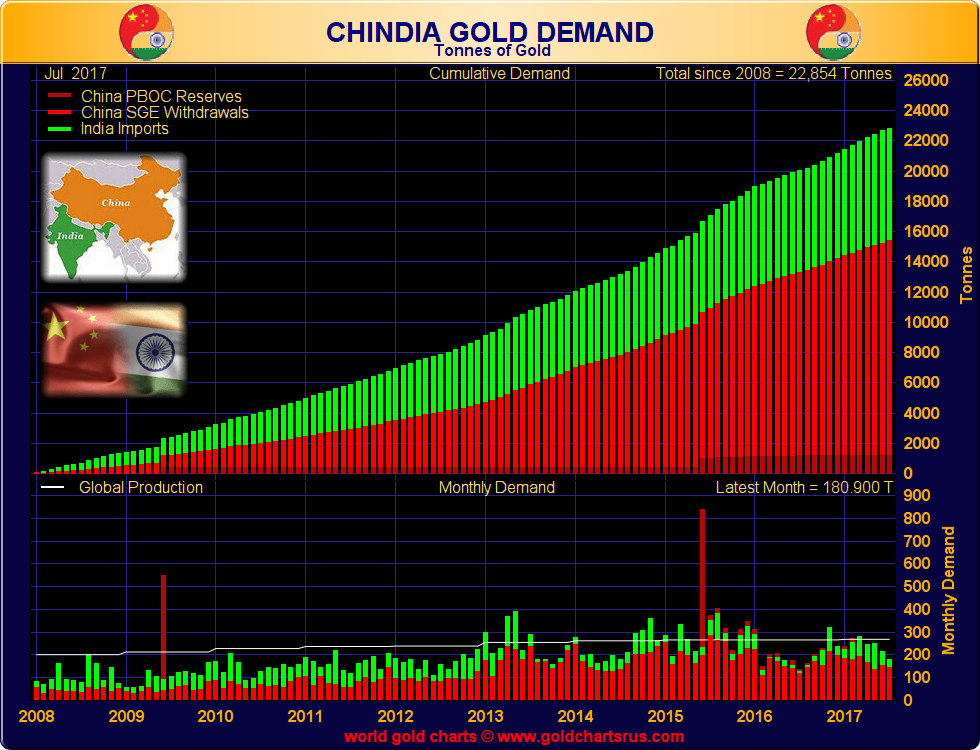
Based on latest available data, combined Chinese and Indian gold demand during July 2017 totalled 180.9 tonnes. This figure reflects 3 components, namely, Shanghai Gold Exchange (SGE) gold withdrawals, changes in Chinese central bank official gold reserves, and Indian gold imports. Indian gold imports act as a proxy for Indian gold demand given that the Indian gold market imports nearly all of its gold requirements.
The Bank of China (central bank of China) is still reporting official gold reserves of 1842 tonnes, a figure which has remained unchanged for many months now. But it is distinctly possible that the Chinese central bank has accumulated far more gold than it officially reports, and that its total gold holdings could be in excess of 4000 tonnes. See BullionStar Gold University article “PBoC Gold Purchases: Secretive Accumulation on the International Market" for more details.
Russian Gold Reserves
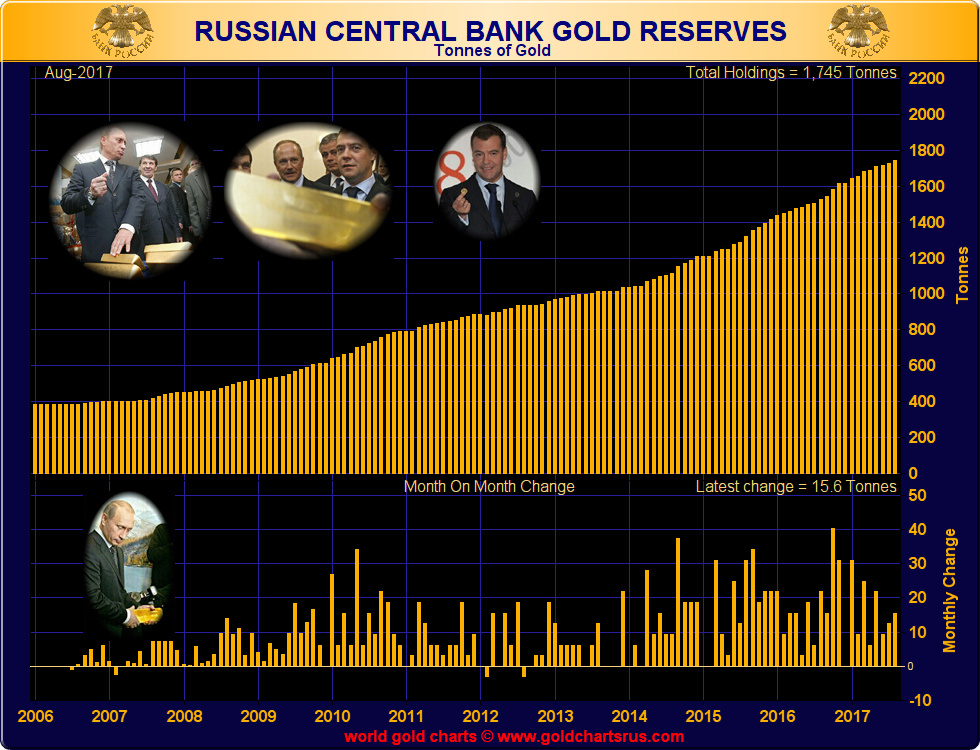
Latest figures from the Bank of Russia (the central bank of the Russian Federation) show that the Federation’s official gold reserves increased by 15.6 tonnes during August 2017. Year-to-date (to end of August), the Bank of Russia has now added 130 tonnes of gold to its official reserves and these now stand at 1745 tonnes.
Incidentally, the Russian gold reserve total of 1745 tonnes is just 100 tonnes short of the ‘officially reported’ gold reserves of the Chinese central bank which stand at 1842 tonnes. Russia will most likely add another 70 tonnes of gold to its official reserves during the remaining 4 months of 2017, to bring its full year gold purchases to about 200 tonnes. At this rate, if the Chinese central bank does not reveal any additions to its gold reserves between now and Q1 2018, Russia will most likely surpass China in terms of official gold reserves sometime before April 2018. This will be an interesting battle.
Transparent Gold Holdings
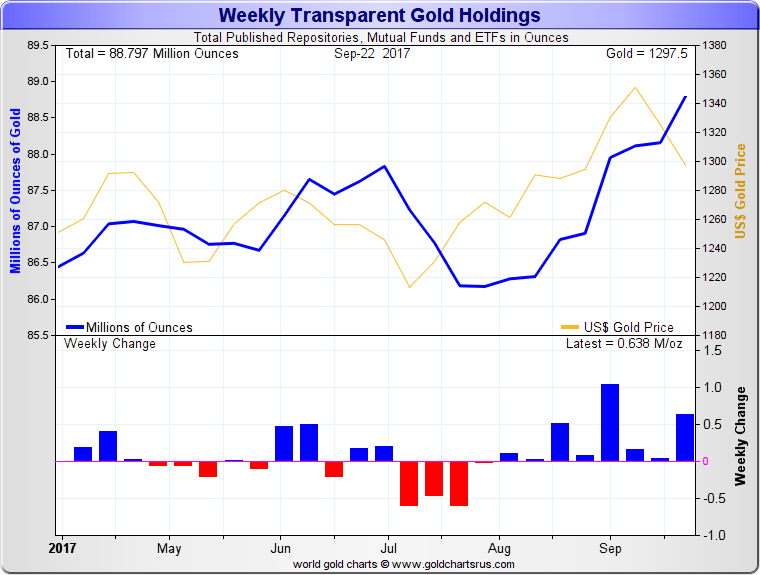
The international gold price in US Dollars rose strongly during the first week of September to reach the $1350 level. Following this, the price ebbed lower for most of the rest of the month, ending September just below the key $1300 level.
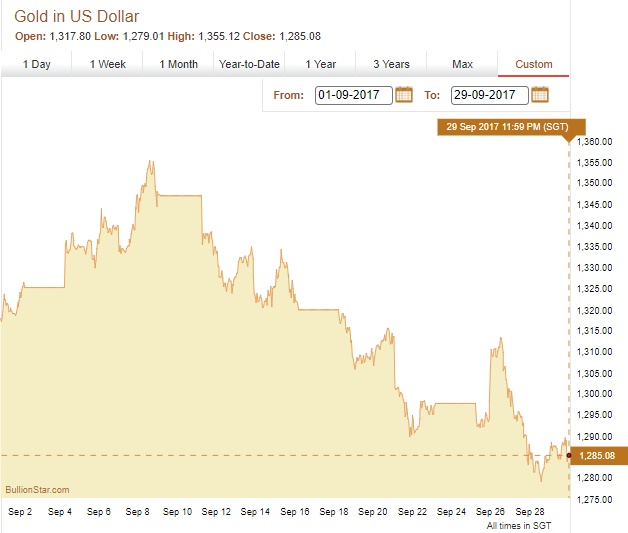
The August trend of net additions to the physical gold holdings of gold-backed Exchange Traded Funds, futures exchanges and other transparent gold products continued in September, with a net 2 million ounces of gold added to holdings in this category.
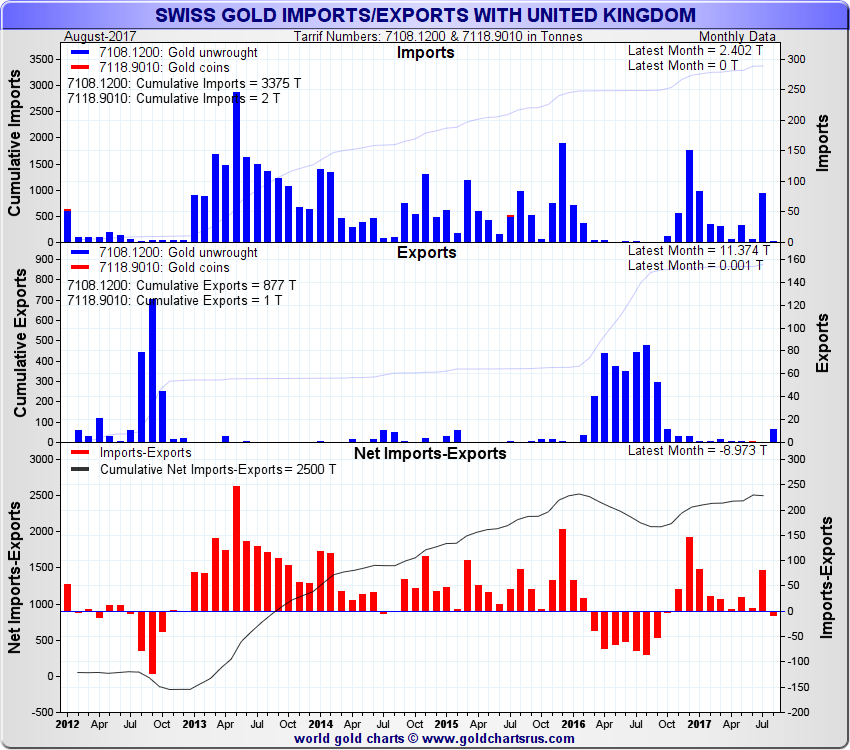
Swiss Gold Imports and Exports
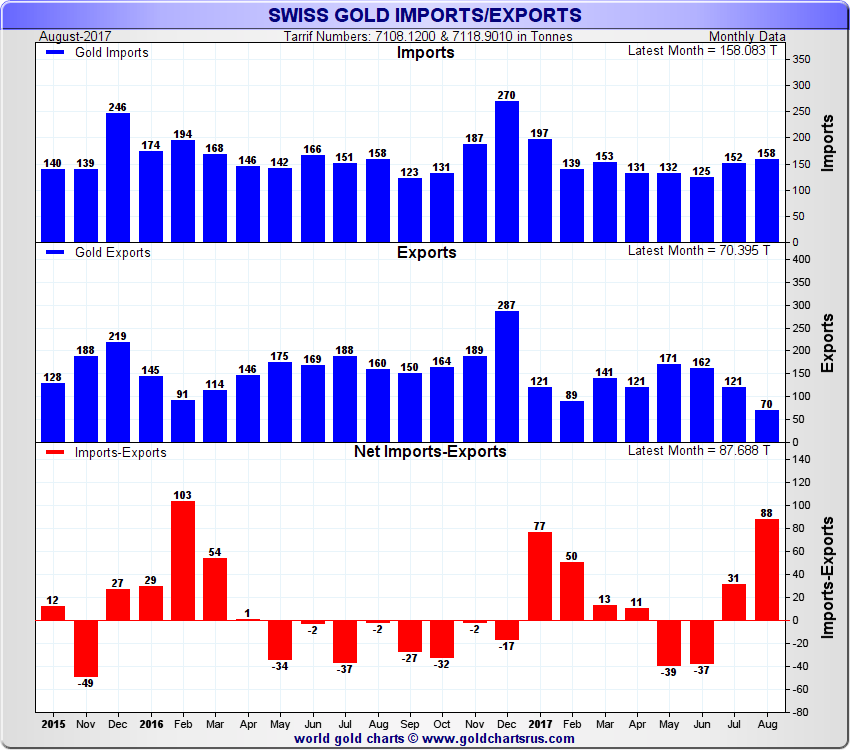
During August, the Swiss economy imported 158 tonnes of non-monetary gold and exported a relatively low 70 tonnes non-monetary of gold. Non-monetary gold is any gold not classified as central bank gold and that is not held as a monetary asset by a central bank.
Swiss gold exports during August, at 70 tonnes, stand out as the lowest monthly gold exports level over the past 2 years, and are also 56% less than August 2016’s gold export total of 160 tonnes, suggesting that it’s something other than seasonal factors in play to explain the unusually low figure.
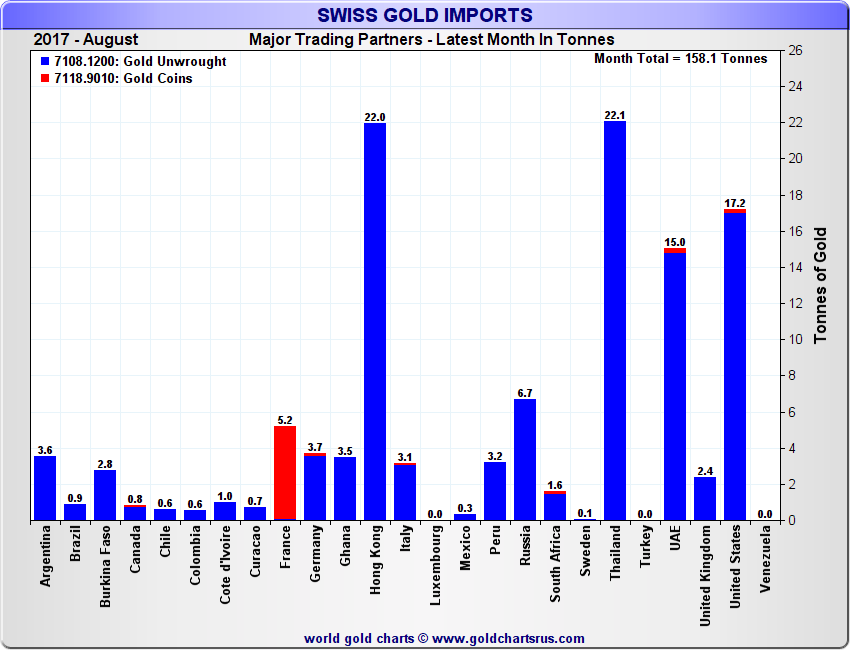
The largest sources of Switzerland’s gold imports during August were Hong Kong, Thailand, the United States and UAE (Dubai), which together accounted for 48% of the total. Interestingly, Switzerland also imported 6.7 tonnes of gold from Russia during August, which is unusual, and also imported 5.2 tonnes of gold coins from France during the month, again, another unusual occurrence.
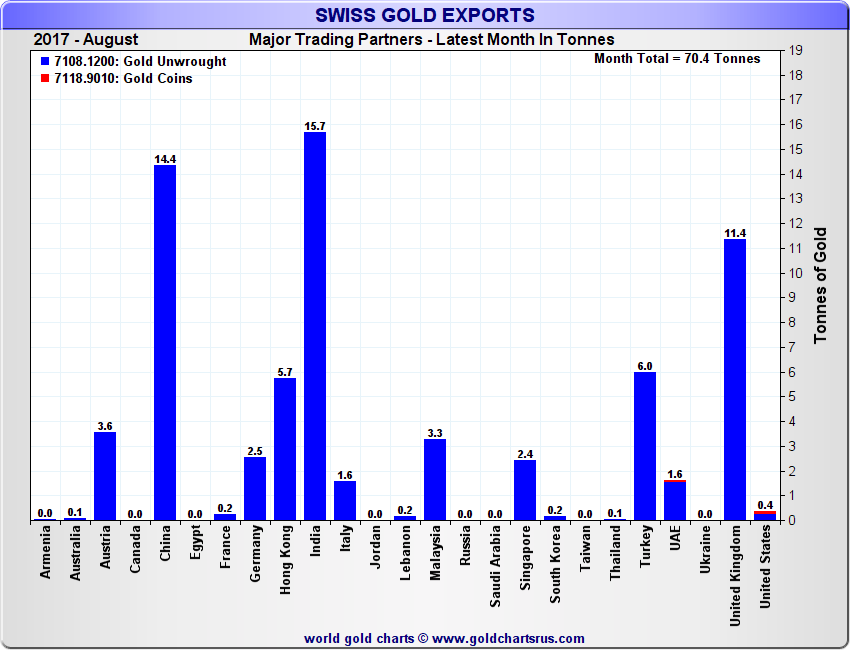
On the export side, China, India, the UK, Hong Kong and Turkey were the largest destinations for Swiss non-monetary gold exports during August, together accounting for 75% of the total. Apart from the UK, which is really reflecting activity in the London gold market, all the other major destinations for Swiss gold remain the traditional destinations of the East, primarily the vast Chinese and Indian gold markets.
Gold import and export figures between the UK (London) and Switzerland are a good gauge of the extent to which gold stored in London is used as a supply source for the large Swiss gold refineries. Normally, there will either be a noticeable net flow of gold to Switzerland that will persist for many months or a net flow of gold to the UK (London) that will persist for many months.
For example, 2013-2015 was a period of net gold imports from the UK to Switzerland, and London gold inventories became depleted. Following this, 2016 saw net exports of gold from Switzerland to the UK as London gold inventories were rebuilt. See the following chart which graphically illustrates these patterns.
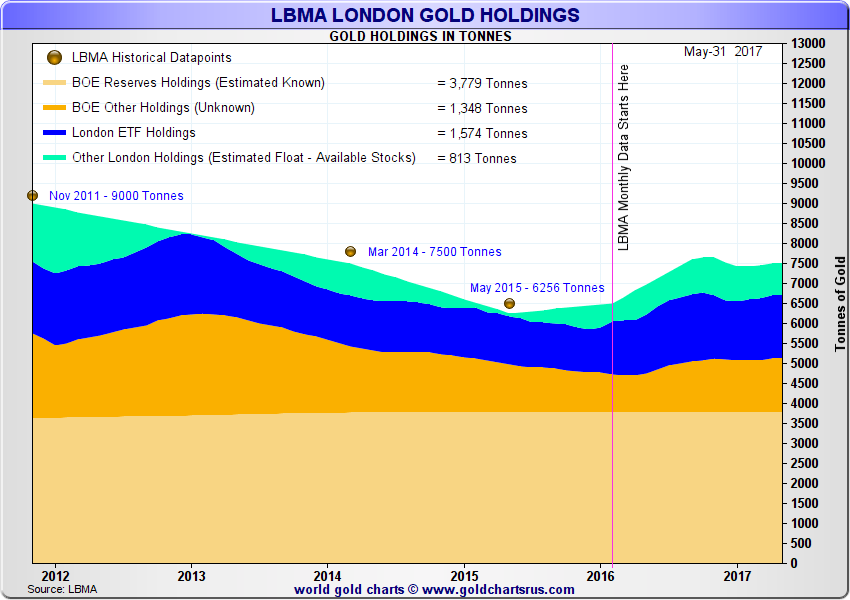
Total London Gold Holdings
At the end of April 2017, the Bank of England began to publish data on the amount of gold held in custody in its gold vaults in London. Each month this data is published on a 3 month lagged basis, but in April the Bank released comparable figures all the way back to 2011.
At the end of July 2017, the London Bullion Market Association (LBMA) also began to publish gold holdings data for the commercial gold vaults in and around London. This data is published on a 3 month lagged basis, but the first set of data also included comparable monthly figures from July 2016 onwards.
Using this new Bank of England and LBMA data, and adding in gold holdings of the ETFs that store their gold in London, a high level chart can be constructed which shows the total quantity of gold stored in London in both Bank of England vaults and other commercial vaults. Knowing how much gold is held at the Bank of England, and how much is held in ETFs (gold which is held in the commercial vaults), it can also be estimated how much other gold is in the London market that is not at the Bank of England and that’s not held in ETFs. This residual gold can be labelled ‘Other London Holdings’ or ‘Estimated Float’ and is illustrated in the pale green area of the below chart.
As can be seen from the chart below, this ‘Float’ of gold that is not Bank of England stored gold and that is not ETF held gold, was at times very low over the past 5 years, most notably in early 2013 and in mid 2015.
Currently the ‘Float’ number is higher again, but is still less than 1000 tonnes of gold, as can be seen in the right hand side of the chart.
Popular Blog Posts by Gold Market Charts
 November 2018 Gold Market Charts
 May 2018 Gold Market Charts
 December 2017 Gold Market Charts
 November 2017 Gold Market Charts
 October 2017 Gold Market Charts
 September 2017 Gold Market Charts
 August 2017 Gold Market Charts
 July 2017 Gold Market Charts
 June 2017 Gold Market Charts
 May 2017 Gold Market Charts