
LBMA Trading Volume Confirms London Paper Gold Casino

 Ronan Manly
 0 Comments
The London Bullion Market Association (LBMA) has just published a new set of ‘trading volume’ data covering the London and Zurich over-the-counter (OTC) gold and silver markets. According to the new data, the equivalent of 939 tonnes of gold (30.2 million ounces) and the equivalent of 11,174 tonnes of silver (359.2 mullion ounces) is traded each day by LBMA member firms (such as market makers and banks) for settlement in these two markets (loco London / loco Zurich). This, says the LBMA means that gold is a US$ 36.9 billion per day market while silver is a US$ 5.2 billion per day market.
To put these trading volumes into perspective, only about 3200 tonnes of gold is mined globally each year, meaning that roughly every three and a half trading days, trading of ‘gold’ by LBMA members for ‘settlement’ in London or Zurich exceeds the amount of gold physically mined globally in an entire year. Likewise, given that total silver mined globally per year is in the region of 27,000 tonnes, LBMA members are trading more ‘silver’ every two and a half days than is mined in an entire year.
While the LBMA’s new data is very high level and aggregated and does not do anything to lift the veil of secrecy lying over these markets, the magnitude of the trade volumes does prove whats been widely believed, i.e. that the OTC gold and silver markets operating mainly out of London by mainly LBMA bullion banks are trading predominantly unallocated and fractionally-backed synthetic positions on gold and silver and a lot less in the way of physical gold and silver.
Billed by the LBMA in such misleading terms as “LBMA-i Trade Reporting Launched: Delivering Transparency (for the Global OTC Precious Metals Market)“, the term ‘trade reporting’ is completely misleading, because no trades are actually being reported by the LBMA, anonymized or otherwise, and the new data is more accurately described as high level, rolled up, aggregated, post-trade, volume data.
Take for example any standard definition of trade reporting under MIFID, and you will see that what the LBMA is handing out to the market does not in the slightest meet the definition of trade reporting.
“Under MiFID II, investment firms are required to report basic details of their trades almost immediately, so that the information can be circulated in the market. The near real-time broadcasts of trade information is set to improve the transparency of pricing and offer greater insight into how prices are quoted and formed.“
“trade reporting focuses on ensuring transparency and fairness in the market“
As you will see, the new data doesn’t actually add transparency or market efficiency to the opaque and secretive London precious metals markets. By extension, this prevents proper price discovery for gold and silver prices. But first lets look at what the data does cover, and how the data that has just been published contains some surprises as to the size of the market.
Trade Reporting: In name only
The LBMA trade volume data comes in the form of a small downloadable Excel like table (csv file) that for each of gold and silver shows one week aggregated volume data in troy ounce equivalents for four product categories (spot, swap/forward, option, and loan/lease deposit) across different time periods from spot (now) through to 1 Year+. In the LBMA’s words the report covers:
“Trade data for the previous week in Gold and Silver for all four asset classes (Spots, Swaps, Forwards and Options), broken down by date increments (buckets).
This aggregated volume data report (known as the Volume Report) covers the previous week (usually five business days) and going forward will be published by the LBMA at 9 am London time each Tuesday morning. The first week’s volume data report covers the week commencing 12 November and looks as follows:
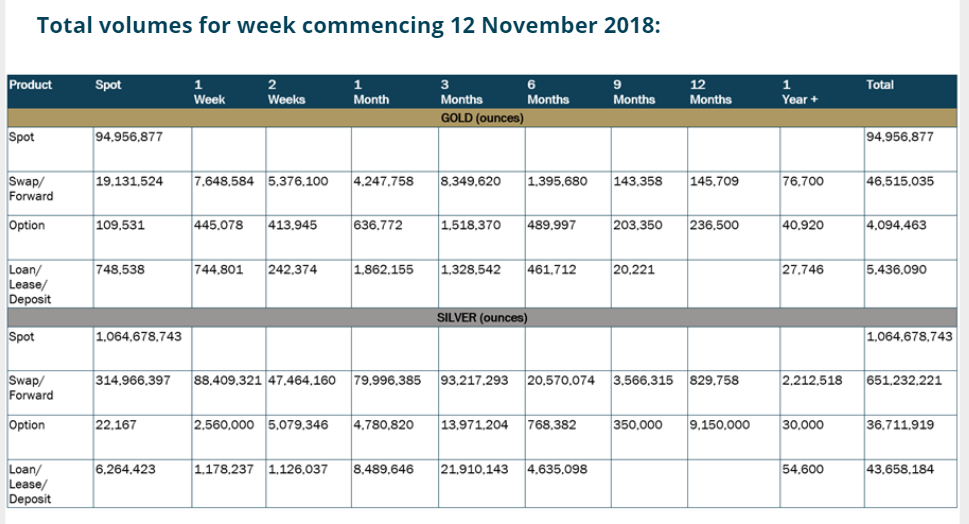
There is also a second LBMA report in the same format known as the ‘Open Volume" report which claims to capture all ‘open trades’ across gold and silver. The first instance of this ‘open volume’ report cover trades ‘accumulated from 5th November’ onwards. Both reports can be downloaded at this page.
For example, for gold, if you take the final four ‘troy ounce’ totals in the right hand column and add them up, you get 151,002,465 ozs, which divided by five is 30,200,493 ozs, which is 939 tonnes. The US dollar equivalent figure is then derived by multiplying the troy ounce volume total (e.g. 30.2 million ounces) by the latest LBMA gold price per ounce prior to the report’s publication, which in this case was US$ 1221.60 on 19 November, giving US$ 36.892 billion, which explains why the LBMA was quoting a market size of US$ 36.9 billion in its press release. Based on its report, 63% of gold trades were for spot trades, 31% for swaps/forwards, and the remaining 6% for options and loans/leases/deposits.
Similarly for silver, per the first report there were 1,796,281,067 ounces of silver ‘traded’ in a week, which when divided by five is 359,256,213 ozs or 11,174 tonnes. At a silver price of US$ 14.36 on 19 November, this trading had a value of US$ 5.159 billion, which the LBMA rounded up to US$ 5.2 billion in its press release. Based on its report, 59% of trades in silver were for spot, 36% for swaps/forwards, and the remaining 5% for options and loans/leases/deposits.
Currently, the trade volume data in the LBMA report is said to reflect trade reporting of 43 LBMA members including all 13 LBMA market makers. The market makers are all bullion banks, and contain names such as JP Morgan, HSBC, Goldman Sachs, SocGen, Morgan Stanley and UBS, The LBMA says that another 15 of its members will begin reporting trades to its database during January 2019, which would bring the total number of LBMA members reporting to 58.
Daily Trade Volume Date: But not just yet
As a reminder, the LBMA had promised ‘trade reporting’ data more than three years ago in the wake of the UK financial authorities’ “Fair and Efficient Markets Review" initiative launched in 2014 in reaction to market manipulation of the UK’s Fixed Income, Currency and Commodities (FICC) markets and which called for an improvement of fairness and efficiency in those markets, including the wholesale London gold and silver markets.
As probably one of the longest running projects in the history of financial markets before any data was actually published (with the LBMA having launched a strategic review on ‘trade reporting’ in April 2015), it might be expected then that when the LBMA data was actually published it would be in a final and steady state. But as is often the case with the LBMA and its bullion bank members, they fudged the issue and for the next few months until at least sometime in Q1 2019, the above trade volume reports will contain a week’s worth of trade volume data and will only be published once per week, and not on a daily basis. Again, this is not trade reporting, and its not even transaction reporting since under MIFID II transaction reporting carries a T+1 requirement, where T is transaction day, and 1 is next day.
So the LBMA after 3 years cannot even produce, or refuses to produce trade volume statistics on a T+1 basis, until sometime in Q1 2019. What are they hiding and why are the UK regulators allowing the London bullion market to be exempt from trade reporting and T+1 transaction reporting? Why after 3 years of planning and design and data gathering are 15 additional LBMA members only ready to supply data to the ‘trade reporting’ repository in January 2019 and not from the launch date in November 2018.
Given that all the data that goes into the report is readily available on a daily basis in the LBMA’s trade reporting database, it yet again looks as if the LBMA is on the one hand claiming to be increasing transparency but on the other hand is reluctant to actually make this happen, as it does not yet want the market to be able to relate gold and silver price movements to specific trading volumes on those days that a daily report would reveal. The UK financial regulators (Treasury, Bank of England and UK Financial Conduct Authority (FCA) which conducted the FEMR review are also staying silent on the fact that whatever the LBMA is publishing as ‘trade reporting’ is certainly not trade reporting.
Trading volumes now mysteriously 82% lower than in 2011
One of the most puzzling facts about the new trading volume data is that the daily averages for gold in the London OTC gold market are a lot lower than was generally believed to be the case. For many years, the LBMA has each month produced clearing volume data which reflects the volumes of gold and silver trades ‘cleared’ through the London Precious Metals Clearing Limited (LPMCL) clearing platform ‘Aurum’.
The conventional view in the market (and one even used by financial academics and the World Gold Council) was that trading volumes in the London OTC gold market were anywhere between seven to ten times higher than clearing volumes. This then allowed trading volumes to be estimated or projected using clearing volumes and a multiplier, of say 10. A multiplier of ten was itself something the LBMA actually stated when it conducted a trading volume survey of its members in Q1 2011. To quote the LBMA in its survey from 2011:
“It can also be seen that there is an approximately ten to one ratio between the turnover figures and the clearing statistics. It can be seen that spot transactions form the large majority of the total (around 90%), with forwards and other transactions each representing around 5%. The average daily trading volume in the London market in this period was 173,713,000 ounces or $240.8 billion“
But looking at the latest LBMA clearing trade volume data from 2018 implies a far far lower multiple than 10. Recent LBMA clearing statistics from September 2018 show that on a daily basis 18.9 million ounces of gold were cleared in London. Compare this to 30.2 million ounces traded per day (939 tonnes), and the multiple is only 1.6 and nowhere near 10.
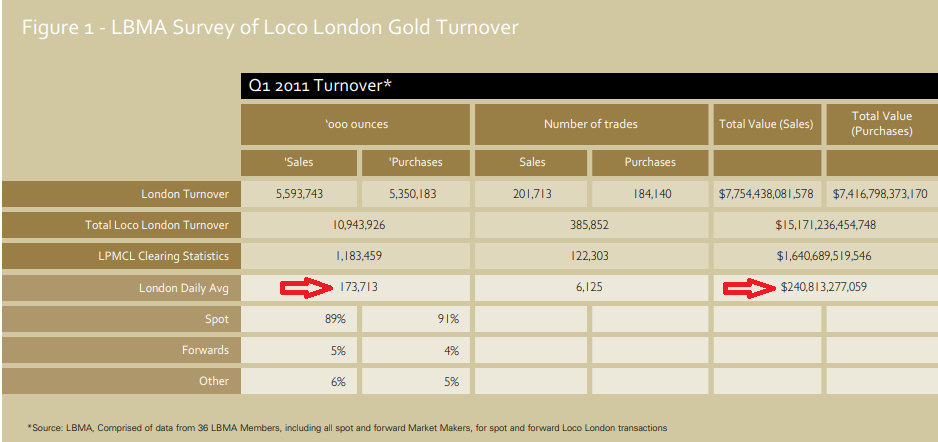
Not only that but current reported daily trading volume of 30.2 million ounces of gold for November 2018 is 82% lower than the daily trading volume of 173.7 million ounces of gold for Q 1 2011. How can this be? The 2011 trading survey was conducted on a voluntary basis and 36 ‘full members’ of the LBMA at the time, including all market makers, responded to that survey.
The current trading volume data now in 2018 is based on trade data submitted by 42 LBMA members including all market makers. How can the daily trading volumes in 2011 based on the trades of 36 members (including all market makers) be nearly six times as large as the daily trading volumes in 2018 based on the trades of 42 members (including all market makers). Have large subsets of trades been excluded?
It was in a January 2015 letter to the Fair and Efficient Market Review (FEMR) at the Bank of England, where the LBMA stated that
“it is worth noting, that the role of the central banks in the bullion market may preclude ‘total’ transparency, at least at public level…"
Have these or other types of trades, such as sovereign trades been masked or filtered out of the trade volume data? There is no way of knowing unless the LBMA clarifies or else provides a full methodology of how it collects the data used to extract these aggregated trade volume figures.
Conclusion
The LBMA trade repository or reporting hub, named LBMA-i, into which LBMA member firms report their trade data, has a huge amount of trade data that the LBMA could report to the market if it so chose and wished to do so in the interests of market fairness and efficiency. There could be real trade reporting which as a reminder under MIFID takes the form of reporting “basic details of trades almost immediately, so that the information can be circulated in the market, to improve transparency of pricing".
There could be reporting by client type, such as miners, refiners, central banks, buyside institutions, banks etc, and reporting by trade rationale, e.g. ETF trades interbank trades, exchange for physicals, speculative trading, central bank gold deposits, physical consignment trades etc. In fact the options are practically endless for proper trade reporting when all of the data is in a database, as it is in the LBMA-i reporting hub.
But the LBMA has chosen not to provide any trade reporting at all, and the UK financial authorities have chosen to look the other way. The London gold and silver markets will therefore continue to operate in opacity and with a lack of market efficiency that proper trade reporting would have gone someway to improve.
Popular Blog Posts by Ronan Manly
 How Many Silver Bars Are in the LBMA's London Vaults?
 ECB Gold Stored in 5 Locations, Won't Disclose Gold Bar List
 German Government Escalates War On Gold
 Polish Central Bank Airlifts 8,000 Gold Bars From London
 Quantum Leap as ABN AMRO Questions Gold Price Discovery
 How Militaries Use Gold Coins as Emergency Money
 Hungary Announces 10-Fold Jump in Gold Reserves
 Planned in Advance by Central Banks: a 2020 System Reset
 China’s Golden Gateway: How the SGE’s Hong Kong Vault will shake up global gold markets