
BOOM: SGE Withdrawals Week 3, 2015: 71 tonnes!

 Koos Jansen
As I wrote last time on data from the Shanghai Gold Exchange (SGE), in week 2 of 2015 withdrawals from the vaults of the SGE (that equal Chinese wholesale demand) came in extremely high at 70 tonnes; the third highest amount ever. In week 3 (January 19 – 23), though, the Chinese withdrew even more at 71 tonnes, up 0.89 % w/w, and a new third highest amount ever. Year to date 202 tonnes have been withdrawn from the SGE vaults, up 15 % y/y. Like last week, this was happening while the price of gold was rising sharply, staggering numbers.
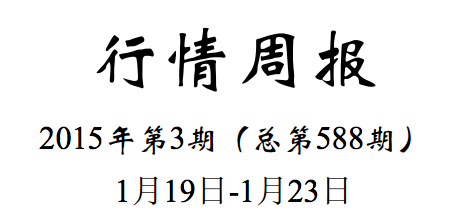

Corrected by the volume traded on the Shanghai International Gold Exchange (SGEI), withdrawals in week 3 were at least 65 tonnes (read this post for a comprehensive explanation of the relationship between SGEI trading volume and withdrawals). Year to date withdrawals corrected by SGEI volume were at least 189 tonnes.
Furthermore, the end of day premium of the SGE main physical gold contract, Au9999, has been positive throughout all of week 3. This means scrap supply was not abundant over this period – a discount, or negative premium, can’t be arbitraged by foreigners as bullion export from China is prohibited. Estimating scrap/recycled gold that supplied the SGE at 4 tonnes and mine production at 9 tonnes, sets imported gold for week 3 somewhere in between 52 and 58 tonnes.
It’s still a mystery why mainstream media are not tracking weekly SGE withdrawals. I’ve read all over the news that Russia’s central bank has added 152 tonnes of gold in total to its reserves in 2014. In perspective, this is approximately the same amount of gold China has imported in the first three weeks of 2015. In my post China Continues To Drain Global Gold Inventory I have, once again, pointed out that import numbers derived from SGE withdrawals are for 95 % covered by export from the UK, Switzerland, Hong Kong and the US. These countries disclose only non-monetary gold trade, which support my assumption PBOC purchases are an invisible side show from public gold trade numbers and SGE withdrawals.
Chinese domestic mining has been roughly 27 tonnes over the first three weeks of 2015, which is not exported. All this gold (import and mine) is being sold through the SGE. Until I run into evidence that states the contrary, the PBOC does not buy any gold through the SGE, but most likely through proxies in Hong Kong or London. So, PBOC purchases have to be added to the tonnage sold through the SGE. According to Deutsche Bank the PBOC has purchased roughly 500 tonnes a year since 2010. Go figure.
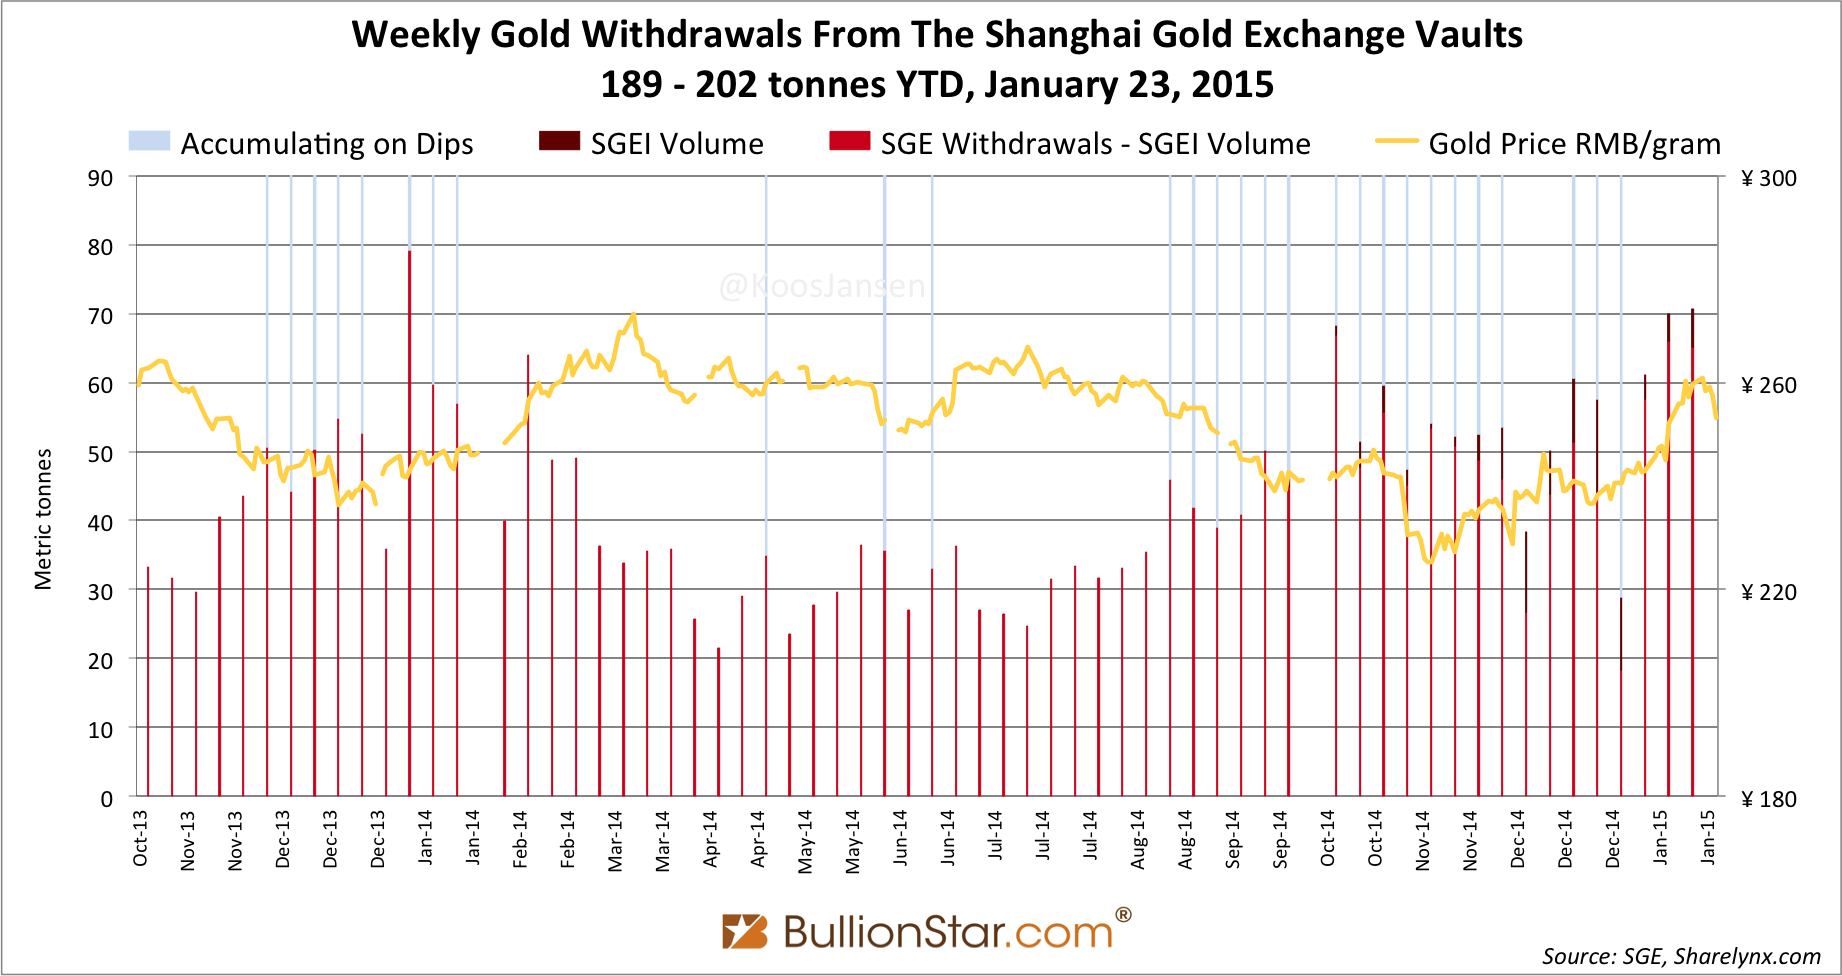
Thomson Reuters GFMS released the GFMS Gold Survey 2014 – Update 2 on Thursday. The report states Chinese consumer gold demand in 2014 was 866 tonnes.
My regular readers will not be surprised I dispute this number; in 2014 China imported at least 1,200 tonnes, mined 451 tonnes and according to GFMS’ numbers scrap accounted for 182 tonnes. So supply was at least 1,833 tonnes, yet consumer demand was 866 tonnes. Quite a gap, 967 tonnes.
 This gap was at least 737 tonnes in 2013. In the table above taken from the Gold Yearbook 2013 published by the China Gold Association (CGA), we can see import was 1,507 tonnes (blue) and Chinese domestic and overseas mining accounted for 445 tonnes (purple), if we add GFMS’ scrap supply number for 2013, which is 144 tonnes, total supply in 2013 was 2,096. The gap between 2,096 and 1,359 tonnes is 737 tonnes. Neglecting scrap supply disclosed by the CGA (green).
In the report GFMS states “demand does not include transfers of physical gold between financial organizations or gold used to support the OTC market”.
In forthcoming posts I will expand on the differences in metrics used all across the globe (by the WGC, GFMS, CGA, CPM, me) to get a better understanding why Chinese demand numbers are so divergent.
In any case the 0.6 metric tonnes of gold sold in one day in just one shopping mall in Beijing in January, 2015, was not gold used in transfers between financial organizations…

Popular Blog Posts by Koos Jansen
 China’s Secret Gold Supplier is Singapore
 Audits of U.S. Monetary Gold Severely Lack Credibility
 China Gold Import Jan-Sep 797t. Who’s Supplying?
 The Gold-Backed-Oil-Yuan Futures Contract Myth
 Estimated Chinese Gold Reserves Surpass 20,000t
 PBOC Gold Purchases: Separating Facts from Speculation
 U.S. Mint Releases New Fort Knox Audit Documentation
 China Net Imported 1,300t of Gold in 2016
 Why SGE Withdrawals Equal Chinese Gold Demand and Why Not