
Week 31 SGE Chart

 Koos Jansen
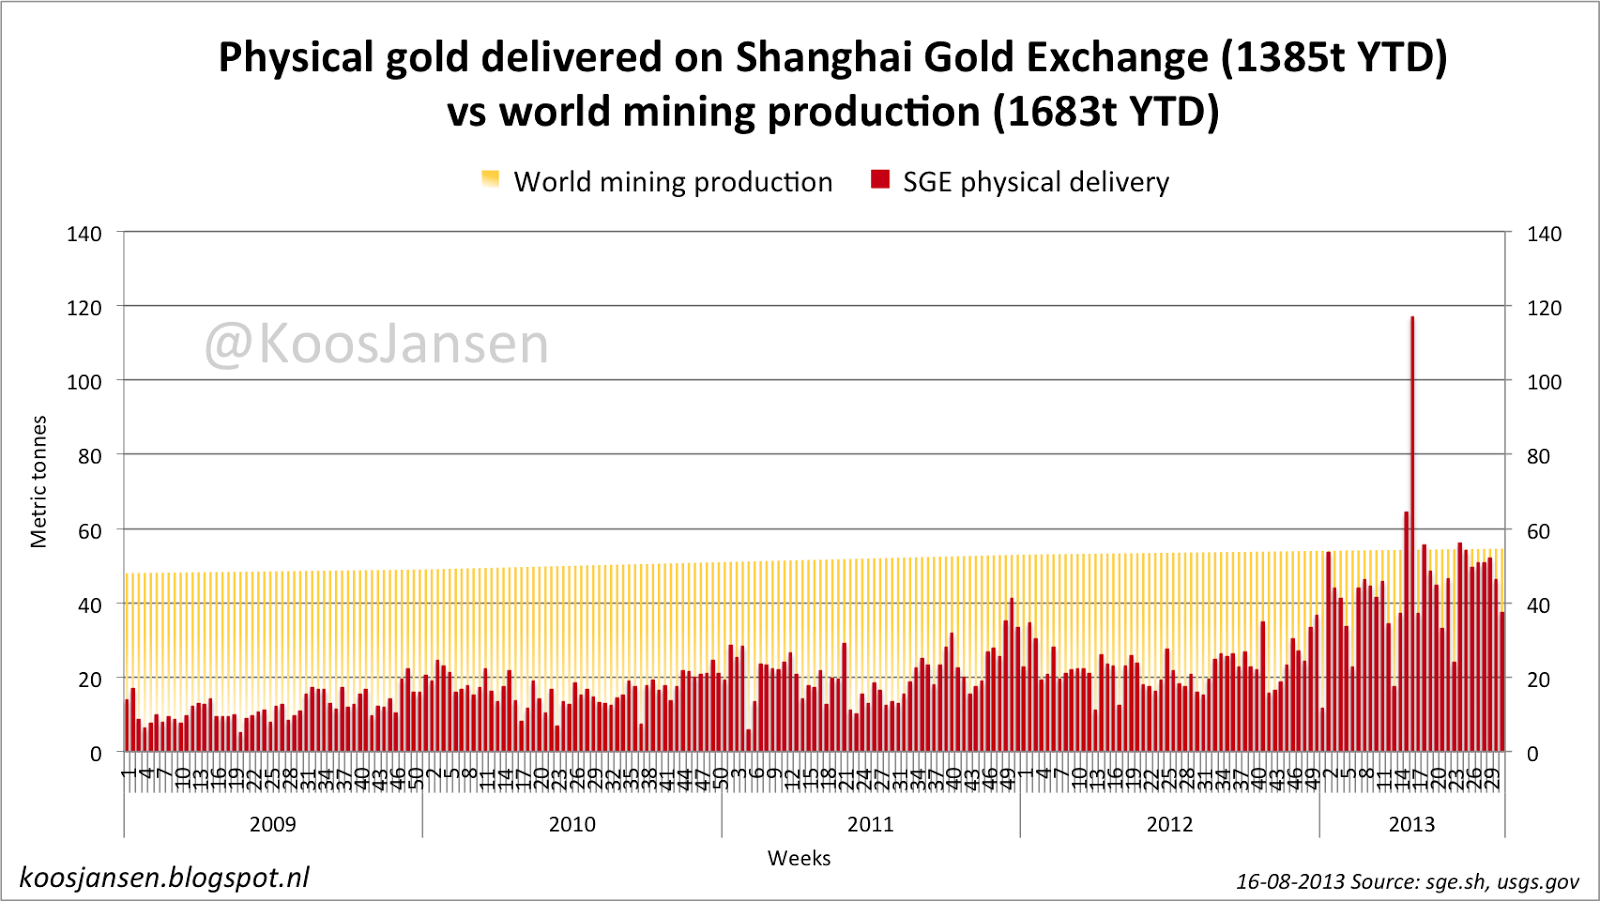
Weekly chart physical gold delivered on the Shanghai Gold Exchange vs world mining production. By @KoosJansen
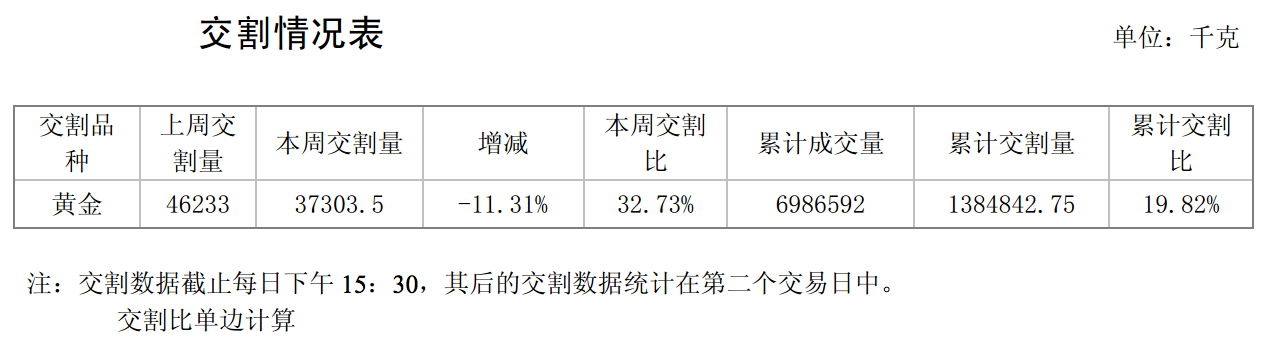
– 37 metric tonnes delivered in week 31 (left the SGE vaults)
– w/w -11.31 %
– 1385 metric tonnes delivered year to date
For more information on SGE deliveries read this.

Popular Blog Posts by Koos Jansen
 China’s Secret Gold Supplier is Singapore
 Audits of U.S. Monetary Gold Severely Lack Credibility
 China Gold Import Jan-Sep 797t. Who’s Supplying?
 The Gold-Backed-Oil-Yuan Futures Contract Myth
 Estimated Chinese Gold Reserves Surpass 20,000t
 PBOC Gold Purchases: Separating Facts from Speculation
 U.S. Mint Releases New Fort Knox Audit Documentation
 China Net Imported 1,300t of Gold in 2016
 Why SGE Withdrawals Equal Chinese Gold Demand and Why Not