
July Chinese Gold Trade Charts

 Koos Jansen
Today new data came out from the Hong Kong Census and Statistics Department. This data covers Hong Kong import, export and re-export of goods to July 2013. All of the charts about Chinese and Hong Kong gold trade we publish on this blog are based on these data sets.
For clarity, these charts are all based on trade numbers from Hong Kong. With these numbers we know how much gold ends up in Hong Kong itself (import minus export) and how much gold Hong Kong trades with other countries (net import or export). The “China net inflow charts" are only about the amount of gold that China mainland net imports through Hong Kong.
For my charts we added up the following gold categories from the trade reports:
HKHS code (Hong Kong Harmonized System)
98002: GOLD COIN AND CURRENT COIN
97101: GOLD (INCLUDING GOLD PLATED WITH PLATINUM), NON-MONETARY, UNWROUGHT OR IN SEMI-MANUFACTURED FORMS, OR IN POWDER FORM
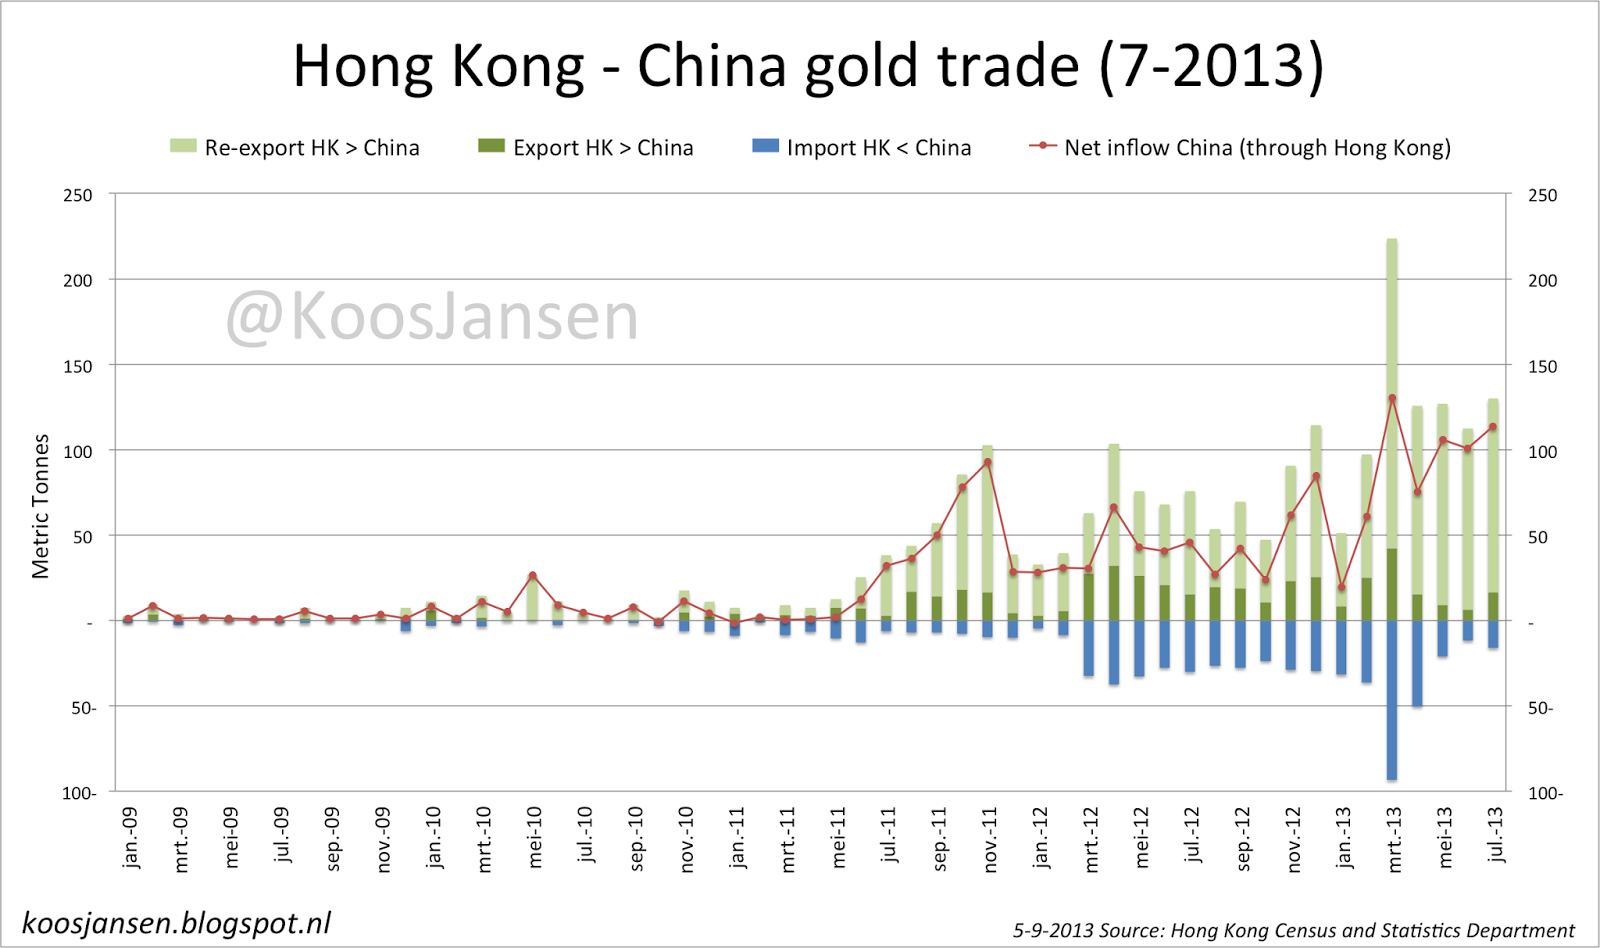
In July gold trade remained high in Hong Kong. Monthly net export to China mainland was up, Hong Kong net import remained robust which hints at exceptional high activity on the CGSE, and the Swiss were the main suppliers for the Chinese.
Lets start with Hong Kong gold trade. In July Hong Kong net gold import was 73 tons, down from 81 tons in June – 10% m/m, year to date total net import is 295 tons. Gross Hong Kong gold import is 1273 tons, gross export 978 tons YTD.

Most of the gold Hong Kong exports goes to China mainland as can be seen in the following charts. In July the mainland net imported 114 tons from Hong Kong, up from 101 tons in June + 13% m/m, year to date the mainlands’s total net import through Hong Kong is 607 tons.

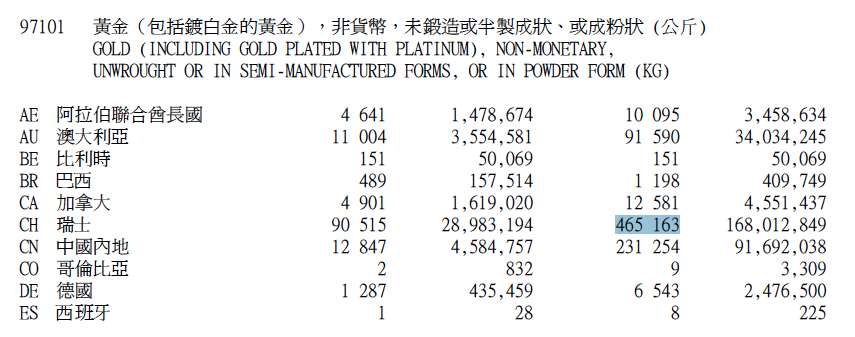
Hong kong net import from Switzerland was 91 tons in July, year to date total net import from the Swiss stands at 465 tons. At the moment most of the gold Switzerland is exporting to Hong Kong, they have imported from the UK (read here and here).
>
This is a screen dump in which we high lighted Hong Kong import YTD from Switzerland.
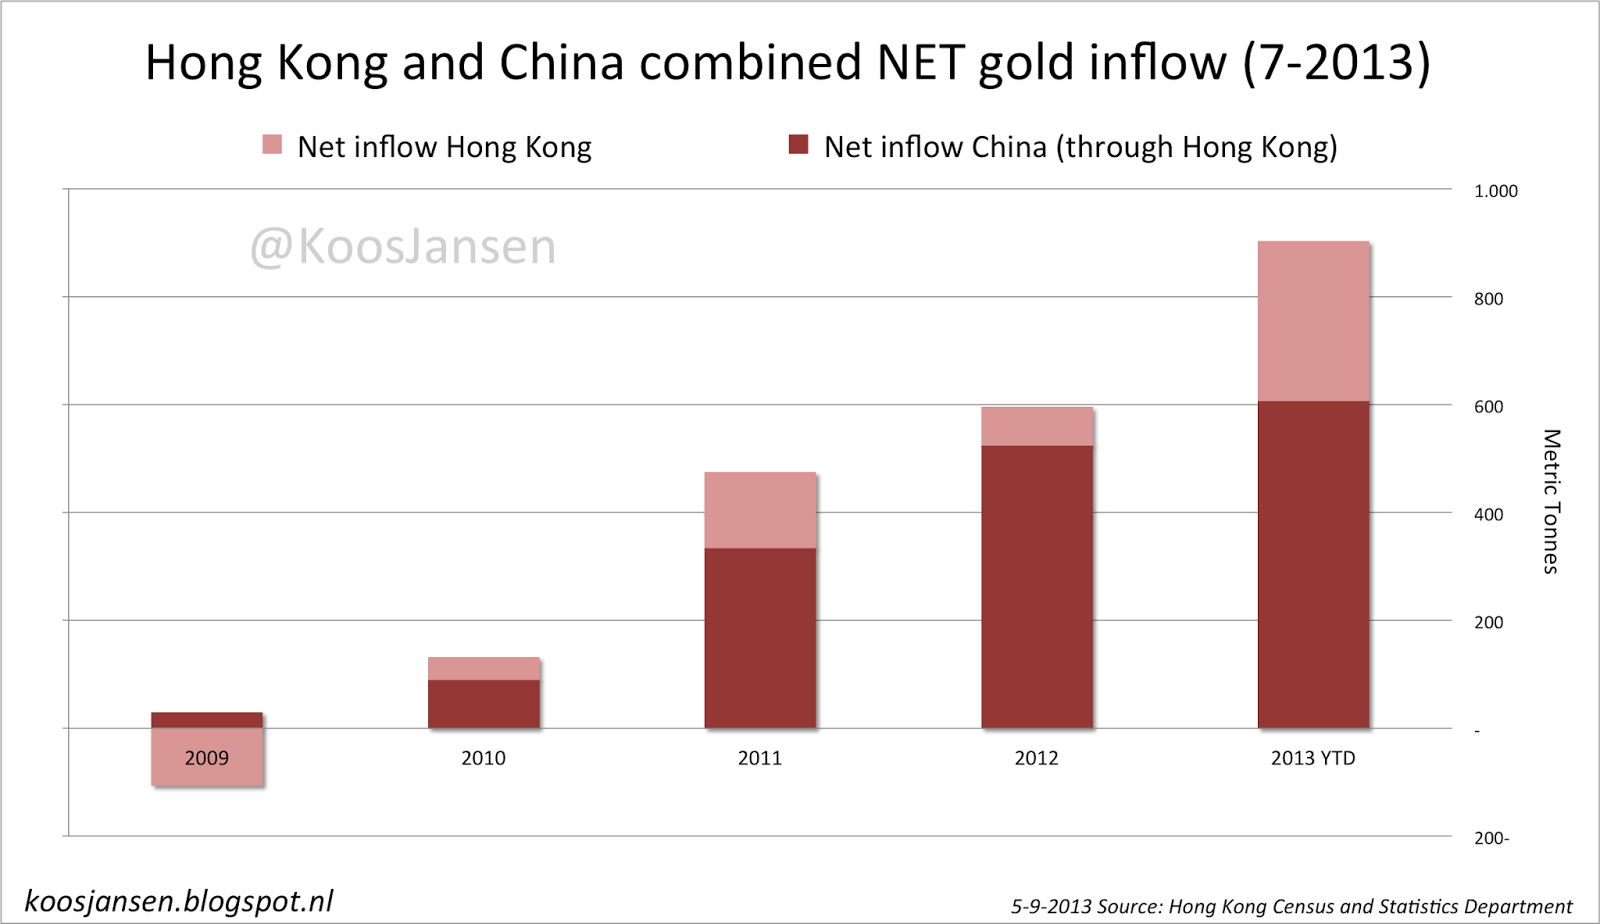
Hong Kong and China mainland combined net gold inflow year to date is 902 tons.
Popular Blog Posts by Koos Jansen
 China’s Secret Gold Supplier is Singapore
 Audits of U.S. Monetary Gold Severely Lack Credibility
 China Gold Import Jan-Sep 797t. Who’s Supplying?
 The Gold-Backed-Oil-Yuan Futures Contract Myth
 Estimated Chinese Gold Reserves Surpass 20,000t
 PBOC Gold Purchases: Separating Facts from Speculation
 U.S. Mint Releases New Fort Knox Audit Documentation
 China Net Imported 1,300t of Gold in 2016
 Why SGE Withdrawals Equal Chinese Gold Demand and Why Not