 Contact
 Help
Help







Gold vs S&P 500: Historical Performance and Investment Comparison
 Gold & Silver 101



Gold and the S&P 500 sit at opposite ends of the investment spectrum: one is a finite, physical store of value with thousands of years of history, the other a basket of 500 of America’s largest companies representing the growth engine of the world’s biggest economy. Investors researching gold vs the S&P 500 are usually trying to answer a more practical question underneath the comparison — should I own one, the other, or both?
Over the long run, the S&P 500 has outperformed gold as a pure wealth-building asset. But total return isn’t the only thing that matters in a portfolio. Gold and stocks behave very differently from each other, particularly during market stress, and the two have historically played complementary rather than competing roles. One built for growth, the other for preservation and diversification when growth assets fall.
This guide puts the two side by side: a quick-comparison table covering returns, volatility, and correlation, a look at how gold and the S&P 500 have each performed across the major market cycles of the last 50 years (the 1970s stagflation era, the 2000s, the 2008 financial crisis, and the years since 2020), how gold stacks up against the Dow and Nasdaq too, and a practical framework for thinking about how much of each to hold.
Please note that BullionStar does not provide investment or financial advice. The information below is for informational purposes only. Your individual circumstances and goals will always be the most important factors in any investment decision.
Gold vs S&P 500: A Quick Comparison
Gold and the S&P 500 differ on almost every measure that matters to an investor: what drives their returns, how much they swing in price, whether they pay any income, and the job each one does inside a portfolio.
| Gold | S&P 500 | |
|---|---|---|
| Average annual return (price only, since 1978) | ~6.0% | ~9.6% |
| Annual volatility (typical price swing) | ~16% | ~15% |
| Dividend / income | None — gold generates no yield | ~1.0–1.2% currently (long-run average closer to 1.8–2%) |
| Correlation to the other | Low, and turns slightly negative during stock sell-offs | Low, and turns slightly negative during stock sell-offs |
| Primary role in a portfolio | Store of value, inflation hedge, diversifier | Long-term growth engine, ownership stake in productive businesses |
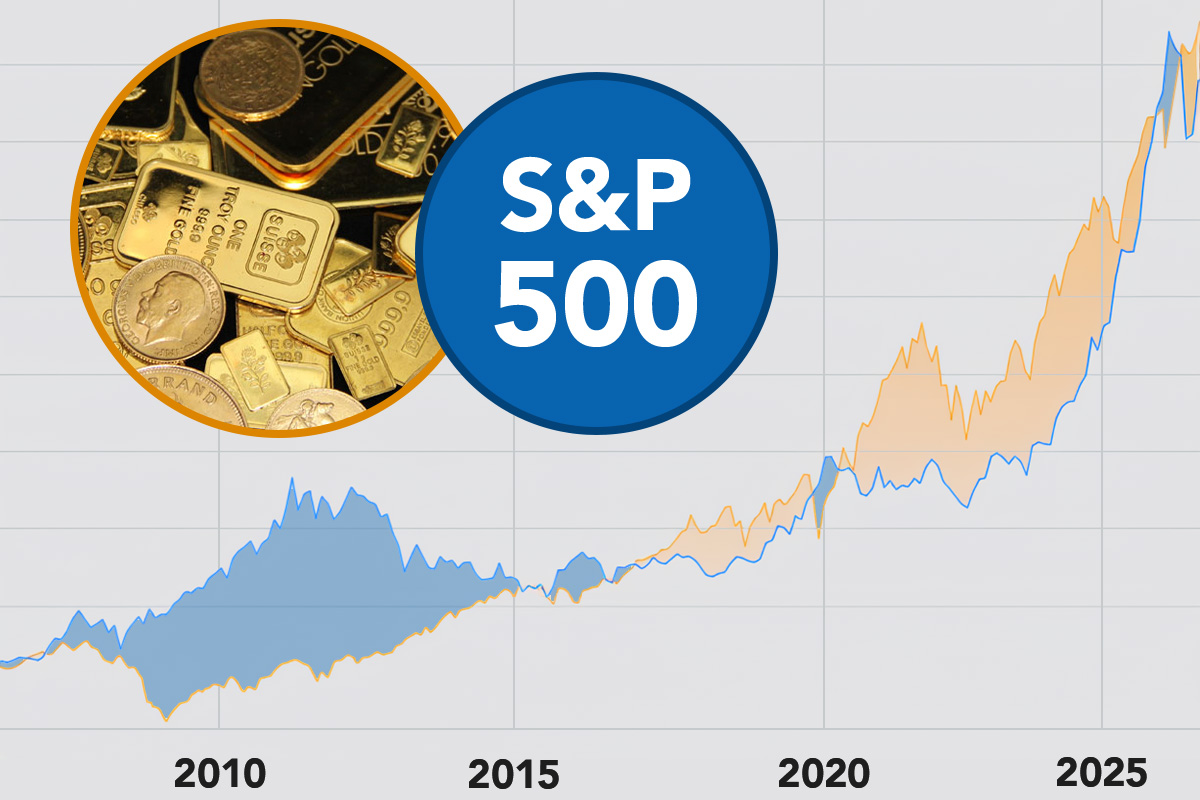
There are two things worth expanding on from the table above. Firstly, the S&P 500 return figure above is price only. It doesn’t include dividends reinvested, which have historically added roughly another 1.5–2% a year to the index’s real-world total return. Secondly, “volatility" here means the size of typical price swings, not how calm an asset feels to hold. Gold’s month-to-month moves have historically been about as large as the S&P 500’s, sometimes larger. What makes gold useful for portfolio diversification isn’t lower volatility, it’s that its swings tend to happen at different times and for different reasons than stock market swings, which is exactly what the low, occasionally negative correlation above is capturing, and what we’ll see play out in the historical chart below.
Historical Performance: Gold vs S&P 500 Over 50 Years
Zoom out far enough, and the picture is unambiguous: since 1978, the S&P 500 has compounded at roughly 9.6% a year on a price basis, against gold’s roughly 6.0%. That gap widens further once you factor in stock dividends, which gold has no equivalent of. Over the long run, stocks have been the better wealth-building engine. But averaged annual returns hide the more interesting story, which is what happened in between: several distinct periods where the price of gold didn’t just hold up better than stocks, it dramatically outperformed them.
1971–1980: The Gold Standard Ends
Gold’s modern trading history begins in August 1971, when President Nixon ended the dollar’s convertibility into gold. The ‘Nixon Shock’ of 1971 ended the gold standard, freeing its price from the fixed $35 an ounce it had held since the 1940s.
What followed was one of gold’s greatest bull runs: by its January 1980 peak, gold had touched $850 an ounce, a gain of well over 2,000%. Stocks, meanwhile, endured one of the worst bear markets of the post-war era — the Dow Jones Industrial Average lost over 45% of its value between January 1973 and December 1974 alone, with the S&P 500 falling by a similar magnitude. Combined with the decade’s double-digit inflation, US equities were essentially dead money in real terms through the 1970s, while gold’s rise made it one of the only assets that kept pace with the cost of living.
The 2000s: Gold’s “Lost Decade" for Stocks
The dot-com bust reset the pattern. From the August 2000 market peak to the end of that decade, the S&P 500 was down around 33%, while gold climbed roughly 246% over the same stretch. This period is widely referred to as the “lost decade" for stocks, and arguably gold’s best decade on record. It was a rare stretch where an entire ten-year run went to gold outright, not just the crisis years within it.
2008–2009: The Financial Crisis
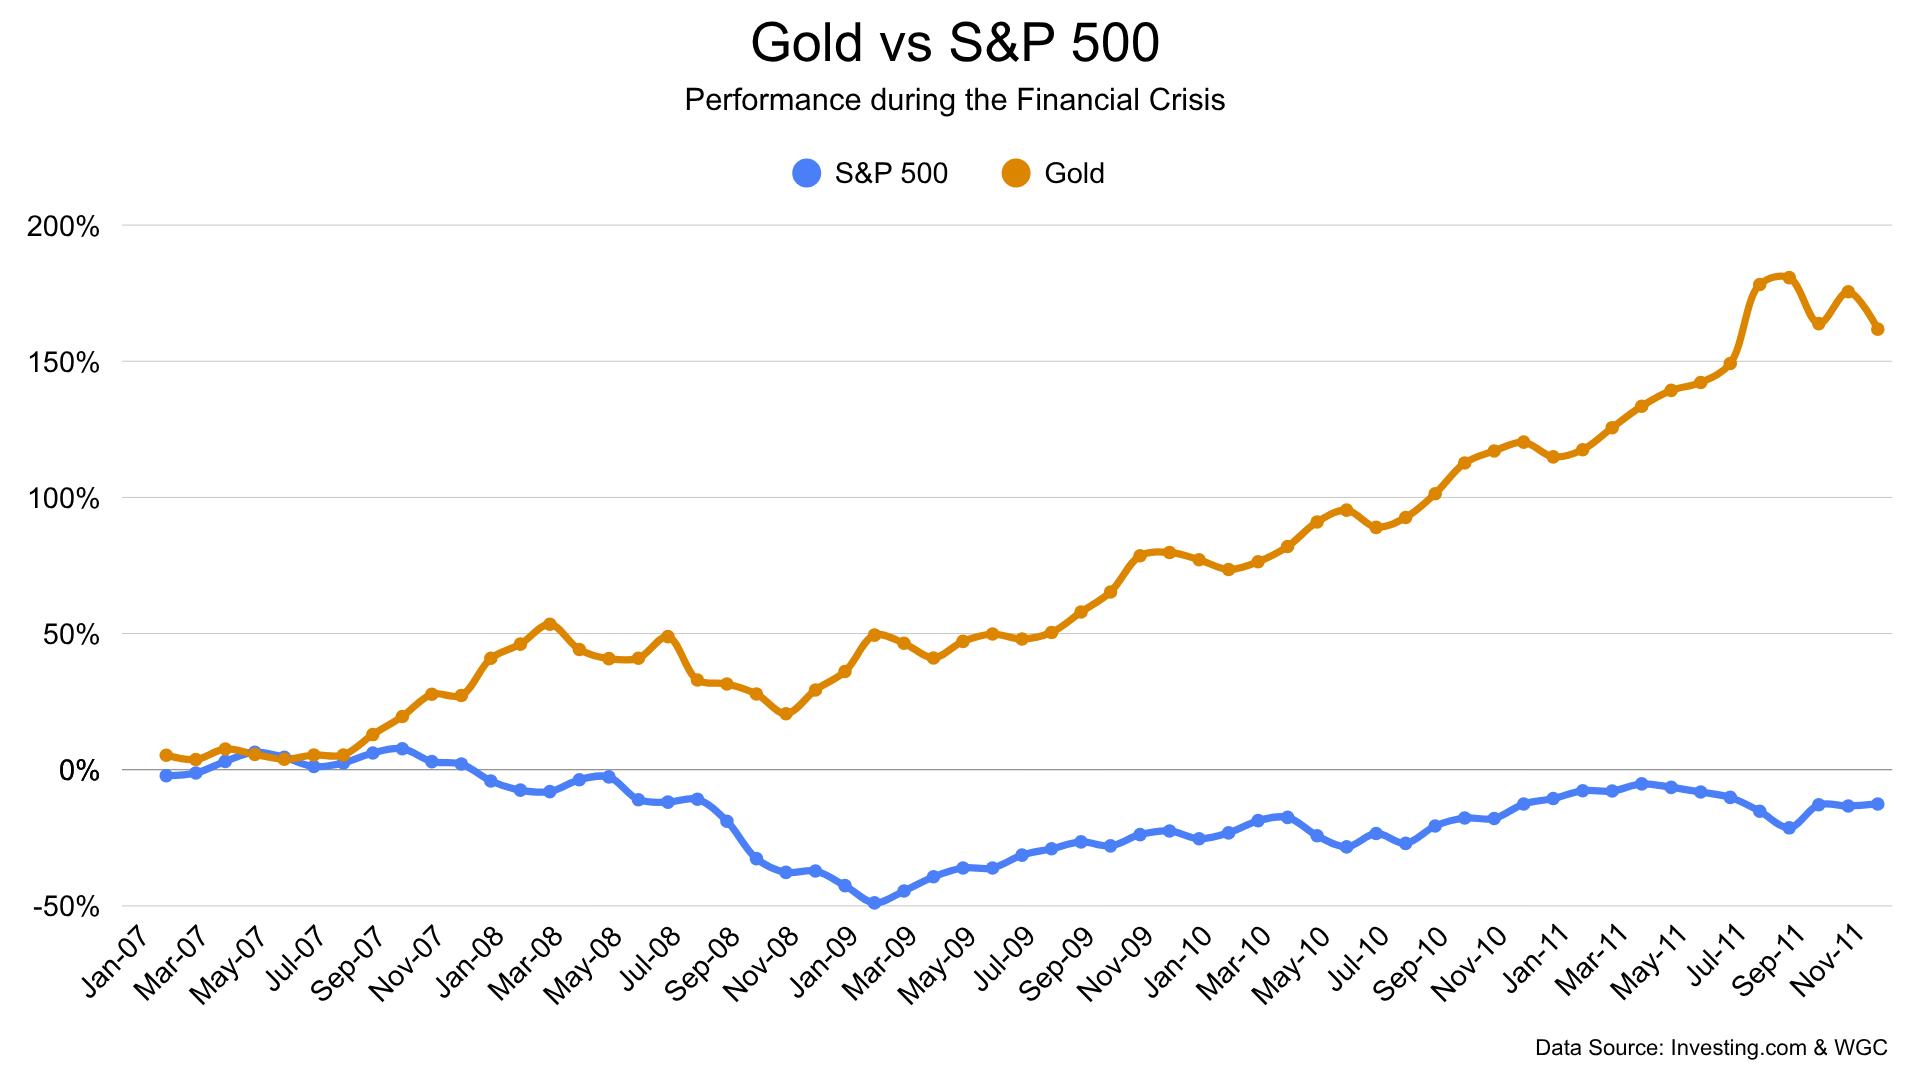
The financial crisis is one of the clearest single illustrations of gold’s role as a crisis hedge in the modern era. From the pre-crisis market peak in October 2007 to the bottom in February 2009, the S&P 500 fell 52.6% while gold rose 25%. Zoom out to gold’s eventual 2011 peak and the gap is even wider: the S&P 500 was still down 27% from its 2007 high, while gold had gained almost 135%. This is the single period most often pointed to as evidence that gold and stocks can move in opposite directions exactly when a portfolio needs it most.
2020–2026: Pandemic, Inflation, and a New Gold Rally
The most recent stretch shows the same pattern playing out with a twist. Gold rose almost 8% during the sharp Covid crash of early 2020 while the S&P 500 fell 20%, and gold held up better again through the 2022 rate-hike bear market. But unlike earlier cycles, gold’s outperformance didn’t stop once stocks recovered — from the pre-Covid peak in December 2019 through August 2026, gold is up around 182% against the S&P 500’s 139%, driven by a fresh surge from 2024 onward tied to persistent inflation concerns and record central bank buying. It’s a reminder that gold’s strong periods aren’t limited to crashes; they can extend well into a stock market recovery too.
The Honest Takeaway
None of this changes the 50-year headline: patient investors in the S&P 500 have out-earned gold over the long run, and anyone building wealth primarily through growth should expect stocks to do the heavier lifting. But the periods above explain why gold still earns a place in a portfolio alongside stocks rather than instead of them. Gold has a habit of performing best precisely when equities are struggling, which is the one thing a pure stock portfolio can’t do for itself.
Gold vs Other Stock Indices
The S&P 500 isn’t the only benchmark worth comparing gold against, and looking further afield tells an even more one-sided story. Since the start of 2000, gold has outperformed every major global stock index, not just Wall Street’s.
| Index | Region | Jan 2000 | Aug 2026 | Total Return | Annualized |
|---|---|---|---|---|---|
| Gold (US$/oz) | — | $284 | $4,160 | +1,363% | 10.6% |
| Nasdaq Composite | US | 4,069 | 26,702 | +556% | 7.3% |
| S&P 500 | US | 1,395 | 7,710 | +453% | 6.6% |
| Dow Jones | US | 11,497 | 53,905 | +369% | 6.0% |
| DAX 40 | Germany | 6,958 | 26,349 | +279% | 5.1% |
| Nikkei 225 | Japan | 18,934 | 66,970 | +254% | 4.9% |
| FTSE 100 | UK | 6,930 | 10,870 | +57% | 1.7% |
| Hang Seng | Hong Kong | 16,962 | 25,800 | +52% | 1.6% |
The gap outside the US is striking. The FTSE 100 and Hang Seng have both been notoriously sluggish over this period, each managing barely more than 1.5% a year. The Nikkei 225’s recovery is a story in itself: Japan’s benchmark spent over three decades below its December 1989 bubble-era peak of roughly 38,900, only reclaiming that level for good in 2024, which makes its 254% gain since 2000 look better than it feels to anyone who bought at the top of that earlier bubble.
2000 was a near-perfect peak for stocks and a trough for gold, which flatters gold’s numbers in exactly the way a chart starting in, say, 2010 would flatter equities. Read alongside the 50-year US comparison above, the fair takeaway isn’t “gold beats every stock market always," but that gold has held up well against developed and emerging equity markets alike over a genuinely long, volatile quarter-century.
Should You Choose Gold or Stocks (or Both)?
Everything so far points to the same conclusion: this isn’t really a choice between two competing options, it’s a question of what job you need an asset to do. Framed as gold vs the stock market in isolation, stocks win on raw growth, over any multi-decade stretch. Framed as part of a diverse portfolio built to handle more than one kind of economic environment, gold and equities have historically worked better together than either does alone.
Is Gold Better Than Stocks?
Neither is objectively “better" than the other; they’re built for different jobs. Stocks are the better tool for wealth growth, compounding through both price appreciation and reinvested dividends. Gold is the better tool for capital preservation and diversification, holding value through currency debasement, inflation, and market crises that erode stock portfolios. Most of the “is gold better than stocks" debate dissolves once you separate the question of growth from the question of protection. Gold or equities alone typically means sacrificing one for the other, while holding both means giving up neither entirely.
One simple way to see how the relationship between the two has shifted over time is the Dow-to-gold ratio. This figure states how many ounces of gold it would take to buy the Dow Jones Industrial Average. In January 1980, at gold’s stagflation-era peak, that ratio was close to 1:1. By the end of 1999, near the top of the dot-com bubble and gold’s own multi-decade low, it had stretched to around 40:1. As of August 2026, with the Dow near 53,900 and gold near $4,160/oz, the ratio sits at roughly 13:1. This is a reminder that the balance between the two asset classes swings substantially over full market cycles, in both directions.

Gold’s Structural Differences: Physical Ownership, No Counterparty Risk, and Tax Treatment
A key part of the case for holding gold alongside stocks has nothing to do with historical returns at all. Stocks and shares are a claim on a company, held electronically through a broker or exchange. The value of your shares depends on that company, and ultimately that broker or exchange, continuing to honour the claim.
Physical gold carries no such counterparty risk. A gold bar or gold coin in your possession, or held in allocated storage, is not anyone else’s liability, and its value doesn’t depend on any institution remaining solvent.
Tax treatment can also work in gold’s favour depending on where you live. In Singapore, for example, investment-grade gold, silver, and platinum qualify for GST exemption under the Investment Precious Metals (IPM) scheme, and individuals pay no capital gains tax on bullion profits. Our complete guide to investing in gold covers these structural differences, along with the various ways to hold gold, in more depth.
How Much Gold Should You Hold Alongside Stocks?
Most portfolio allocation frameworks land in a similar place: around 5–10% in gold, with equities and bonds making up the bulk of the remainder. That range isn’t a hard rule so much as a reflection of gold’s role as ballast rather than a primary growth engine. You hold enough to meaningfully cushion a portfolio during equity drawdowns like those covered above, without giving up the long-run compounding that stocks provide. Some strategies (such as the permanent portfolio) put gold as high as 25% however.
Where within that range makes sense depends on your own risk tolerance, time horizon, and view on the macro environment. Our portfolio allocation guide walks through the main frameworks and how to weigh gold against stocks, bonds, and other assets in more detail.
Frequently Asked Questions
Has gold beaten the S&P 500?
Not over the long run. Since 1978, the S&P 500 has returned around 9.6% annually on a price basis versus gold’s 6.0%. But gold has clearly beaten stocks over specific extended periods, most notably the 2000s, when the S&P 500 fell roughly 33% while gold gained around 246%.
Should I sell stocks to buy gold?
This depends on your time horizon, risk tolerance, and why you’re holding each asset. Most portfolio frameworks suggest holding both rather than switching entirely, since gold and stocks have historically played complementary rather than competing roles. Investors could sell stocks to buy gold if rebalancing their portfolio, or believe gold may be about to outperform stocks.
What’s a good stock-to-gold ratio?
Most allocation frameworks suggest keeping gold to around 5–10% of a portfolio, with stocks and other assets (such as bonds) making up the remainder. The right split within that range depends on your risk tolerance and how much emphasis you place on growth versus downside protection.
Are gold returns better in recessions?
Generally, yes. Gold has held up better than stocks in every major S&P 500 bear market since 1980, either falling by much less or rising while stocks fell. It isn’t a guarantee, though: during the 2022 bear market gold also declined, just far less sharply than the S&P 500 (down about 6% versus 25%).
Does gold pay dividends like stocks?
No, gold generates no income or yield while held, unlike stocks. As a ‘non-yielding asset’, gold performs best when real-yields for other assets are low, reducing the opportunity cost of holding gold.
Is there a correlation between gold and the stock market?
Gold’s correlation to the S&P 500 has historically been very low, and slightly negative during major stock sell-offs. That near-zero, occasionally negative relationship is the main statistical basis for using gold as a diversifier alongside stocks rather than as a substitute for them.
Did gold outperform stocks during the 2008 financial crisis?
Yes, from the market peak in October 2007 to the bottom in February 2009, the S&P 500 fell 52.6% while gold rose about 25%. It’s one of the clearest examples of gold and stocks moving in opposite directions during a major crisis.
Gold vs S&P 500: The Bottom Line
Over the long run, the S&P 500 has been the stronger wealth-building asset, compounding at roughly 9.6% a year on a price basis since 1978 against gold’s 6.0%. If growth is the only goal, that’s the honest answer, and it holds up against most major global indices too, not just the S&P 500.
But growth isn’t the only thing a portfolio needs to do. Gold’s value has shown up most clearly in the periods stocks would rather forget: the 2000s “lost decade," the 2008 financial crisis, and the sharp Covid crash of 2020. Gold also excels in the structural protection it offers that no stock can. It has no counterparty risk, no dependence on a company or broker remaining solvent, and in places like Singapore, a favourable tax treatment that stock holdings don’t share. That’s why the frameworks covered above land on holding both rather than choosing between them, typically with gold making up a modest 5–10% of a broader portfolio built around stocks for growth.
Ready to add gold to your portfolio? Browse BullionStar’s range of gold bars and gold coins, or set up AutoInvest to start building a position gradually alongside your existing stock holdings. Have questions about how gold could fit your own portfolio? Get in touch with our team at support@bullionstar.com — we’re happy to help.

Popular Blog Posts by Gold & Silver 101
 Here Are Different Ways to Invest in Gold & Silver Bullion
 An Introduction to Gold & Silver Investing
 Should I Invest in Gold, Silver, or Platinum Bullion?
 Should I Invest in Precious Metals Bars or Coins?
 Learn About Precious Metals' Exemption From Singapore's GST
 Storing Precious Metals, Gold, and Silver Bullion
 Gold & Silver Bullion Investing FAQs
 Gold vs S&P 500: Historical Performance and Investment Comparison
 Why Is Gold Valuable? The Reasons Behind Gold’s Enduring Worth
 How to Invest in Palladium: A Complete Guide