
Still Firing on All Cylinders: China’s Physical Gold Market

 Ronan Manly
 0 Comments
While headlines may be on the Sino-US trade war, China’s gold market continues to fire on all cylinders, with physical gold continuing to flow into, and through, the world’s largest gold hub.
Year-to-date, Chinese wholesale gold demand is on a par with recent years, Chinese central bank gold purchases have officially recommenced after a two year halt, and gold import data into China is now more transparent than ever before.
Shanghai Gold Exchange (SGE) Withdrawals
In China, the critical trading hub for the Chinese gold market is the Shanghai Gold Exchange (SGE). Practically all physical gold supply flows through the SGE, and on the flip side, nearly all Chinese physical gold demand is met by physical gold withdrawals from the SGE’s nationwide storage vaults. Therefore, physical gold withdrawals from the Shanghai Gold Exchange is the best proxy available for Chinese wholesale gold demand.
Based on this proxy, Chinese gold demand this year is as strong as ever. In April, 152 tonnes of gold were withdrawn from the SGE gold vaults.
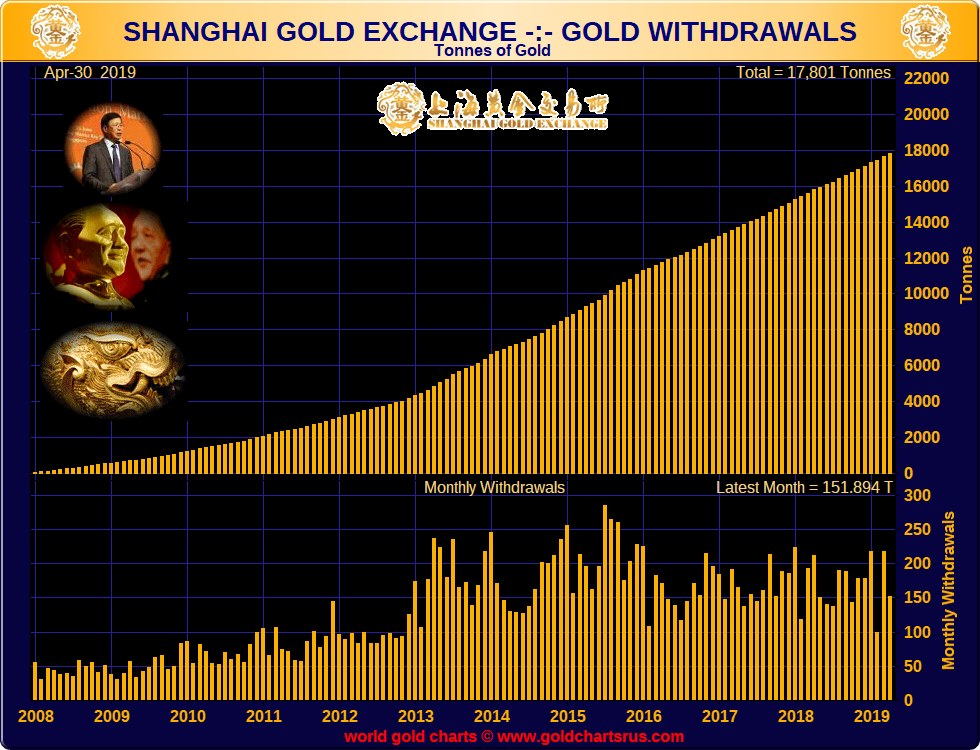
For the year-to-date from January through to April (month 4 in the chart below), 688 tonnes of gold have now been withdrawn from the SGE’s vaults. which is on a par with the same time period in other recent years, i.e. 2017, 2016, 2014 and 2013.
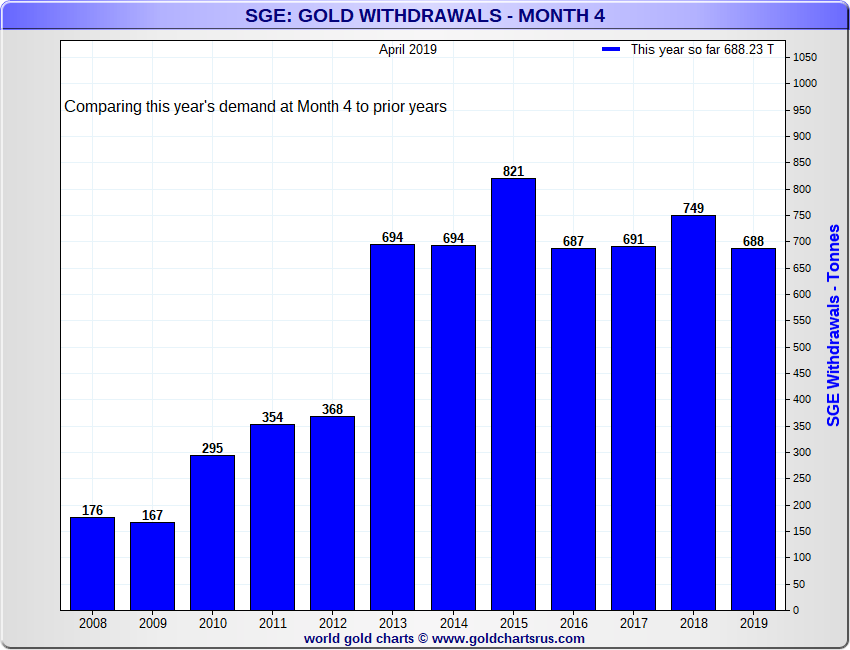
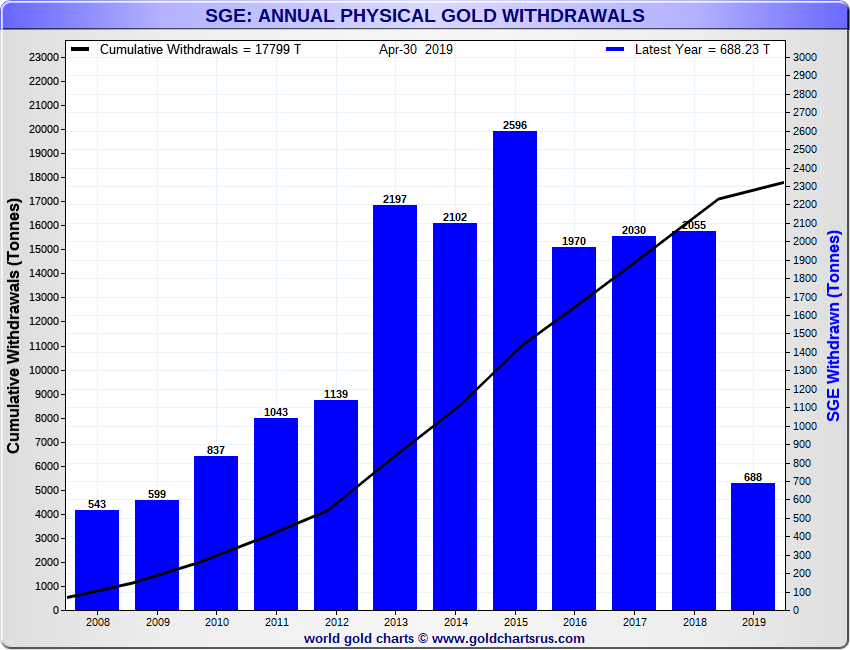
Annualising the latest January to April data also points to a huge 2064 tonnes of gold being withdrawn from the SGE gold vaults in 2019, which is on a par with actual SGE gold withdrawals in both 2018 and 2017, years in which wholesale gold demand in China reached 2055 tonnes and 2030 tonnes, respectively. See chart below.
Therefore 2019 is shaping up to be another very strong year for Chinese gold demand as physical gold continues to move from West to East.
Pole Position in global Gold Mining
Although China is the world’s largest gold producer, it still needs to meet its voracious appetite for physical gold by importing most of the gold that flows into and out of the Shanghai Gold Exchange. That is of course, apart from gold scrap / recycling output, and reverse flows of investment demand (diisinvestment). But for the most part, China meets its gold demand by importing huge quantities of gold bars from all over the world. So whatever gold it doesn’t produce domestically, China imports.
Latest figures for Chinese gold mining output for the year 2018 were released by the China Gold Association (CGA) in January. According to the CGA, China produced 401.12 tonnes of gold in 2018, making it the world’s top gold producer, a pole position it has held now for the last twelve years.
Of this 401 tonnes, 346 tonnes, or 86% of the total, came from domestic gold mining, with 55 tonnes from gold extracted from domestic base metal processing. Beyond this headline figure, China also has some other gold supply, which people tend to forget. The CGA sometimes calls this ‘gold imports’, but it also officially describes it as ‘foreign imported raw materials which produced gold’. In 2018, this imported material that produced gold totaled 112.78 tonnes. Therefore China’s overall gold supply before ‘gold bar’ imports are added, was 513.9 tonnes in 2018.
Its also important to remember that China claims to have another 13,000 tonnes of gold underground that has yet to be mined. This is according to the World Gold Council, which states that:
“China’s reserves of unmined gold are deep and growing. By the end of 2017, the country had identified gold resources and reserves of 13,195.60 tonnes."
Gold Imports – Lifting the Veil
Having recorded 2055 tonnes of SGE gold withdrawals in 2018 – i.e. roughly the same as Chinese wholesale gold demand in 2018 – China has to make up the shortfall beyond domestic gold production by importing vast quantities of gold bars, literally in the 1500 tonnes range.
Previously there was some guesswork in how much gold China imported due to the fact that China’s customs authority did not publish this data. This meant that estimates of China’s gold imports had to be derived by piecing together other countries’ gold export data to China, such as gold exports from Switzerland, Hong Kong, the UK and Australia to China.
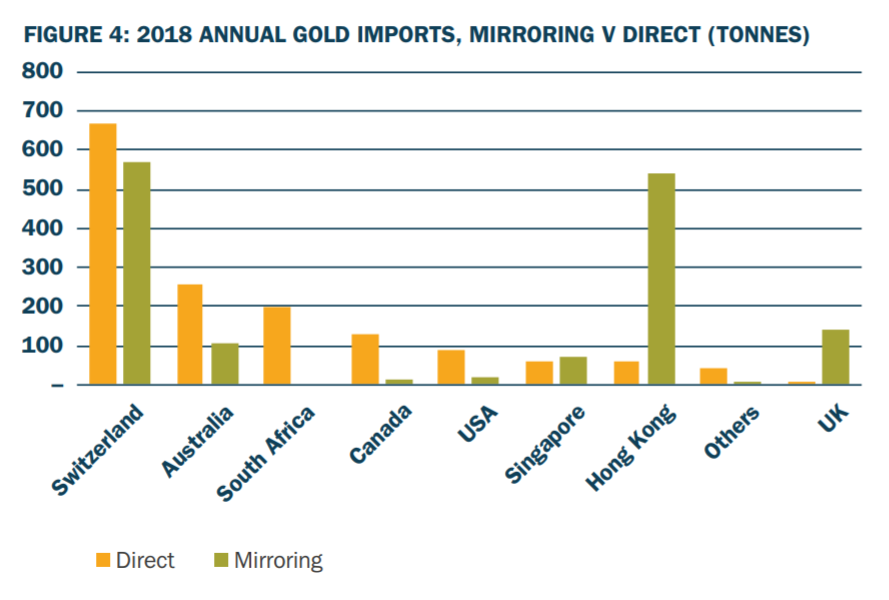
While that indirect or mirroring method was quite accurate, it didn’t tell the full story. So it was revealing to see that China has recently begun publishing gold import data in its official trade statistics, an interesting summary of which has been put together by Matt Turner of Macquarie and can be read here. Notably, this new customs data also includes Chinese gold import figures for 2017 and 2018.
For 2017, China imported a massive 1270 tonnes of gold, while in 2018 it imported an even larger 1506 tonnes of gold (which is more than half of rest of the world’s global annual gold mining output). The new gold import data also interestingly shows the original source countries of the gold bars that China has been importing, not merely the countries that the gold bars last arrived from, such as from Hong Kong. So now we know officially that a lot more gold goes into China from countries such as South Africa and Australia than could previously be fathomed.
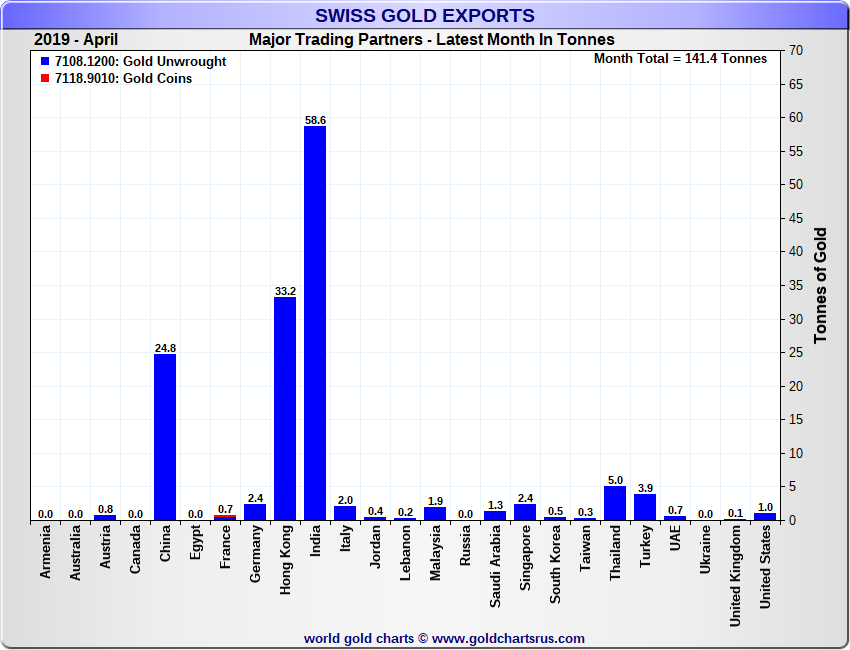
In 2018, China imported over 650 tonnes of gold from Switzerland, about 250 tonnes from Australia, 200 tonnes from South Africa, over 100 tonnes from Canada, and nearly 100 tonnes from the US. Other notable import sources included Singapore and Hong Kong. See chart below from Turner’s article.
PBoC Gold Reserves – From one side of the Vault to the Other?
But its not only the private sector which imports gold bars into China. China’s central bank, the Peoples Bank of China (PboC), imports gold bars too. However, in the case of the PBoC, like all central banks, the gold that it imports is classified as monetary gold, and is exempt from cross border trade statistics.
We also know that the PBoC buys its gold on the international market, for example in London, and flies it back to Beijing. But this gold will never show up in any trade statistics as central banks want 100% secrecy around anything to do with gold transactions.
Despite this opacity, the PBoC, for whatever reason, recommenced to update its gold reserves holdings data in January 2019, telling the world that it had bought 10 tonnes of gold in December 2018, the first such update to official Chinese state gold holdings since October 2016. Prior to December, China claimed to have 1842.6 tonnes of gold. At the end of December, 1952.6 tonnes.
The January announcement was also not a one off, for the PBoC has announced additions to its strategic gold reserves every month since then, adding 10 tonnes in December, 11,8 tonnes in January, 9.95 tonnes in February, 11.2 tonnes in March, and most recently, 14.93 tonnes of gold in April. Over the five month period that makes a total of 57.83 tonnes of gold, which now brings PBoC official gold holdings to an exact 1900 tonnes.
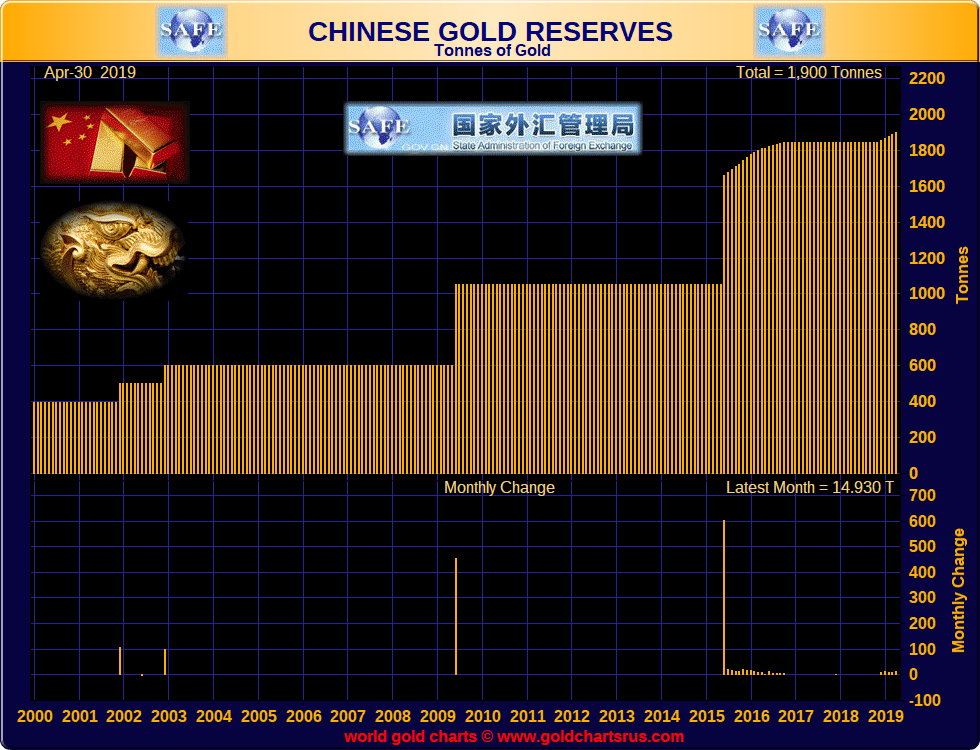
While this figure is hotly contested as being an underestimate of Chinese State’s actual gold holdings, its the only figure available, and whatever the real number, its notable that the Chinese government has revived the trend of announcing physical gold purchases each and every month.
However, over the year-to-date period, these PBoC official gold additions equate to just less than 48 tonnes, which annualised would be about 143 tonnes. This is far less than the 500 tonnes of gold per year that officials close to the Chinese administration say that it needs to accumulate to reach a minimum of 4000 tonnes to be a player on the global monetary stage.
Estimated Gold Holdings in all of China
Armed with the above, we can now update an interesting chart which Koos Jansen (now Jan Nieuwenhuijs) produced in mid 2017. in which he estimated that there were at that time just over 20,000 tonnes of gold in the entire Chinese domestic market.
Koos’ chart had assumed a jewelry base of 2500 tonnes of gold in 1994, and a Chinese central bank estimate of 4,000 tonnes. The revised chart now adds two more years, 2017 and 2018, by adding in official gold mining data for both years, and more significantly, the official gold imports for both 2017 and 2018.
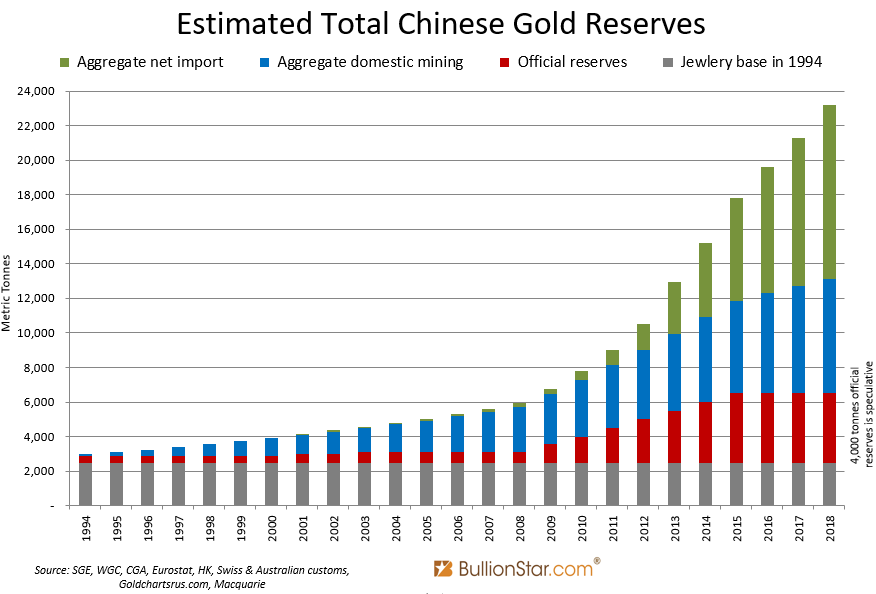
The updated chart (see above), to the end of 2018, now shows 23,215 tonnes of gold in the Chinese market, attributed to 4000 tonnes for the central bank, and 19,215 tonnes in ‘private’ ownership.
While this may seem like a lot of gold, India is estimated to have even more. During May, India’s Financial Express quoted Somasundaram PR, a managing director for India of the World Gold Council (WGC) said that:
“We conducted a study two years ago and found the household stocks at around 23,000-24,000 tonne. Now, the stocks may have touched 24,000-25,000 tonne.”
And that’s not even counting the official gold reserves of India’s central bank, the Reserve bank of India (RBI), which claims to hold another 608 tonnes of gold. So between China and India, the combined CHINDIA entity could be holding a massive 48,000 – 50,000 tonnes of gold, or even more if smuggled and undivulged gold holdings are taken into account.
Adding in a recent estimate of the amount of gold held privately by German citizens, which was 8918 tonnes, as well as the stated gold holdings of the German Bundesbank, which total 3370 tonnes, then for just these three countries of China, India and Germany, we are talking about a serious number between 60,000 and 62,000 tonnes of gold. Which is practically one third of all the physical gold which is known to exist, as estimated by the World Gold Council.
Which leaves two thirds of the world’s above ground stockpiles of gold for the the rest of the world, including the G10 central banks which have lent out a lot more than they claim to have.
Conclusion
With China in one of the driving seats of the world’s physical gold market, along with India and Russia in the other, it is opportune then that the London Bullion market Association (LBMA) has chosen Shenzhen in China as the location for its annual conference this coming October where they should have plenty to talk about as China’s gold market continues to fire on all cylinders. It also raises some questions such as why the international gold price continues to be established by the paper gold markets of London and the US COMEX. Maybe China prefers it that way.
Popular Blog Posts by Ronan Manly
 How Many Silver Bars Are in the LBMA's London Vaults?
 ECB Gold Stored in 5 Locations, Won't Disclose Gold Bar List
 German Government Escalates War On Gold
 Polish Central Bank Airlifts 8,000 Gold Bars From London
 Quantum Leap as ABN AMRO Questions Gold Price Discovery
 How Militaries Use Gold Coins as Emergency Money
 Hungary Announces 10-Fold Jump in Gold Reserves
 Planned in Advance by Central Banks: a 2020 System Reset
 Surging Silver Demand to Intensify Structural Deficit