
Gold Hits All-Time Highs Amid Huge Increase in Volatility

 Ronan Manly
 0 Comments
With less than 20 trading days left until the end of 2023, we have just witnessed a series of record-breaking price developments in the international gold price, as well as heightened gold price volatility, and the price moving in a $120 range intraday.
While a new all-time high monthly close in the US dollar gold price was achieved on Thursday 30 November at $2040/oz, and new all-time highs on the weekly close and daily close were achieved on Friday 01 December at $2072/oz, these new record highs were in hindsight, overshadowed by what happened subsequently.
For following the weekend pause of Saturday and Sunday (when gold market venues around the world are closed,) the gold market re-opened into the new trading week with a shock and awe surge to $2143, the speed and magnitude of which has not been seen for many years.
$70 rise condensed into 20 Minutes
As the gold market opened at 6 pm New York time on Sunday 3 December (11 pm Sunday London time, 7 am Monday morning Singapore / Shanghai time), this price surge began to take shape a mere 15 minutes after opening, with the gold price blasting up by $70 from $2073 to $2143 in a little over 20 minutes – that’s a 3.38% surge in the gold price in a mere 20 minutes – shattering all resistance levels in a flash, and breaking through the psychologically important $2100 level.
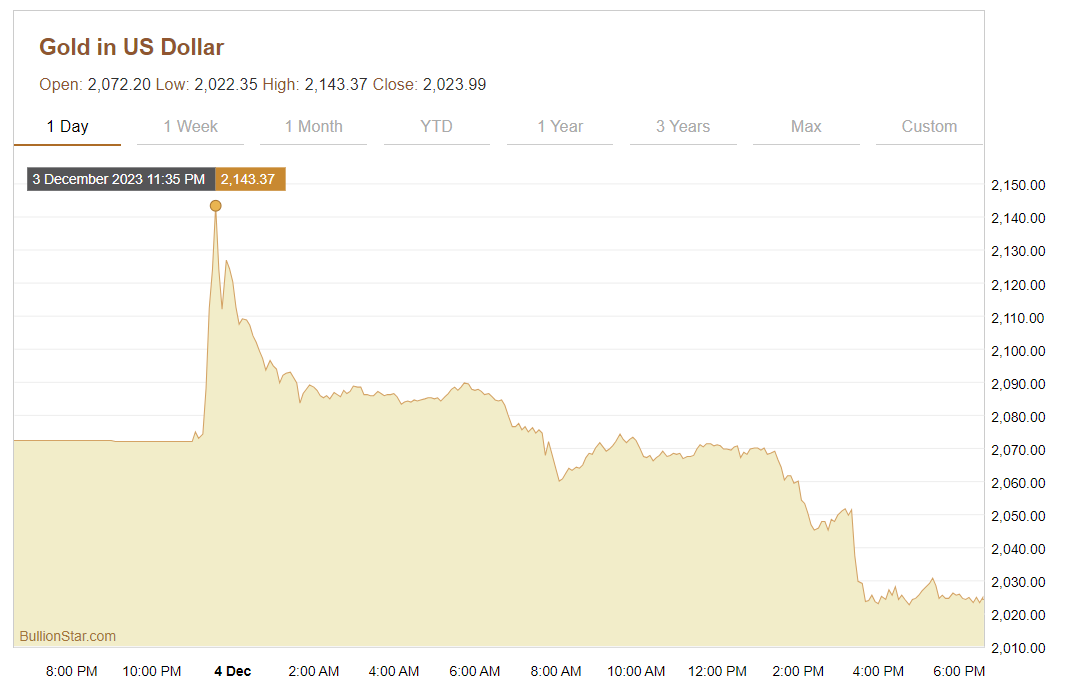
Equally spectacularly, after this price spike to $2143, the gold price went down again, as first violently, and then over the next 12 hours in a very controlled fashion.
For the record, here are the details, using New York times as the reference point. Note that the ‘gold market’ opens on Sunday evening New York time when the CME’s Globex electronic trading platform opens for gold futures trading. This is a time of relatively low liquidity as none of the world’s major gold markets are officially ‘at their desks’, although its just before the Shanghai Gold Exchange (SGE) begins trading.
Starting at 6:15 pm New York time on Sunday evening, the spot gold price rose over a 5 minute period from $2074 to $2088. Between 6:19 pm and 6:24 pm, the price then rose again from $2088 to $2112.
Then between 6:24 pm and 6:29 pm, the price increased again from $2112 to $2124. Finally, between 6:29 pm and 6:34 pm, the gold price accelerated even further from $2124 to $2143.37. To reiterate, that was a $70 surge in a 20-minute period.
Waterfall Down into LBMA Fixing
Following this surge, the gold price fell back again, initially in a whipsaw fashion. By 6:44 pm New York time, the gold price had dropped to $2112. Then at 6:49 pm, the price was up again at $2126. Then by 7:09 pm, it had fallen to $2107. By 8:09 pm, the gold price was down to $2089. There then followed a relatively calm period of four and a half hours, after which, at 12:44 am New York time Monday morning, the price was still around $2089.
Then the consistent slams began, in a steady descending waterfall trajectory. By 3 am New York time (8 am London time), the gold price was down below $2060. Importantly, this level was below the Friday 01 December all-time closing high of $2072. It could be argued that the market participants which drove the price back down were the very same participants which drove the price up to new all time highs. This would make sense if the objective was to break the positive psychology of the market, which as you will see, has been temporarily achieved.
No matter who or what drove the price up, predictably the BIS, New York Fed and bullion banks would not want a Monday morning opening gold price higher than the Friday close. Which is why, just before the morning LBMA Gold Price fixing auction at 10:30am, the gold price was still at $2067, below Friday’s market close of $2072.
COMEX – The Broken Record
Then even more predictably, as COMEX opened at 8:30am New York time, the gold price was taken even lower, being slammed down by $50 from $2069 to $2021 (by 10:30am NYT) – in the space of two hours, and again leaving the price well down as the afternoon LBMA Gold Price auction began. This was also a more than $120 fall in 16 hours from the all-time peak price of $2143.
November Monthly Closing High – Breakout Confirmed
Before looking at interpretations for the gold price action over Sunday evening 3 December – Monday morning 4 December, its important that this does not overshadow the all-time record highs in the gold price that were recorded on the monthly close (30 November) and weekly close (1 December).
On 30 November, the spot gold price closed at $2040. This was the highest monthly close ever in the gold price, and the first monthly close ever above $2000. The previous all time high monthly close was April 2023 just below $2000.
This November monthly close at $2040 was made possible by a rally which began in early October on the back of heightened middle eastern geopolitical risk (Israeli-Palestinian conflict) when the gold price was below $1820. By the end of October, the gold price, partially due to safe haven demand had rallied nearly $190 to $2007. This was followed by a two-week period in which the gold price fell to $1933.
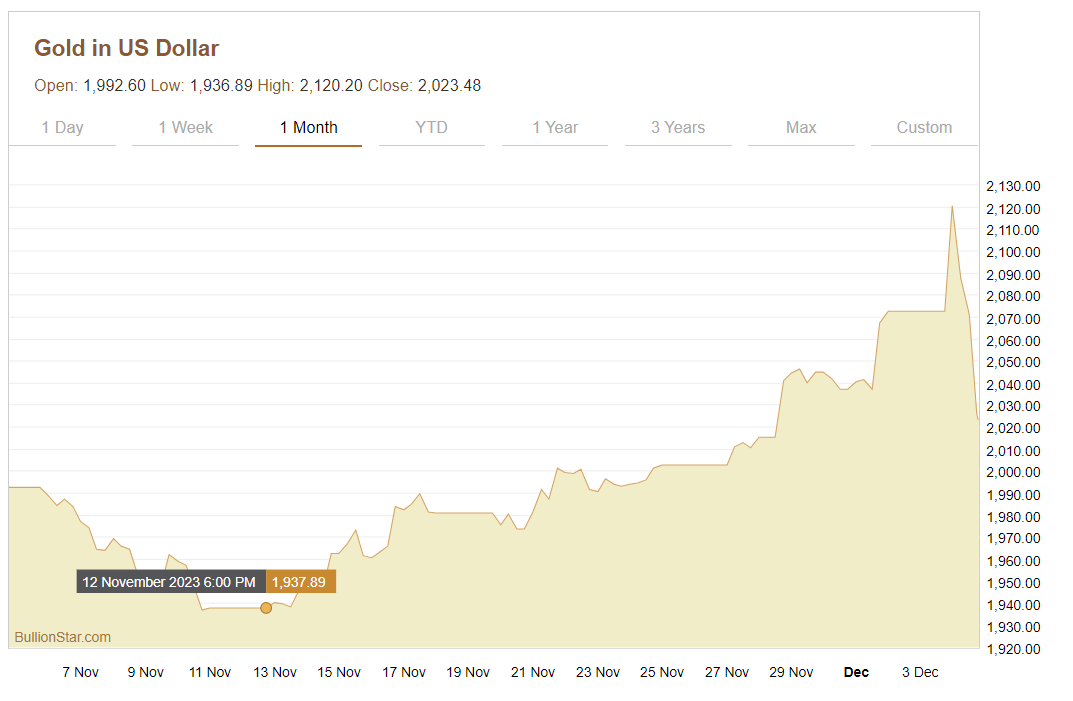
But there then followed a 3-week rally in which the gold price consistently rose all the way to $2040 to achieve the November close, i.e. a gain in excess of $100 over 3 weeks. Importantly, this November all time record close signalled a breakout in the gold price on a monthly basis, and drove the momentum which carried on in Friday’s trading session where the gold price continued higher to record a weekly (and daily) all time high close of a then staggering $2072.
All of these records of monthly, weekly and daily all-time highs in the gold price signalled a gold price breakout, and most likely caused significant positive interest across the institutional sector of financial markets, as well as consternation in the offices of Western central banks and their bullion banking agents in London and New York.
The $70 surge and $120 pullback
As to what triggered the massive surge in the gold price at opening of trading on Sunday evening 3 November, there are many theories and opinions floating about. That there would be continued gold price momentum triggered by the previous week’s new all-time highs was to be expected, but the sheer magnitude of the initial price surge from $2072 to $2143 was surprising to most.
Over the last 3 weeks, the US Dollar Index (DXY) had been consistently weakening on the back of an increased belief by financial markets that US interest rates have reached their peak. This belief strengthened even more late last week with US Treasury bond yields falling (which indicates the market believes in the interest rate peak version of events) even though the US Fed’s Powell was still jawboning on 01 December about further possible rate hikes.
This perception by markets that US rates have peaked arguably fed into the gold price momentum seen on Sunday evening / Monday morning.
Over the weekend of 2-3 December, there were further geo-political developments which have heightened middle eastern geopolitical risk even more, this time in the form of Yemen’ Houthis attacks on ships along the strategically important Red Sea shipping routes, with the US claiming the attacks are Iranian-backed. The fear here with this heightened geo-political risk is that this could escalate the middle east into a hot regional war involving the US, Iran and even other large nations (such as China or Russia). The gold price would naturally amplify these new and escalating geo-political risks.
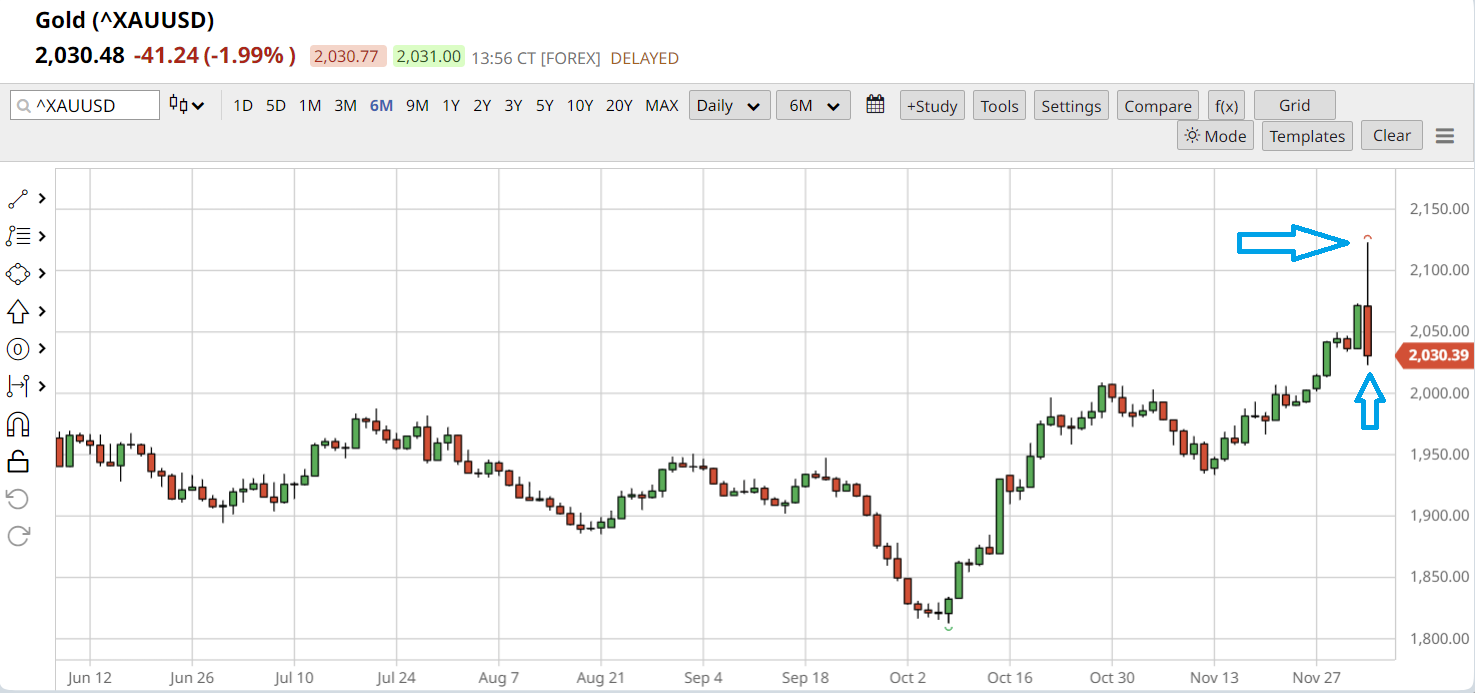
But were the same bullion banks which took the price down, also responsible for driving it up in the thin liquidity hours of early Monday morning Asian time before, Shanghai had opened? And why would they do this?
The answer would be to paint the tape with such a hugely plummeting daily candle pattern, that it would break the psychology of the market, at least in the near term.
Look at this candle chart and you will see the massive wick up on 4 December, but a close near the low.
BRICS +: January 2024
However, don’t forget that in a mere few weeks in early January 2024, there will be 6 extra countries joining BRICS, with Saudi Arabia, Iran, the UAE, Egypt, Ethiopia and Argentina all scheduled to join the existing BRICS group of China, Russia, India, Brazil and South Africa to form an 11 nation grouping of BRICS +. Given the widely held expectation that gold will play some role in a future trade settlement mechanism between these countries, so if western central banks and bullion banks were pushing the gold price up into the 2100 range and then also ramming it down, they are playing with fire, as they may be unleashing price action that they can no longer control.
The Real Risk Free Asset – Gold
A few weeks ago I had a conversation with a good friend who is a fund manager in the precious metals sector, and he succinctly explained what would happen once the gold price broke out to new all time highs.
“The reason why they manage the US dollar gold price is to make sure that the market doesn’t know what risk free is. And that’s what’s about to happen, when gold breaks higher to new all time highs. The veil will be lifted.
Look at the difference in the behaviour of central banks which buy gold because they know it is risk free, and financial markets who pretend that treasuries are risk free.
So the minute that the dollar gold price gets to new all time high territory, it’s a massive signal to financial markets about what risk free really is, and most importantly about what it isn’t, which is treasuries.
So this is why they have to cap, or use hawkish language, to get the dollar gold price down.”
With these new all time highs in the US dollar gold price, will the Wall Street and City of London institutional money finally start waking up to this simple and intuitive risk free explanation which has been lost on the financial markets but which is an axiom amongst central banks?
Conclusion
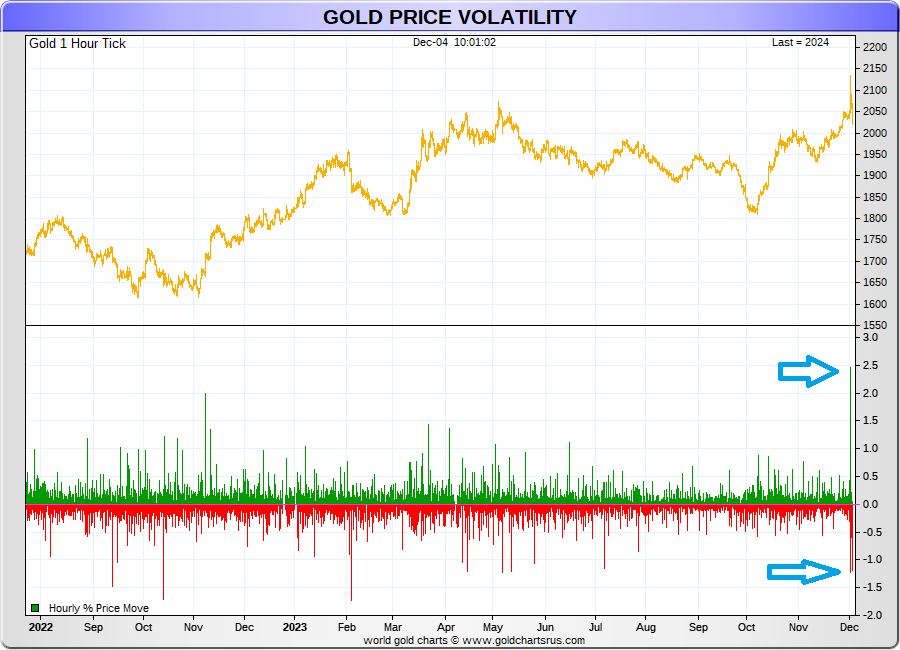
The wild gold price movements of 3-4 December 2023 have been far more volatile than gold price movements in many years. This can be seen in the following gold price volatility chart from Nick Laird’s website GoldChartsRUs which shows hourly % gold price moves over 500 trading days. Notice the huge spikes in hourly price volatility on the extreme right hand side of the lower chart. This will also be a good excuse for the CME to raise margin requirements on COMEX gold futures.
Whatever the trigger(s) for the gold price move to over $2140, we have now seen how the western paper gold markets have reacted, since during the London and COMEX trading hours on Monday 4 December, the gold price has been slammed back down to near $2020, below where it was trading on Thursday 30 November.
This $120 intraday down move following the rapid $70 up move clearly indicates that gold is the preeminent monetary asset and is of massive interest to both the western central banks and bullion banks, and to the eastern central banks, and that the gold will move wildly if it becomes a global fight between two sets of competing world powers.
Back in November 2010, the late Jim Sinclair (Mr. Gold) was quoted as having said that:
“I think from this point forward you are going to see unprecedented volatility. You’ll see $100 swings to $150 swings in a day, and if you go back to 1979 to 1980 we had $150 in one direction. So if we had $150 in one direction back then, what’s to stop this market from doing $300?”
While Jim’s prediction may have been a few years off, maybe now we will see what Mr. Sinclair envisioned.
Whatever the timeline, the remaining trading days of December in the run up to the New Year will be interesting to all gold market observers, as will gold market developments in 2024. We are definitely living in interesting times as far as the gold price is concerned.
As Robert F. Kennedy said in a speech in Cape Town in 1966:
“There is a Chinese curse which says ‘May he live in interesting times.’ Like it or not, we live in interesting times. They are times of danger and uncertainty; but they are also the most creative of any time in the history of mankind.”
Popular Blog Posts by Ronan Manly
 How Many Silver Bars Are in the LBMA's London Vaults?
 ECB Gold Stored in 5 Locations, Won't Disclose Gold Bar List
 German Government Escalates War On Gold
 Polish Central Bank Airlifts 8,000 Gold Bars From London
 Quantum Leap as ABN AMRO Questions Gold Price Discovery
 How Militaries Use Gold Coins as Emergency Money
 Hungary Announces 10-Fold Jump in Gold Reserves
 Planned in Advance by Central Banks: a 2020 System Reset
 China’s Golden Gateway: How the SGE’s Hong Kong Vault will shake up global gold markets