
BullionStar Fiscal 2015 – Year in Review

 BullionStar
 2 Comments
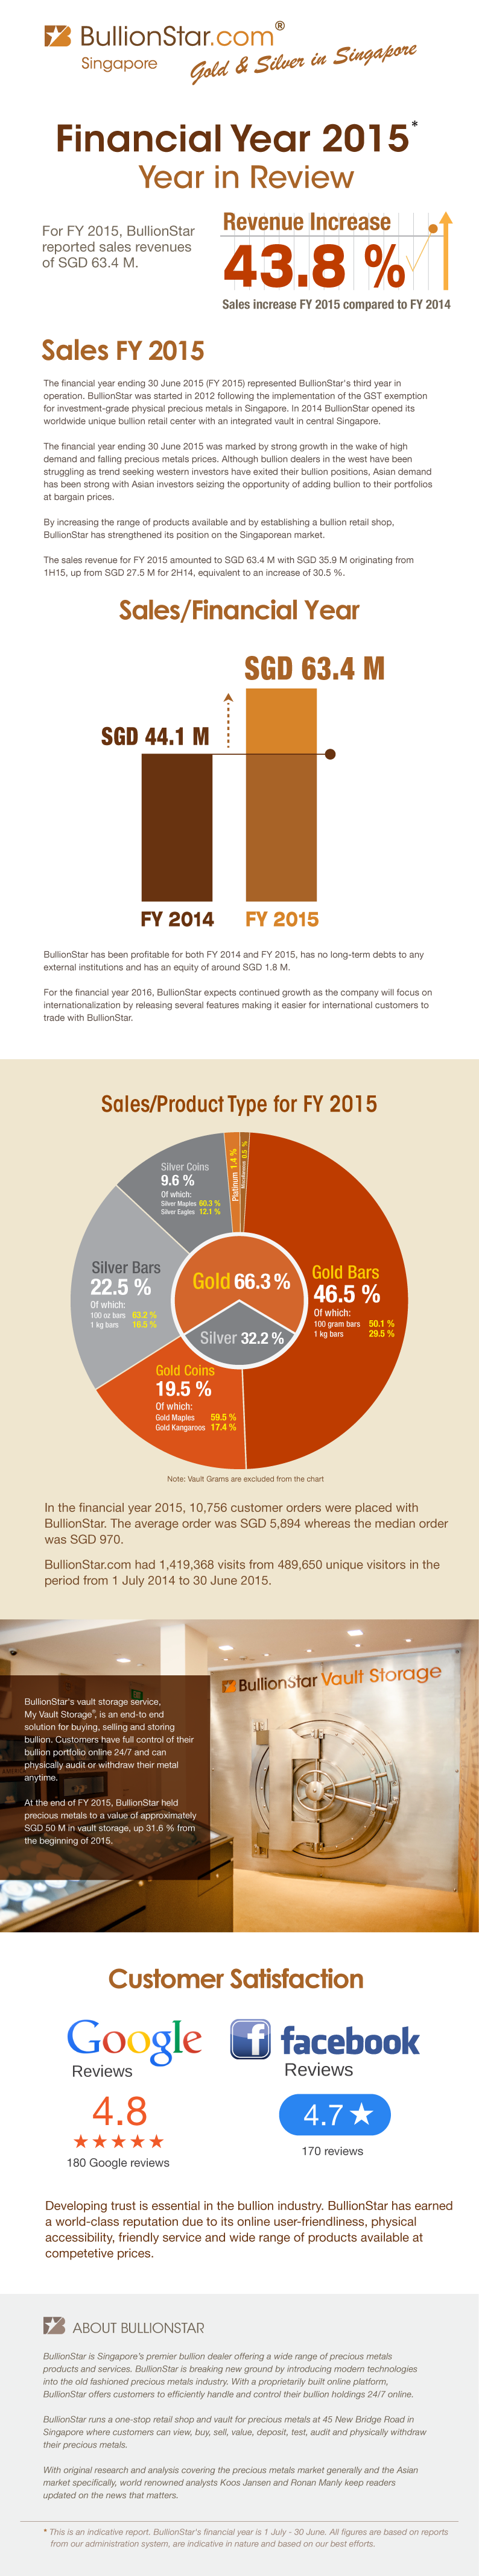
BullionStar reported sales revenues of SGD 63.4 for FY 2015, up 43.8 % compared to FY 2014. The infographic below shows some of the highlights of the BullionStar’s financial year 2015.
Popular Blog Posts by BullionStar
 How Much Gold is in the FIFA World Cup Trophy?
 Essentials of China's Gold Market
 Singapore Rated the World’s Safest & Most Secure Nation
 Infographic: Gold Exchange-Traded Fund (ETF) Mechanics
 BullionStar Financials FY 2020 – Year in Review
 Important Update 19/02/2026 – Reduced Minimum Orders & Price Premiums
 Service Update 31/01/26 – A message from BullionStar’s Chairman/Founder
 BullionStar Announces Record Global Revenue of SGD 761.1M in FY 2025
 Silver Enters 2026 in a State of Structural Breakdown
 BullionStar Update: Extreme Demand, Silver Supply, and Market Conditions