
Physical Gold Demand at Record; Paper Gold Price Disconnect

 Ronan Manly
 0 Comments
The last trading day of February wrapped up one of the worst weeks for stock markets within the last 20 years, with US and worldwide equity markets reeling amid a deep and sustained selloff triggered by the explosion of clusters of coronavirus (COVID-19) cases outside of China, and the markets’ fear as to how this will impact global economic growth, trade flows, supply chains and earnings.
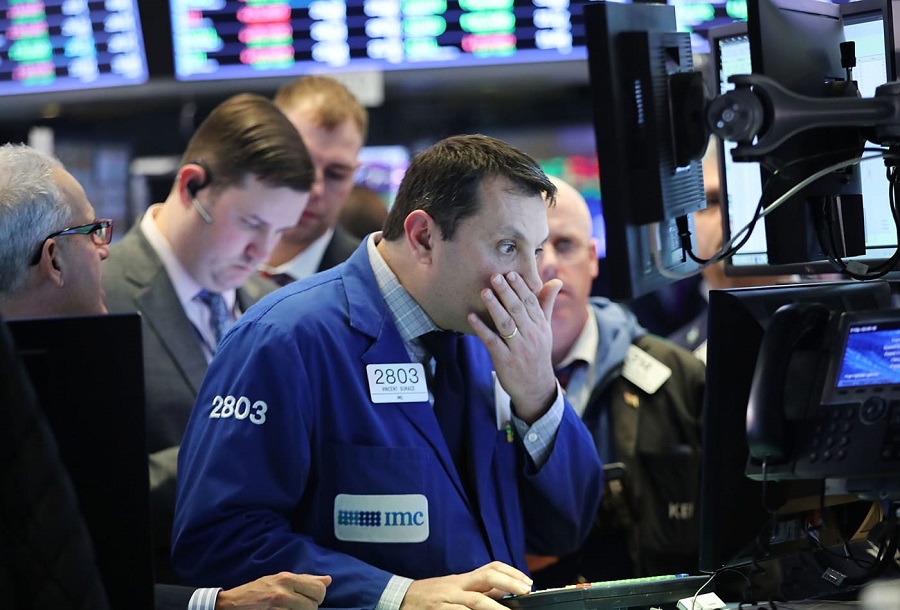
Panic on Wall Street
Over the week from 24 February to 28 February, US stock market indices entered correction territory with the benchmark Dow Jones Industrial Average (DJIA) falling 12.4% on the week, the broader S&P 500 index closing 11.5% lower, and the NASDAQ Composite off by 10.5% lower over 5 day trading period. ‘Buying the dip’ was nowhere to be seen with the Dow and the S&P falling during seven straight sessions into Friday’s close and all three indices recording the worst weekly performance since 10 October 2008 at the height of the global financial crisis.
Equity markets across Europe and Asia followed suit, with the FTSE 100 in London down 13% on the week, the pan-European Stoxx 600 index 12.7% lower, and Japan’s Nikkei 225 off by 9.6%. Other Asian centers reflected a similar rout, with indices from Hong Kong’s Hang Seng to Singapore’s Straits Times index all ending the week substantially lower in a sea of red.
As stock prices fell, stock market volatility soared, with the CBOE Volatility Index (VIX), the US market’s ‘fear gauge’, spiking to as highest level since the 2008-09 financial crisis. Oil prices also plunged on the back of fears over a contraction of economic and transport activity, and the WTI Crude benchmark price down more than 16% on the week, also its worst weekly percentage fall since 2008.
Amid this fear and flight from risk assets, sovereign bond prices such as the US were bid up on safe-haven demand and yields on US treasuries plummeted, with the yield on the US 10-year treasury falling on Friday to a record low of 1.16%, and 2 and 5 year US treasury yields falling below 1%, which in turn prompted market expectations of imminent official interest rate cuts.
The stock market slump and bond yield action also promoted the US Federal Reserve to uncharacteristically release a short statement Friday afternoon in which it tried to talk down the fear while signaling Fed rate intervention:
“The fundamentals of the U.S. economy remain strong. However, the coronavirus poses evolving risks to economic activity. The Federal Reserve is closely monitoring developments and their implications for the economic outlook. We will use our tools and act as appropriate to support the economy.”
This statement and the bond yield moves point to financial markets now looking for a US rate cut of between 25 and 50 basis points. Whether this will be at the Fed’s next scheduled meeting on 18 March or even sooner remains to be seen.
Golden Mirage
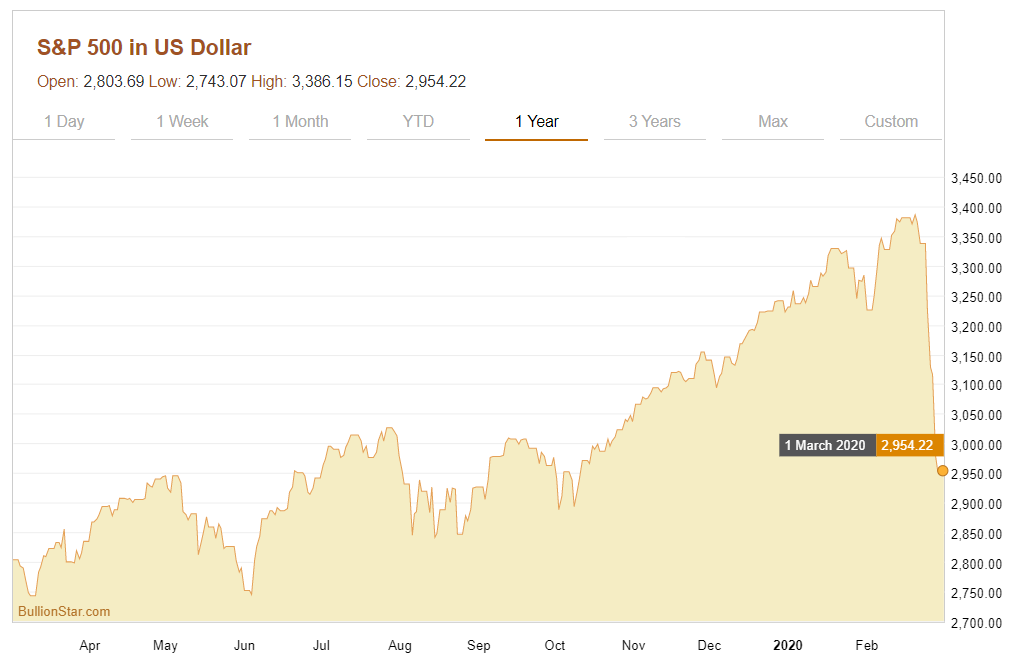
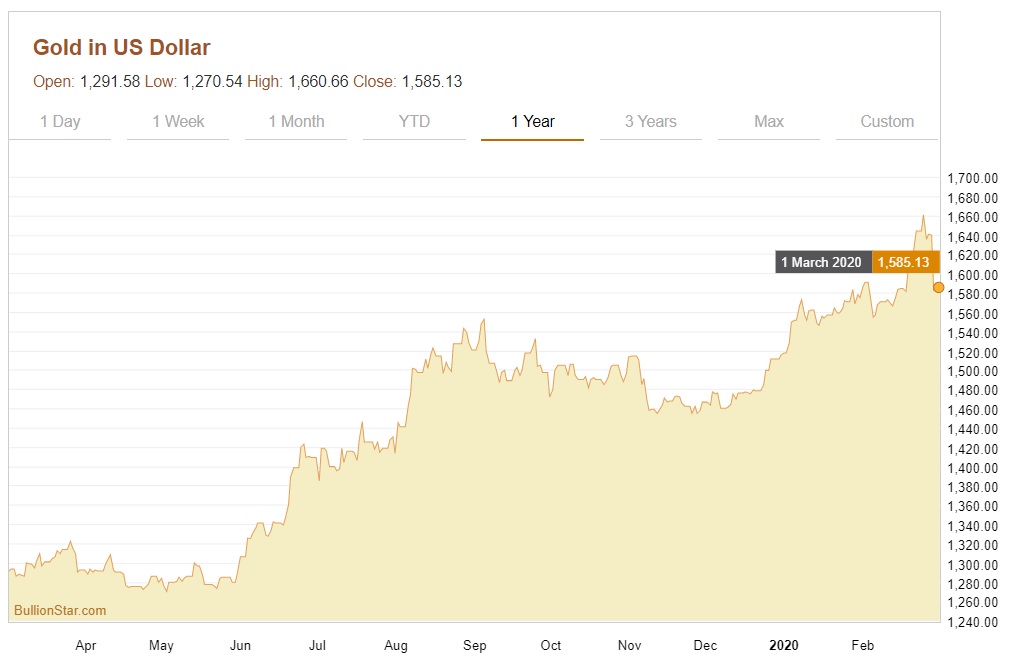
But what about the gold price in all of this and of gold’s reaction to recent market volatility? Firstly, it’s worth mentioning that over the last year, the US gold price had been performing strongly, independent of any coronavirus related news coming out of China or elsewhere. For example, during 2019 the US dollar gold price took out key psychological levels, rising up through each of the 1300, 1400 and 1500 marks. Early this year saw this trend continuing with the US gold price reaching the 1580 level two weeks ago. As stock market levels began keeling over in the week beginning 17 February, the upward trajectory of the US dollar gold became noticeably steeper, with the gold price ending on Friday 21 February at the 1644 mark.
Beginning 24 February, the day in which global stock market fear really took hold, gold, not surprisingly opened markedly higher at Asia market open, spiking up to 1686.5 at one point in the early trading day.
Notably, this was a seven year high in US dollars (since 23 January 2013), and also an all-time-high (ATM) in a whole host of major fiat currencies such as the Euro, Australian dollar, Canadian dollar, Japanese yen, Swedish krona, New Zealand dollar, Indian rupee, Brazilian real, South African rand, Danish krone, Indonesian rupiah, Malaysian ringgit.
However, Monday’s intraday high didn’t hold, with COMEX futures prices (GC COMEX 100 oz gold futures) dropping in afternoon trading. Over the next three days from Tuesday to Thursday, during which US and global markets continued to plunge, the US dollar gold price chopped sideways in the 1630-1650 range, continually hitting a ceiling in the 1650 zone. Unable to break through this ceiling, the US dollar gold price then turned lower on Friday, coming under extreme pressure on the COMEX with gold future prices falling more than 4.6% during the day, the worst one day percentage loss in gold prices since November 2016.
Closing the week at about 1585, this meant that over the week from Monday to Friday there was a $100 gold price reversal with the bulk of the impact on Friday. An uncharacteristic price pattern for a safe-haven asset in times of extreme market crisis. Unexpected enough for mainstream financial news agencies to question the price action, with for example Bloomberg pondering that:
“It is an odd moment for gold to be tumbling. One of the oldest and most-trusted safe havens in times of crises, gold typically rallies amid nasty stock sell-offs like the one that has gripped the world this week.”
Likewise, MarketWatch noted that:
“Gold prices have been acting a bit strange lately, with the haven metal plunging in the face of a dive in global stock markets hit by the spread of COVID-19”
Kitco thought likewise noting that:
“The safe-haven metals bulls are confounded [that] their markets cannot catch a bid amid the very keen risk aversion in the marketplace that sees world stock and financial markets in turmoil.”
Odd, strange, confounded? Perhaps, but only if you don’t realize that ‘the gold price’ is not a price derived from physical gold transactions, it is rather a price derived from leveraged paper gold transactions which exist in unlimited supply. So what caused this gold price fall and where did it occur?

A Tale of Two Gold Markets
The ‘where’ in the answer is simple. As explained in “What sets the Gold Price – Is it the Paper Market or Physical Market?”, the international gold price is established in the trading venues that have the highest trading volumes, and these trading venues are COMEX futures gold trading centred in New York, and over-the-counter (OTC) unallocated gold trading centred in London, both of which are forms of derivatives or paper gold trading, and neither of which are directly connected to the physical gold market. This means that the physical gold market is a price taker, and these derivative markets are the price makers.
Given that international gold price discovery takes place on derivatives markets which have little or no connection to the physical gold market and that the prices are merely blips on a screen (screen gold), we can therefore say that the gold price plunge last Friday was driven by trading in these markets, led by the COMEX, and also that the gold price fall last Friday was unconnected to the physical gold market.
While the mainstream financial press will never question gold price discovery or the difference between screen gold and physical gold, they do predictably try to come up with reasons to explain price movements. Unfortunately, most of these reasons are often not based on anything other than off-the-cuff the remarks of stockbrokers, trading desks, and buy side investment bank analysts. Unfortunately also, by not explicitly distinguishing between prices derived in an electronic casino and the real physical safe haven asset of tangible gold, the reasons provided by these reporters will fall into the trap of jumbling up two different things.
Margin, Leverage and Screen Gold
And so, as COMEX gold futures prices were plunging on Friday when according to reporters ‘gold’ should be a safe haven asset, their verdict was that ‘investors’ were selling their ‘gold positions’ to cover margin calls and losses in equity markets.
“Gold investors don’t want to sell but are forced to cover the losses in other asset classes” said Bloomberg.
“Gold has become the asset of choice among investors to generate cash” said MarketWatch.
“Traders and investors are using gold like an ATM machine as the week winds down, selling to generate cash as they book profits or need to raise money to meet margin calls and offset losses in other markets” said Kitco.
The flaws in these statements should be obvious to anyone who owns physical gold. Long term savers and investors who are long physical gold do not sell the gold if their stock portfolios are plummeting. The reason they hold the tangible gold in the first place is that it is an asset without counterparty risk that acts as financial insurance against crisis driven losses in the wider financial markets.
Kitco’s Jim Wyckoff was closer to the truth:
“Gold futures traders are also playing a big part in the overall gold market’s selling pressure this week. Reason: Futures trading is highly leveraged.”
For example, Bloomberg quoting a view from Commerzbank wrote:
“It’s bloodshed,” Commerzbank AG analyst Carsten Fritsch said by phone Friday. “It first started with forced selling from equity investors who also sold their gold positions to cover their losses in equities and also to cover margin calls. Gold investors don’t want to sell but are forced to cover the losses in other asset classes”.
However, beyond various ‘hearsay’ reasons, none of the financial news reports put forward evidence as to who were these investors that were selling their gold. Who are these traders that have leveraged positions across multiple asset classes that they need to liquidate their gold position to pay margin calls across equity or equity futures positions? Mainstream media sources fail to say.
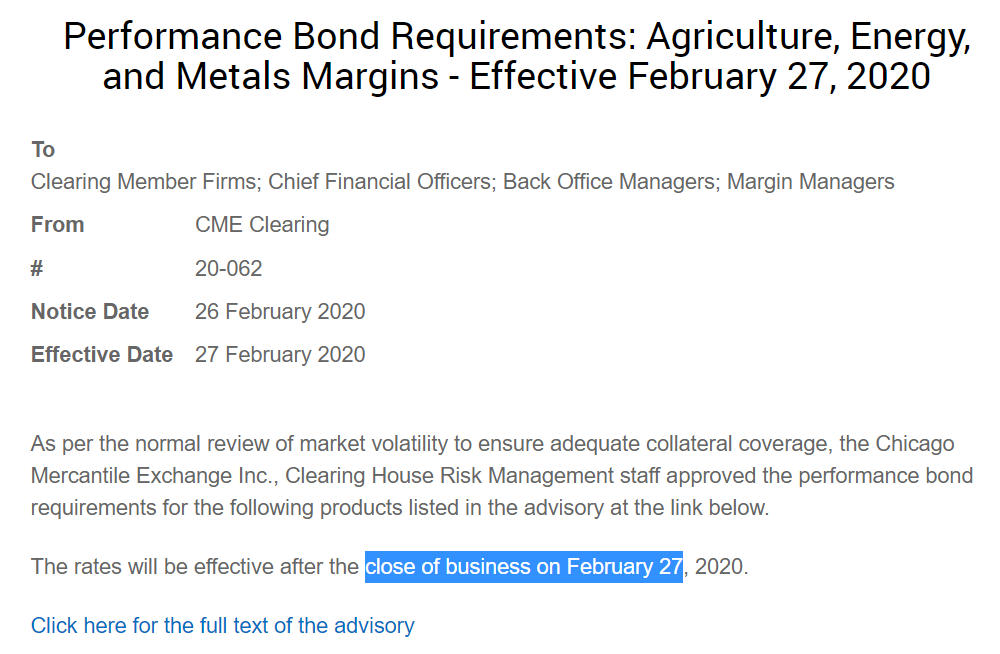
Perhaps Friday’s Comex price fall had something to do with the CME Group raising margin requirements on Thursday 27 February, where they raised maintenance margins on the Comex 100 oz gold future (GC) by 10% from 5000 to 5500, claiming it was a “normal review of market volatility to ensure adequate collateral coverage“. Those margin changes went into effect at close of business on Thursday 27 February (effective as of Friday 28 February). So the stress of higher margin requirements could be a contributing factor to the Comex selloff.
Given that the price we’re talking about paper gold futures price, margin calls may be an explanation for a falling gold price, but if that’s plausible, so too is the possibility of a group of bullion bank trading desks (commercials) which are collectively short gold futures contracts and want lower month-end prices, being motivated to push futures prices lower and by doing so trigger stop losses.
Break the Psychology
Not surprisingly, no mainstream market reports mention anything about possible gold price manipulation being part of Friday’s COMEX selloff, but this is something that is real and proven as was just explained this week by Jim Rickards:
“The easiest way to perform paper manipulation is through COMEX futures. Rigging futures markets is child’s play. You just wait until a little bit before the close and put in a massive sell order. By doing this you scare the other side of the market into lowering their bid price; they back away.
That lower price then gets trumpeted around the world as the “price” of gold, discouraging investors and hurting sentiment. The price decline spooks hedge funds into dumping more gold as they hit “stop-loss” limits on their positions.”
A targeted takedown of gold futures prices would make month-end squaring of short gold positions easier to stomach for investment banks. Likewise, a lower gold price at the end of one of the worst weeks in stock market history would also lower the “chatter” level about year-to-date gold price performance in light of the ongoing stock market rout, something which would also benefit monetary authorities and central banks who have what sometimes looks like a psychopathic need to cool the gold price. Think this is fantasy? Not according to the likes of the Bank of England have who documented in minute detail the desire of BIS/G10 central bankers to do just that, for example:
“there is a need to break the psychology of “the market can only go one way and that is up”
“at a critical time holding [the gold price] within a target area.”
“Market intermediation should allow the G10 to move with the price while attempting to control its pace”
We can therefore say that for the COMEX gold price fall on Friday, margin calls and related factors and commercial short selling could have all been contributory factors.

Gold Futures Price Undiscovery
While proven that prices are manipulated in the London paper gold market and COMEX gold futures market, this is only a small part of the story. A far bigger problem for the worldwide physical gold market is that price discovery in the gold market is not working and the entire market structure of the financialized gold trading market is flawed.
Essentially there are two sets of gold markets – on the one side the leveraged COMEX gold futures and London OTC unallocated gold spot markets which create gold synthetics out of thin air, and on the other side the physical gold markets. Physical gold markets inherit prices that are derived in the paper gold markets. Physical gold markets have no effect on the international gold price.
Given a broken gold price discovery process, this process cannot signal physical gold demand and supply correctly. For example, last week BullionStar saw unprecedented demand for physical gold, but this was not reflected in the lower gold price as derived by COMEX. There is therefore already a disconnect between the physical and paper gold markets, with high physical demand at the same time as a falling paper market gold price. Price discovery is therefore already malfunctioning. Broken price discovery processes also inevitably lead to failure because price signaling fails to incentivize suppliers and fails to reflect physical demand.
If the high physical demand which we are seeing leads to physical gold shortages in the market, there is a risk of the physical price decoupling from the paper price. Lower paper gold prices in the presence of continued high physical demand would also affect suppliers (e.g. refiners, mints and wholesalers) that hedge.
If paper gold prices continue to go lower in the presence of continued high physical demand, more paper market participants would want to convert their paper (unallocated positions and futures) into physical holdings. Given the very small physical gold stocks underpinning the London OTC and COMEX markets, an increase at the margin in conversions could overwhelm the ability of the paper markets to deliver physical (COMEX deliverable contracts and allocating from unallocated in London). This would then seize up the paper market price, the paper market would collapse, and pricing would switch to physical.
Conclusion
At this juncture it is worth summing up what can be observed from the recent activity of the gold market and wider markets.
Despite the gold futures influenced drop in the ‘gold price’ last week, the US dollar gold price is still up strongly, with a year-to-date (YTD) return of 4.47%. Compare this to stock markets where, for example, the S&P 500 index is down -8.56% year-to-date (YTD), and the the Dow Jones Industrial Average down 11% YTD.
Not to forget that gold in US dollars, at the time of writing ($1585) is still up more than 20% over 1 year.
Over the last week, the gold price has made new all-time highs in many major currencies, which has benefited the many savers and investors in gold whose home currencies are those other than the US dollar.
In the current environment, physical gold demand is overall very strong. As mentioned, physical gold demand was actually at record levels at BullionStar over the last week.
However, the gold price is unfortunately unreflective of the physical market. Why? Because to reiterate, the gold price is set in the paper markets such as COMEX and not by physical gold trades. Unbacked gold synthetics and gold derivatives are determining the ‘gold price’ and not high physical gold demand.
This heightened volatility in the paper gold markets is at the same time pushing premiums on physical investment gold higher. Premiums are rising exactly because the COMEX derived gold price is not reflecting the high physical demand that is out there.
On the wider physical market, physical gold flows are continuing into gold-backed ETFs. On Friday as the COMEX created gold price fell sharply, were there outflows from the physical gold holdings of ETFs such as the mammoth SPDR Gold Trust (GLD)? No. The gold holdings changes of the GLD on Friday 28 February were exactly Zero.
Eastern central banks such as the Bank of Russia continue to accumulate physical gold.
Interest rates around the world keep falling, real interest rates are negative, and further central bank monetary stimulus and interest rate cuts appear imminent.
If the paper gold price declines in an environment of continued sustained physical gold demand, there is a risk of a potential disconnect between paper and physical gold prices.
Physical gold continues to be a safe-haven asset that protects against market risk, geo-political risk and uncertainty. With negative interest rates and further central bank easing on the horizon, the monetary system is broken. Add to this the possibility of the physical gold supply tightening due gold market mis-pricing. In the current risk environment, regardless of the gold price, it is arguably a good time to buy physical gold.
Finally, in heightened risk environments, gold prices are more volatile and can and do move quickly. For example, in August 2011, the US dollar gold price moved up from 1650 to 1900 in less than three weeks (2 August – 22 August 2011). It then fell by nearly 200 dollars in a matter of days (by 25 August 2011), only to rebound again by over 200 dollars (by 5 September 2011).
During the stock market rout of October 2008, US gold prices, led by COMEX trading, also fell, retreating from more than $900 to nearly $700 in a little over two weeks. On that occasion too the price falls were attributed by the financial media to margin calls by traders and covering losses elsewhere. But on that occasion the gold price fall was brief, unlike stock markets which continued to lurch lower and would take two years to recover. Less than three months later the US dollar gold price had recovered all of that ground and was back above $900, and critically then began its climb to an all time high of $1900.
Popular Blog Posts by Ronan Manly
 How Many Silver Bars Are in the LBMA's London Vaults?
 ECB Gold Stored in 5 Locations, Won't Disclose Gold Bar List
 German Government Escalates War On Gold
 Polish Central Bank Airlifts 8,000 Gold Bars From London
 Quantum Leap as ABN AMRO Questions Gold Price Discovery
 How Militaries Use Gold Coins as Emergency Money
 Hungary Announces 10-Fold Jump in Gold Reserves
 Planned in Advance by Central Banks: a 2020 System Reset
 China’s Golden Gateway: How the SGE’s Hong Kong Vault will shake up global gold markets