
As 2020 Ends, Gold & Silver Record Best Year Since 2010

 Ronan Manly
 0 Comments
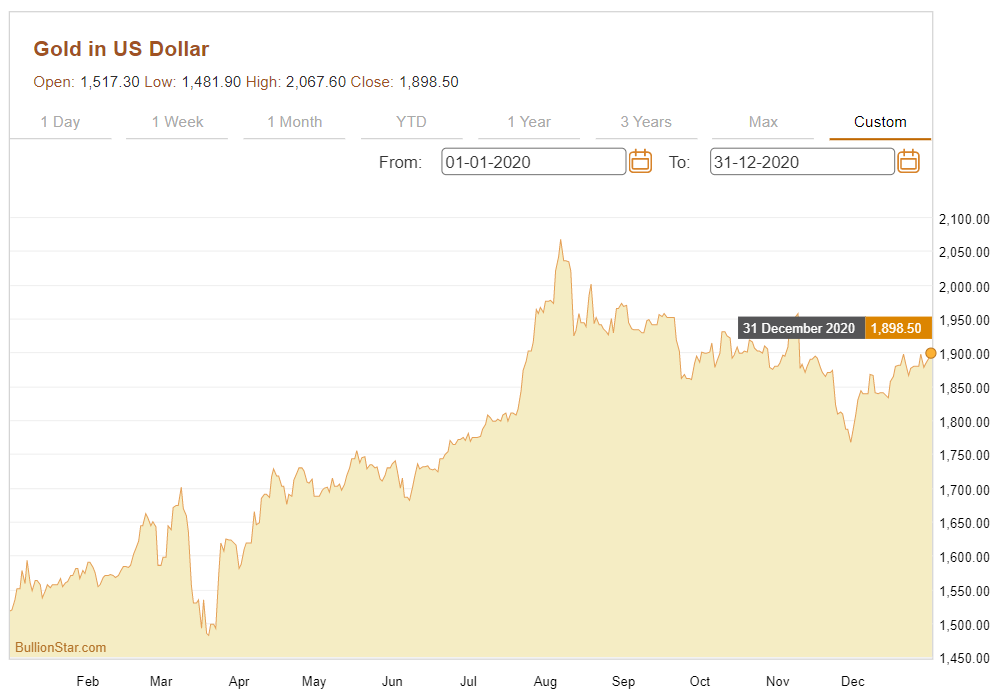
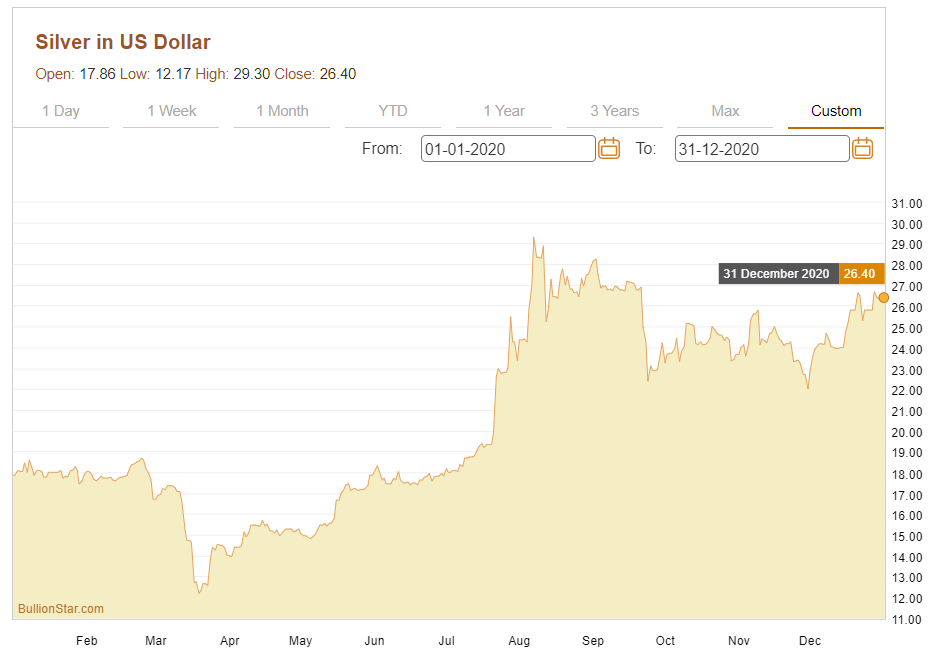
Gold and silver both had a strong performance in 2020, with the gold price in US dollars rising 25.12% during the year, and the silver price in US dollars rising an impressive 47.82%. These returns are based on opening prices of gold and silver on 1 January 2020 of $1517.3 and $17.86, respectively, and closing prices on 31 December 2020, of $1898.50 and $26.40, respectively.
Gold’s Continued Bull Run
With a 25.12% return in 2020, gold continues the strong run it recorded in 2019 when the gold price rose by over 18%. US dollar gold in 2020 also had its best year since 2010, a year in which it rose by 29.5%.
The 2020 low for the US dollar gold price was seen in the last week of March when the price dipped briefly below $1500 on the back of stress in the London gold market and the widening of spreads between the London spot price and COMEX futures prices. The 2020 high for the US gold price during the year was reached on 7 August, when the price touched US$ 2067.60 per troy ounce, after climbing consistently from the last week of March. A lot of that surge was during a two-month period from early June to the August high, when the gold price rose by $370 between 7 June and 7 August.
US dollar gold generally ebbed from that August high until the end of November, when it traded at $1767 on 30 November, before resuming its climb throughout December to end 2020 in the $1898 range.
The gold price also performed strongly in other currencies during 2020, for example, rising by 22.89% in Singapore dollars, 21.35% in British pounds, 22.63% in Canadian dollars, 14.85% in Euro and 13.93% in Aussie dollars.
Stellar Silver
Turning to silver, the 47.82% rise in US dollar silver price in 2020 also gives silver its best year since 2010, when it rose by 83%. Interestingly, silver also rose by a similar 47% in 2009, so could 2020 be presaging a very strong silver price showing for 2021?
The 2020 low for the US dollar price was also seen in March during the wider market panic, with a low price of $12.17 recorded on 19 March. Like gold, silver also resumed its ascent from that March low and also peaked on the very same day, 7 August at $29.3 per troy ounce. From low to high, that was an incredible 141% move in just over 4 months. Much of that upsurge occurred in three large jumps over late July and early August where the price rose a full $10 over 15 trading days.
Like gold, the US dollar silver price generally ebbed and flowed lower from August to the end of November, hitting a low of $22, also on 30 November. However, again like gold, the US dollars silver price rallied throughout December 2020, adding over $4 to finish the year comfortably above $26.
Although the 2020 platinum price rise was more subdued than that of gold and silver, it still rose a respectable 11.14% during the year from an opening price of $965.5 on 1 January to a closing price on 31 December, at the time of writing, of $1073.10.
Bitcoin’s vs Gold’s Performance
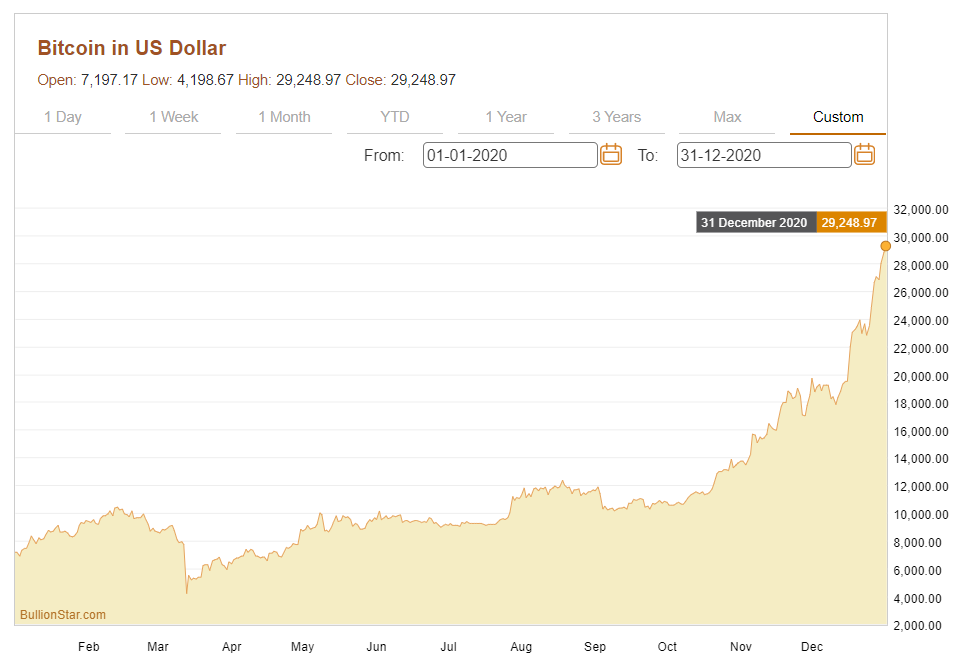
With the stellar rise of the Bitcoin price dominating headlines right now (Bitcoin tripled in price during 2020 from $7197 to $29,249 (or 306%)), it’s interesting to consider why Bitcoin’s price is rising at a far greater trajectory than that of gold given that both gold and Bitcoin have limited and slowly increasing supplies and both are considered by their proponents as being stores of value.
Comparing the size of the respective gold and Bitcoin markets, and using physical gold as a comparator, at its year end price of ($29,249) and with 18.587 million bitcoins in circulation, Bitcoin has a market cap of $543.67 billion.
With 200,500 tonnes of gold (6.446 billion troy ounces) known to have been mined throughout history (197,500 tonnes to end of 2019 according to the World Gold Council and about 3000 tonnes during 2020), that gives physical gold, at a US dollar price of $1900, a market cap of $12.247 trillion. So on a comparable basis, the global gold market is still far larger than Bitcoin, in fact nearly 23 times larger than that of Bitcoin. Physical gold’s above ground supply, based on the above figures, also increases slowly – by a rate of about 1.5% per annum.
The comparative market caps of Bitcoin and gold also mean that right now, a $1000 upward move in the Bitcoin price increases Bitcoin’s market cap by $18.587 billion, but the same increase in physical gold’s market cap is achieved by just a $2.88 increase in the gold price (per troy ounce). Something that the financial media never seems to mention.
But Bitcoin and gold also differ in that whereas there is no ‘paper Bitcoin’ market, there is a massive ‘paper gold’ market in the form of fractionally-backed and synthetic gold (unallocated gold trading in London) and gold derivatives (COMEX gold futures and OTC gold swaps and other gold derivatives), creating a situation where there are many ounces of paper claims for the same physical ounce of gold.
Putting aside Tether liquidity creation and its suspected effects on the Bitcoin price as well as sometimes rumored coordinated whale pumps of the Bitcoin price, Bitcoin and gold also differ in that price discovery for gold is established in these ‘paper gold’ markets (primarily by bullion bank trading in London and on COMEX), whereas price discovery for the Bitcoin price is established via a group of Bitcoin exchanges that trade only the asset Bitcoin and no derivatives thereof.
This means that the total demand for Bitcoin flows into the asset class ‘Bitcoin’ and is reflected in the Bitcoin price, whereas the total demand for gold does not (and by definition cannot) flow into physical gold because the mammoth ‘paper gold’ market, which acts as a dam, absorbs the majority of the demand that would otherwise have flowed into physical gold if no synthetic and paper gold markets existed. In short, the US dollar gold price is not reflective of the global physical gold market whereas the US dollar Bitcoin price is reflective of the global Bitcoin market.
This is a point raised on Twitter recently by macro commentator Luke Gromen of TFFT where he said:
“Bitcoin’s price is simply doing what paper gold leverage has been doing in recent decades. BTC’s chart is reminiscent of what a chart of the number of paper gold oz’s outstanding per physical gold ounce looks like."
Bitcoin’s price is simply doing what paper gold leverage has been doing in recent decades.
— Luke Gromen (@LukeGromen) December 27, 2020
BTC’s chart is reminiscent of what a chart of the number of paper gold oz’s outstanding per physical gold ounce looks like.
And also in the same conversation he added that:
“I’m not arguing against BTC. My position is that the preponderance is the evidence suggests the expansion of paper gold derivatives has prevented gold from doing what BTC (which doesnt have those paper derivatives) is now doing”
I’m not arguing against BTC. My position is that the preponderance is the evidence suggests the expansion of paper gold derivatives has prevented gold from doing what BTC (which doesnt have those paper derivatives) is now doing
— Luke Gromen (@LukeGromen) December 27, 2020
This is a theme we also discussed in a BullionStar article from March 2017 titled “What sets the Gold Price – Is it the Paper Market or Physical Market?” explaining that the gold price is established or ‘discovered’ by trading of synthetic (paper) gold in the London OTC and COMEX gold futures markets and that synthetic gold (which is a form of derivative) channels demand away from physical gold and absorbs demand that would otherwise have gone into physical gold:
“Synthetic gold is just created out of thin air as a book-keeping entry and is executed as a cashflow transaction between the contracting parties. There is no purchase of physical gold in such a transaction, no marginal demand for gold.
Synthetic paper gold therefore absorbs demand that would otherwise have flowed into the limited physical gold supply, and the gold price therefore fails to represent this demand because demand has been channelled away from physical gold transactions into synthetic gold.”
Therefore the huge ‘gold’ trading positions in the London gold market and COMEX, and the huge outstanding unallocated ‘gold’ positions and OTC gold derivatives of LBMA bullion banks have absorbed gold demand that would otherwise have gone into physical gold, and that would have generated much higher gold prices than have been generated. And as Luke says, a growth chart of these infinitely expandable paper gold positions over the last few decades (from around the mid 1980s for unallocated London gold) is reminiscent of a chart of Bitcoin’s price growth.
Conclusion
While the supply of synthetic gold is infinite, the supply of physical gold is not. In fact, like Bitcoin, gold’s new supply is limited and grows very slowly. Unfortunately, physical gold demand and supply have little or no effect on the international gold price, while paper markets continue to dominate gold price discovery.
For this to change, a shift in trading behavior would be needed, with paper gold holders increasingly converting their paper gold claims into physical gold, either by direct conversion or by rotation of positions out of paper and into physical. This would then cause the physical price to rise while actually causing the international (London and COMEX) gold price to drop as the physical price disconnected on the upside from the paper gold price.
In the absence of such a change, gold’s price rise will however continue to be supported by the central bank destruction of the financial system, manifested through such factors as low and negative real interest rates, quantitative easing, massive expansion of the US and global money supply, and the risk of hyperinflation, factors which do continue to influence positioning and sentiment in the bullion bank dominated synthetic gold markets.
Popular Blog Posts by Ronan Manly
 How Many Silver Bars Are in the LBMA's London Vaults?
 ECB Gold Stored in 5 Locations, Won't Disclose Gold Bar List
 German Government Escalates War On Gold
 Polish Central Bank Airlifts 8,000 Gold Bars From London
 Quantum Leap as ABN AMRO Questions Gold Price Discovery
 How Militaries Use Gold Coins as Emergency Money
 Hungary Announces 10-Fold Jump in Gold Reserves
 Planned in Advance by Central Banks: a 2020 System Reset
 China’s Golden Gateway: How the SGE’s Hong Kong Vault will shake up global gold markets