
Surging Silver Demand to Intensify Structural Deficit

 Ronan Manly
 19 Comments
There has been a significant imbalance in the physical silver market for the last 3 years with annual silver demand exceeding annual silver supply.
This is a problem since when silver demand is greater than silver supply, the extra demand (deficit) must be met by eating into the world’s finite and limited above-ground silver stockpiles.
This silver deficit has been so persistent and systemic that it is being described by the Silver Institute as a ‘structural deficit’ i.e. a prolonged deficit that is due to underlying ‘structural’ factors (technological advances and a sharply growing industrial demand), in an environment where supply (mine production and recycling) is unable to adjust upwards to keep pace with demand.
The Silver Institute is a Washington D.C. headquartered trade association that can be likened to the silver industry’s equivalent of the World Gold Council. The members of the Silver Institute are predominantly silver mining companies and refiners. The Silver Institute’s silver supply / demand data is collected and calculated by London based precious metals consultancy ‘Metals Focus’.
The Silver Institute / Metals Focus’ Supply – Demand model is basically as follows:
Total Annual Silver Supply = Silver from Mine Production + Silver Recycling
Total Annual Silver Demand = Investment Demand + Jewellery / Silverware Demand + All forms of Industrial Demand
Total annual silver supply is then compared to Total annual silver demand. Any difference is called the Market Balance, which is negative if Demand > Supply, and positive if Demand < Supply.
A better name for ‘Market Balance’ would be ‘Market Imbalance’. Likewise, a better way for the Silver Institute to define Supply – Demand equation would be:
Supply (Mine Supply + Recycling + Dishoarding of Existing Stockpiles) = Demand
With the Silver Institute estimating that silver supply in 2023 was a total 1.003 billion ozs (31,197 tonnes), comprising 820 million ozs (25,505 tonnes) of mine supply and 183 million ozs (5,692 tonnes) of recycled supply, and with total demand estimated by the Silver Institute as being 1.143 billion ozs (35,551), the deficit (or market imbalance) is 140 million ozs (4354 tonnes) of silver in 2023.
This deficit follows the years 2021 and 2022 which had silver demand deficits of 81 million ozs, and 253 million ozs, respectively.
2023 is expected to be the second highest year for annual silver demand ever, after 2022 which saw the highest total demand on record of 1.27 billion ozs.
Therefore, over the 3 years of 2021, 2022 and 2023, the Silver Institute estimates that there has been a cumulative silver deficit of a massive 474 million ozs (14,743 tonnes).
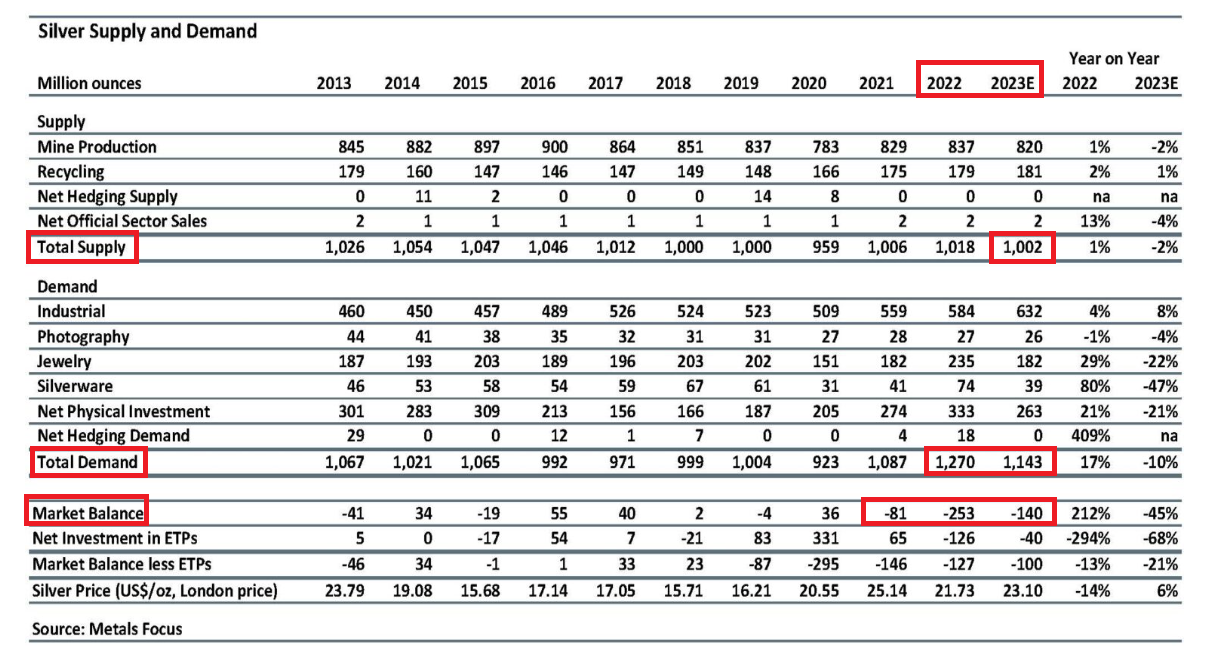
The situation is made worse by the fact that not only is silver mining output not expanding to meet the higher demand. It’s actually falling. According to Metals Focus, in 2023, “global [silver] output is expected to decrease by 2% y/y to 820Moz due to lower production from Mexico, Peru and Argentina."
Note that global silver output includes “primary silver production" where the primary metal extracted from ore deposits is silver, and “secondary production" where silver is extracted during the extraction and processing of other metals such as zinc, copper, and lead.
Although the Silver Institute’s annual World Silver Survey is published during April each year, this is followed up in November each year with a “World Silver Survey Interim Presentation” which includes updated data and commentary.
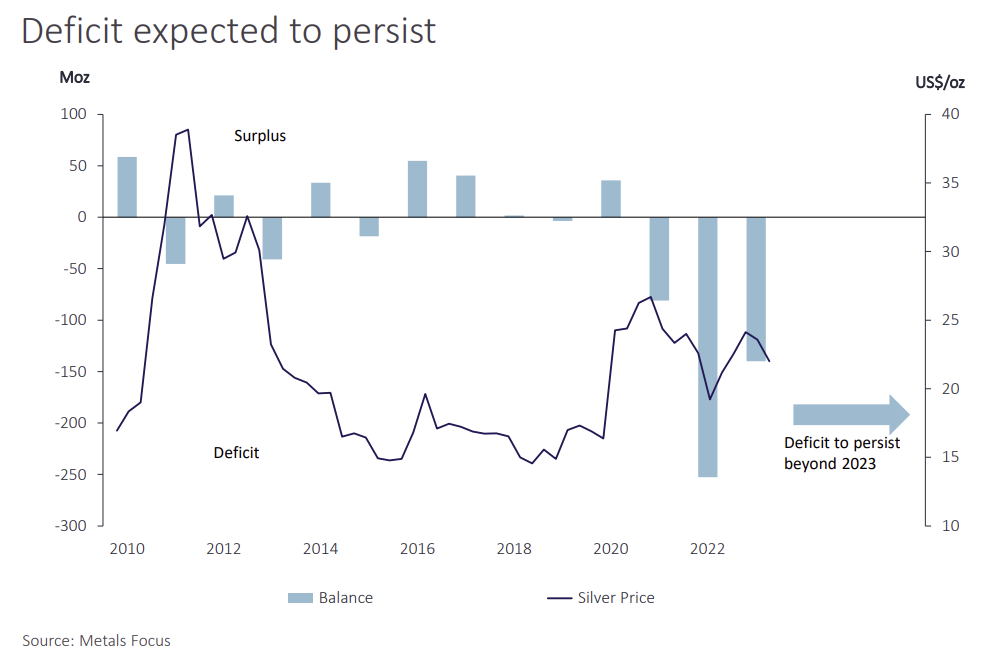
Importantly, in its 2023 interim update press release, published on 16 November 2023, The Silver Institute quotes Metals Focus (which actually gathers the data for the Silver Institute) saying that the structural silver deficit will continue into 2024 and beyond:
“Metals Focus believes the deficit will persist in the silver market for the foreseeable future.”
This silver deficit is primarily being driven by massive and growing industrial demand for silver.
Metals Focus’ Managing Director, Philip Newman, and Director of Mine Supply, Sarah Tomlinson, were pleased to attend the @SilverInstitute Dinner, and present the World #Silver Survey Interim Presentation, which discusses the key supply/demand highlights for 2023 pic.twitter.com/bzcbDFi5Dx
— Metals Focus (@MetalsFocus) November 17, 2023
That there is an ever growing industrial demand for silver and ever expanding technological applications that require silver is in itself astounding, but is even more astounding is that Metals Focus and the Silver Institute do not even include all the possible ‘industrial’ uses of silver in their demand data, something which I will look at below and which was first highlighted by Jon Forrest Little, publisher of ‘The Pickaxe’ and ‘The Silver Academy’.
The Silver Academy to Report on All the Metal Missing in Silver Institute’s so-called “World Silver Survey." https://t.co/rj3BH0SL8z
— The 𝙿𝚒𝚌𝚔𝙰𝚡𝚎 Official on Substack (@ThePickaxe_Ag) December 13, 2023
But first, let’s look at how the “Silver Institute (Metals Focus)” [SI-MF] categorizes silver demand.
In all of its reporting SI-MF breaks down Silver Demand into the following broad categories
• Investment (in physical silver)
•Silver Jewellery
• Silverware
• Silver demand in Photography
•Industrial demand for silver
To see what those categories mean, one then has to read the SI-MF commentary, because bizarrely, SI-MF does not define any of the demand categories that it uses in the “Notes & Definitions” sections of its reports.
Reading the SI-MF commentary, we can see that:
• Investment demand = Silver Bar and Silver Coin demand, and silver-backed ETF demand
• Silver Jewellery is self-explanatory.
• Silverware = Silver and silver-plated tableware and possibly ‘ornaments’
• Photography demand includes consumer films & liquids, medial X-rays, motion pictures
For its Industrial demand for silver, SI-MF break this area down into the following categories.
Industrial (total) =
• Electrical & Electronics (some of which is in a sub-category Photovoltaics)
• Brazing Alloys & Solders
• Other Industrial
Still, these categories for ‘Industrial’ are very high level and general, not very granular, and they do not convey very much information.
The SI-MF interim report commentary (November 2023) adds some clues:
" investment in photovoltaics (PV), power grids and 5G networks, as well as increased use of automotive electronics and supporting infrastructure. Improvements in (PV) were particularly noticeable as the increase in cell production exceeded silver thrifting, which helped drive electronics and electrical demand higher."
So we can start to build up a picture that SI-MF’s definition of “Industrial" = [Electrical, Electronic (of which some is Solar Panels (Photovoltaics), Power Grids, 5G networks), Brazing Alloys & Solders, Other]
Reading the industrial section of the SI-MF April 2023 World Silver Survey provides further colour stating that:
• ‘Electronics & Electrical’ includes green technologies, particularly PV
• Some of the ‘Other Industrial’ category is ethylene oxide (EO) catalysts
• “Consumer electronics" and “electronics printing" are within electronics
• Electrics includes car electrification such as onboard diagnostics
• Silver is being used in battery electric vehicles (BEVs)
• Printed silver is being used in wearable devices
• One of the demand bedrocks of silver demand is ‘contact materials’
• Indian industrial demand includes some particular uses for silver such as silver-plating, varakh (silver foil), zari (silver thread), silver nitrate (used in indelible ink)
• “Chinese manufacturers [of solar panels] have made breakthroughs in silver powder and paste technologies" and can now “replace Japanese companies as powder suppliers in high-end pastes for PERC (passivated emitter and rear cell) and TOPCon (tunnel oxide passivated contact) cells."
• Silver nanoparticles (AgNPs) will be a growth area for environmental applications and water purity technologies
Still, the above is not a comprehensive list of the full industrial uses of silver.
As mentioned above, for the last few months, Jon Forrest Little and ‘The Silver Academy‘ website have been publishing articles discussing “Silver Use not reported by The Silver Institute.", especially silver uses in the military sphere.
And Jon Forrest Little is totally right, since the only reference that I can see in Silver Institute’s 2023 World Silver Survey to military uses of silver is in relation to ‘contact materials’ where it merely says “Last year [2022] also saw robust offtake for the defense / aerospace sector."
In summary, these additional uses (which Jon Forrest Little and the ‘The Silver Academy‘ website have published here) are:
• Military (bombs, shells, missiles, tanks, fighter jets, nukes, night vision goggles, communication devices, bullets, etc)
• Aerospace (satellites, rockets, spacecraft, lasers, drones, etc)
• Robotics and AI
• Heavy Machinery such as the ones used in heavy construction projects, mining, and the new project in New York tunnelling between New Jersey and New York City
• Electric Trains (MagLev trains levitate through magnets, and Levitating trains fight friction. Electric trains also use Silver in printed circuit boards, switches, and other areas.)
• Hydrogen fuel cells ( cars, taxis, trucks, vans, ships, barges, ferries, yachts, boats, and HVAC) will surpass solar use possibly as early as 2027 since Silver kicked out platinum in the catalytic converter, Silver being 90 times cheaper.
• Then there are new solar panels whereby The Silver Institute didn’t bother to read the Specs written in Chinese.
• There are three types: PERC, TOPCon, and HJT. Moreover, double-sided panels, such as the new installation in UAE, are double-sided (capturing UV bouncing off desert sand and polar ice), thus twice the Silver.
• Plus Magnetic Resonating (MRIs at hospitals, other medical equipment, airports)
• Superconductors and Quantum computers
• Use in nuclear power plants.
• Use in transformers (conventional power plants)
Where all the silver is coming from to fulfil all of these types of military and other demand is another story. Are there secret government silver stockpiles in the US and elsewhere? Is silver supply coming from unidentified mines?
Adding all of the ‘Silver Academy’ additional uses to all of the industrial uses of the Silver Institute – Metals Focus’ gives a combined list as follows:
Investment Demand:
• Silver Bars and Coins: Demand for physical silver in the form of silver bars and silver coins.
• Silver Exchange-Traded Funds (ETFs): Demand for silver that is held in vaults and owned by silver-backed ETFs.
Jewellery and Silverware Demand:
• Silver Jewellery: Demand for silver in the production of jewellery items.
• Silverware (Tableware):
Cutlery: Demand for silver in the manufacturing of silver cutlery.
Tableware: Demand for silver in the production of various tableware items.
• Industrial Demand:
• Photovoltaics (P.V.): Silver used in the production of solar panels for photovoltaic applications.
• Automotive:
Electric Vehicles (BEVs)
Vehicle Sophistication (Diagnostics)
Automotive Electronics
• Electronics and Electrical:
Electronics Printing
Green Technologies
Onboard Diagnostics
Wearable Devices
• Power Generation and Distribution:
Power Grids
5G Network Investments
Construction Industry
Ethylene Oxide (E.O.) Catalysts
Catalytic Converters
• Military Demand:
Military Hardware
Communications Technology
Aerospace and Defense
Robotics and AI
Munitions
• Aerospace:
Satellites and Space Technologies
Rocketry
Aircraft and UAVs (Drones)
• Robotics and AI:
Robotic Systems
AI Systems
• Heavy Machinery:
Construction and Mining Equipment
Tunneling Projects
• Electric Trains:
MagLev Trains
• Hydrogen Fuel Cells:
Transportation and HVAC
• Solar Panels:
Next-Generation Solar Panels
• Magnetic Resonating:
Medical Equipment
• Superconductors and Quantum Computers:
Cutting-edge Technologies
• Nuclear Power Plants:
Nuclear Energy
• Transformers:
Conventional Power Plants
• Environmental Applications (Silver Nanoparticles):
Detection and Monitoring
Water Safety
Pollution Remediation
• Photographic Demand:
Consumer and Professional Film and Paper
Medical Sector
Non-Destructive Testing (NDT) X-Rays
Motion Picture Industry
• Indian Industrial Demand:
Plating: Demand for silver plating.
Food Industry (Varakh, Coating Seeds)
Zari Industry (Silver Thread)
Pharmaceuticals/Chemicals and Hygiene
Glass, Paints, Laboratory Equipment
• Silver Nanoparticles (AgNPs):
Above Ground Supplies Dwindling
Given this astoundingly varied and massive list of demand sources for physical silver, especially in the non-investment and non-jewellery sectors, then the question is, how can existing and limited above-ground inventories of silver be adequate to plug the continuing situation of a structural silver deficit given that silver demand is consistently far in excess of silver supply and will continue to be so?
The situation is already critical because above ground stocks of silver are already being eaten into. As the World Silver Survey 2023 (page 25 of pdf) says:
“It is also interesting to note that the deficits of 2021 and 2022 have more than wiped out the cumulative gains in silver above-ground stocks that we saw over 2010-2020 inclusive.”
So here you have 11 years of accumulated above-ground silver inventories (from 2010-2020) being wiped out due by two subsequent years (2021-2022) of silver deficits. That that doesn’t include the deficit of 2023 or the coming deficits of 2024 and beyond.
Known and reported above-ground silver inventories mainly comprise the silver in the LBMA vaults in London, the silver in the COMEX vaults in the US, and the silver held in the Shanghai Gold Exchange (SGE) and Shanghai Futures Exchange (SHFE) in China.
The Silver Institute’s World Silver Survey (written in April 2023) report continues:
“For the time being, we believe that there remain enough inventories – London vaulted stocks alone after all amount to more than one year’s mine production.
However, given our expectations that demand will continue to exceed supply for the foreseeable future, eventually much of this stockpile will be depleted. The effect of this on the price may be amplified by a possible reluctance by ETP holders to liquidate.”
London
It is however, misleading by Metals Focus / Silver Institute to say that “London vaulted stocks amount to more than one year’s mine production."
This is because 61% of the silver officially claimed by the LBMA to be in the London vaults is owned and held by Exchange Traded Funds (ETFs), and therefore is not available to meet demand.
These London vaults are the London vaults of the three security companies Brinks, Malca Amit, Loomis, and the London vaults of the three banks JP Morgan, HSBC, and ICBC Standard.
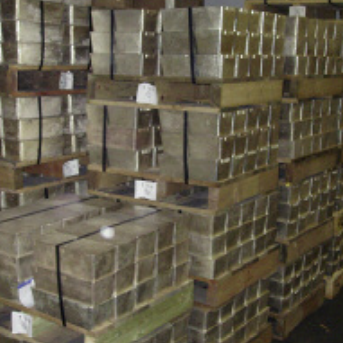
As of the end November 2023, the LBMA claims that there were 26,284 tonnes of silver in the LBMA London vaults. This is equivalent to 845 million ozs and according to the LBMA “equates to approximately 876,129 silver bars.”
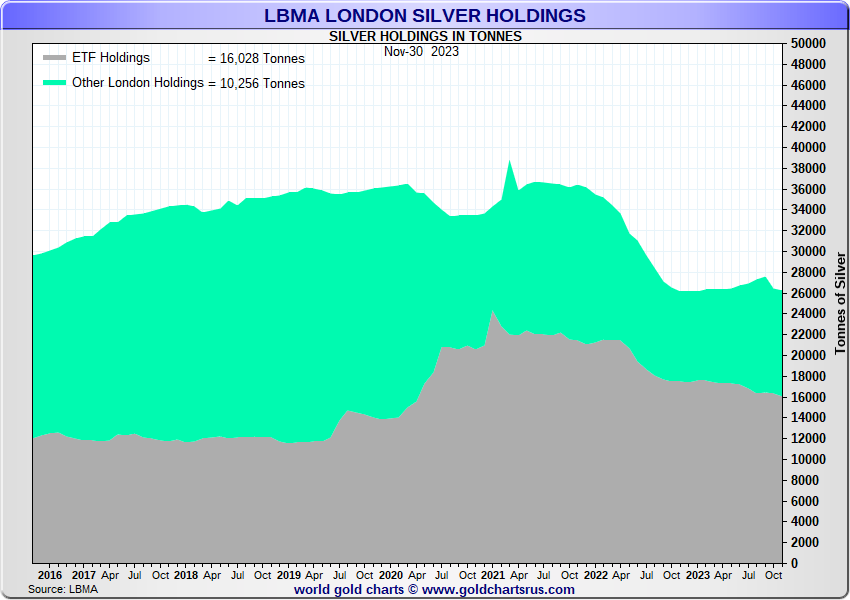
But, as of the end of November, of this 26,284 tonnes, 16,028 tonnes (61%) was held in silver-backed ETFs which hold their silver in London, which leaves only 10,256 tonnes (39%) of silver in the London vaults not owned by ETFs.
For example, as of 14 December 2023, just the iShares Silver Trust (SLV) was holding 441,470,716 ozs of silver (13,731 tonnes), of which 338,294,463 ozs (10,522 tonnes) was held in JP Morgan’s vaults in London and 103,176,253 ozs (3,209 tonnes) held in JP Morgan’s vaults New York. So this 10,522 tonnes of SLV silver in London is part of the 16,028 tonnes held by ETFs in London.
Of the 39% of silver held in London vaults that is not held by ETFs, some of this silver is held in allocated silver holdings by the wealth management sector, investment institutions, family offices and High Net Worth individuals etc. That brings now available supply even further.
So it’s irrelevant if there a year’s worth of silver mining output held in London vaults, since much of it is held by ETFs and other investors. What’s relevant is how much of this silver is available to meet annual demand.
You may recall that between July 2021 and the end of 2022, there was a huge exodus of silver from the LBMA vaults in London, with a net 339 million ozs (10,550 tonnes) of silver leaving the London vaults.
This silver outflow from London was covered in BullionStar articles “London Silver Inventories Continue to Plummet as Metal Exits LBMA Vaults (September 2022) and “LBMA Silver Inventories fall to a near 6 Year Low below 1 billion ounces" (July 2022).
A repeat of this outflow (e.g. 10,550 tonnes) in the future would not be currently possible as there is not even this much silver in the London vaults in the non-ETF category to meet this demand.
While haemorrhaging of silver from London supposedly stopped at the beginning of 2023 (and according to the LBMA, silver holdings in the London vaults rose from 840.9 million ozs in January 2023 to a peak of 887.2 million ozs at the end of September 2023), London’s silver holdings have since fallen again to 845 million ozs at the end of November.
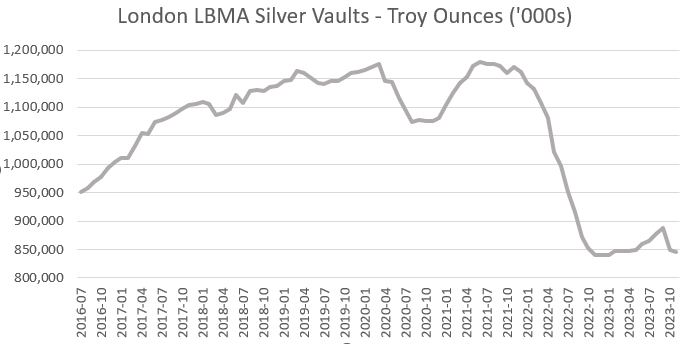
With a sizeable deficit (market imbalance) of 140 million ozs of silver in 2023 (according to the Silver Institute), it’s surprising that the LBMA claims that London silver inventories rose during the first 9 months of 2023.
This is even more surprising since, as you will see below, the silver inventories on the COMEX, the Shanghai Gold Exchange (SGE) and the Shanghai Futures Exchange (SHFE) all consistently fell during 2023.
Since the LBMA only produces one rolled up figure for London silver vault holdings (5 business days after month end), and provides no data on inflows and outflows of silver from these vaults, then the whole London LBMA vault data is a black box.
So it might be a case that the LBMA is again being deceptive about how much (or how little) silver is actually in the London vaults. This wouldn’t be the first time, because you might recall that over an entire month in 2021 (between 9 April to 10 May 2021), the LBMA falsely overstated the March 2021 LBMA silver vault holdings by a massive 3,300 tonnes of silver. See BullionStar article “LBMA misleads Silver Market with False Claims about Record Silver Stocks" from May 2021 for details.
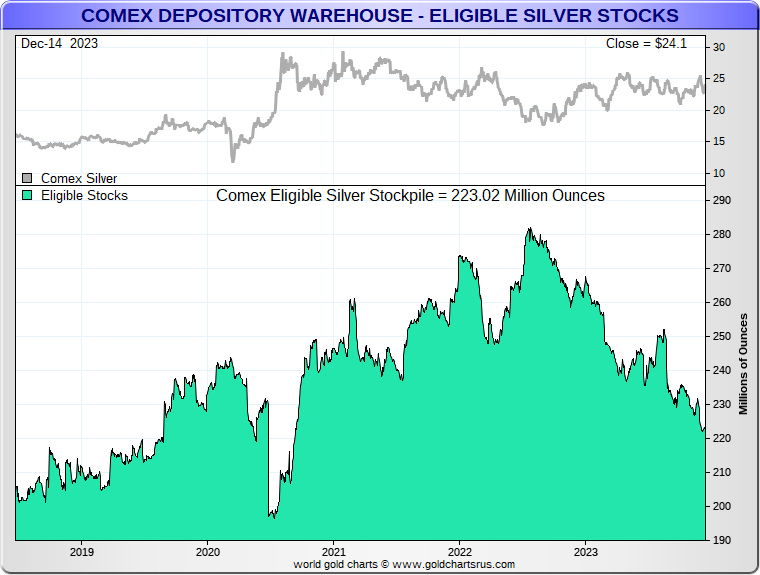
COMEX
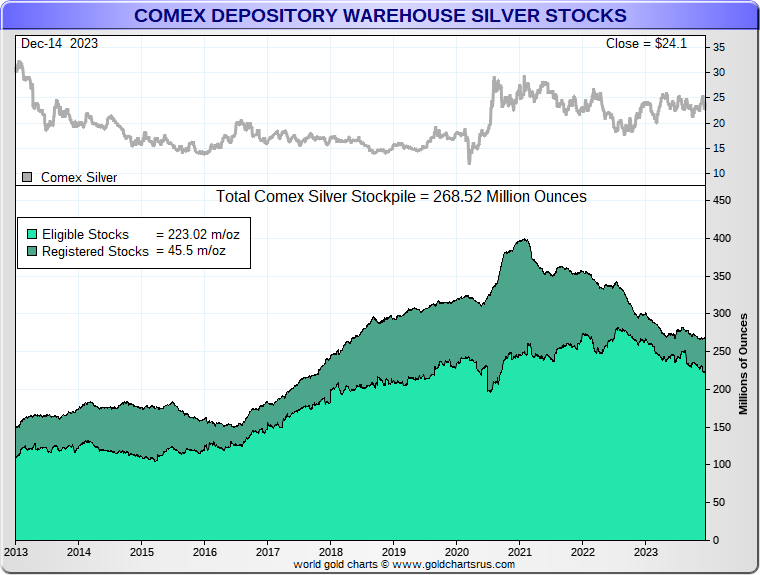
Over on the COMEX in the US, the fall in silver inventories has been clearcut during 2023. Starting with COMEX total stockpiles of silver of 300 million ozs at the beginning of 2023, the COMEX silver inventory has now fallen to 268 million ozs (that’s a 32 million ozs or 1000 tonnes drop). All of this drop has been in the ‘Eligible’ category, which means that silver holders on a combined basis have taken silver out of the COMEX approved vaults during 2023.
‘Eligible’ just means that the commodity (in this case silver) is in a form (1000 oz bars) which meets the settlement specifications of the SI futures contract. This also means that there is less silver in ‘Eligible’ that could be moved into ‘Registered’ for trading.
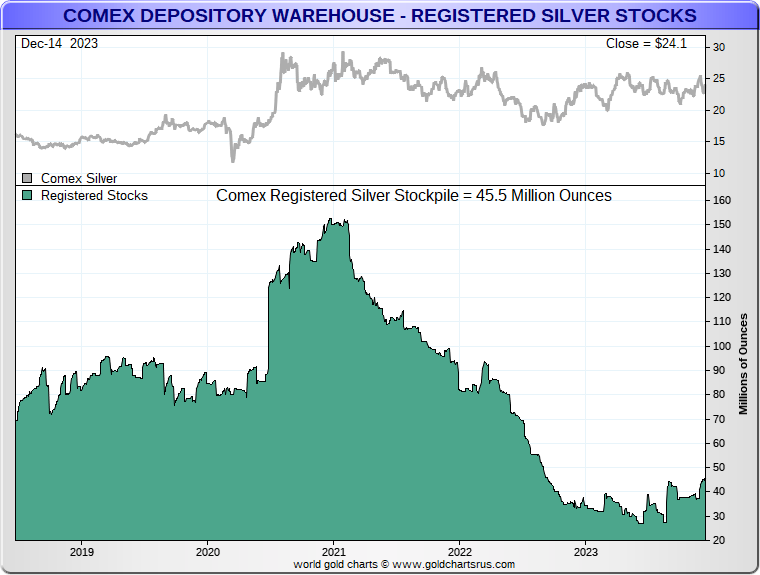
Looking at the ‘Registered’ category (silver with trading warrants attached and that can be used to settle futures contracts), after huge falls in registered inventory over 2021 and 2022, the COMEX registered silver inventory increased marginally during 2023 from just over 34 million ozs (1,058 tonnes) to 45 million ozs (1,400 tonnes). Either way, this is only a small fraction of annual silver demand.
But in the ‘Eligible’ category, COMEX silver inventories dropped dramatically over 2023, falling from 260 million ozs at the beginning of the year to 223 million ozs now. That’s a 37 million ozs drop in silver holdings equivalent to 1,151 tonnes.
Note again that much of this ‘Eligible’ silver has nothing to do with COMEX trading and is just held in the approved COMEX vaults for other reasons. For example, 103.17 million ozs of SLV’s silver (3209 tonnes) is held in the JP Morgan vault in New York and this needs to be excluded from Eligible.
Remember also that the CME which operates the COMEX even estimated in a letter to the CFTC commodity regulator in February 2021 that 50% of Eligible silver should be discounted from deliverable supply. See BullionStar article “COMEX Deliverable Silver far less than imagined as 50% of ‘Eligible’ is not Available" (October 2022)
So overall, you can see that silver inventories reported by the ‘COMEX’ vaults in and around New York have fallen noticeably during 2023.
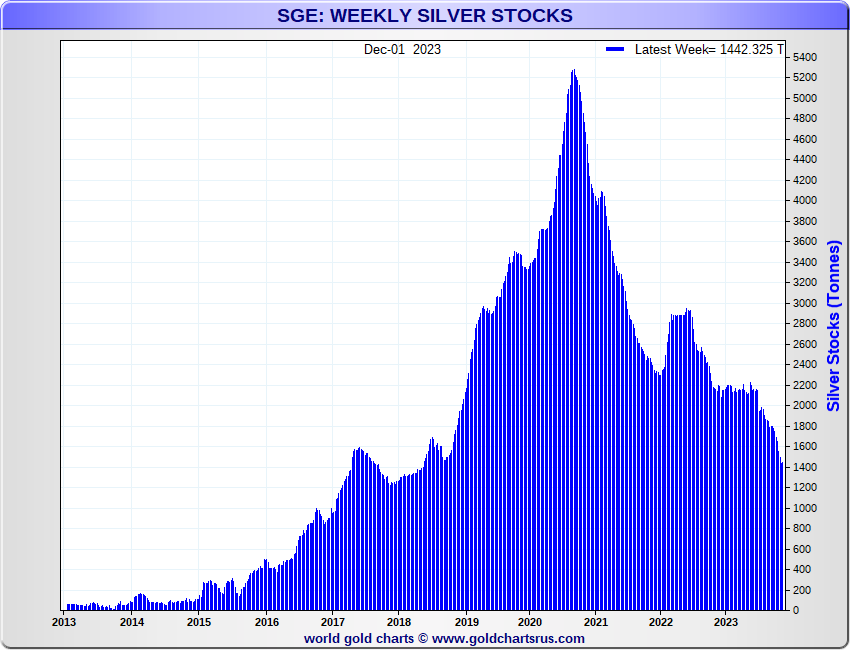
China – Shanghai Gold Exchange (SGE)
Despite its name, China’s Shanghai Gold Exchange (SGE) is also a major trading venue for silver.
The depletion of silver inventories during 2023 is also notable on the SGE, After having stayed relatively constant during H1 2022 at around 2200 tonnes, silver inventories on the SGE began to fall rapidly all throughout the second half of 2023, and are now just over 1400 tonnes (45 million ozs).
Silver inventories on the SGE haven’t been this low since Q3 2018, and this downward trend has been in place since mid 2020 when SGE silver inventories peaked at nearly 5300 tonnes. The weekly chart of SGE silver inventories shows these changes.
China – Shanghai Futures Exchange (SHFE)
A similar depletion in silver stockpiles is also evident on China’s other main silver trading venue, the Shanghai Futures Exchange (SHFE), where silver inventories have been on a downward trend all through 2023, falling from around 2200 tonnes at the beginning of 2023, to 1041 tonnes (33 million ozs) in mid December. See chart below from @InProved_Metals
After 73t were added to the #Shanghai #Silver vaults the last 2-wk, the drawdown in inventory has resumed down 50 t (1.6m oz) this week. As of Dec 15, the total held by the #SHFE stands at 1,041 t #china #bullion #preciousmetals #commodities #silversqueeze pic.twitter.com/8mQIH4Px4O
— 🇭 🇺 🇬 🇴 (@InProved_Metals) December 15, 2023
In the World Silver Survey 2023, there is a table called “Identifiable Silver Bullion Inventories" which features the LBMA London vaults, the COMEX (CME) vaults, and the Chinese SGE and SHFE vaults, and the amount of silver (in mns ozs) in each of these vault networks as of year end, the latest year being 2022.
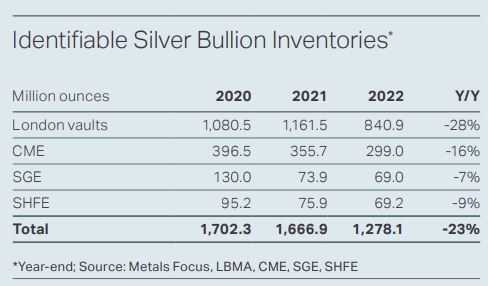
The commentary accompanying that table says that since total silver held in these combined locations fell during 2022 from 1,666.9 mn ozs to 1,278.1 mn ozs (for a fall of 388.8 mn ozs (12,093 tonnes)), and since the deficit calculated by Metals Focus for 2022 was 237.7 mn ozs, then there was an extra 151.1 mn ozs (4,700 tonnes) that moved from ‘Identifiable Inventories’ to “ Unreported Silver Inventories"
In other words, they are saying that only 237.7 mn ozs was needed to plug the deficit. So that extra 151.1 mn ozs that flowed out of Identifiable vaults during 2022 went into unreported inventories. This 237.7 mn ozs was updated later by MF to 253 mn ozs by SI-MF, which would mean that unreported silver inventories rose by 131.8 mn ozs
The Flaw with this logic though is that as we saw above, there are lots of sources of demand for silver that the SI -MF model does not capture. and which could have consumed the extra 131.8 mn ozs which flowed out of the vaults during 2022.
Having said that, if you plug the latest vault holdings of LBMA, COMEX, SGE and SHFE into the SI-MF table format, you get the following:
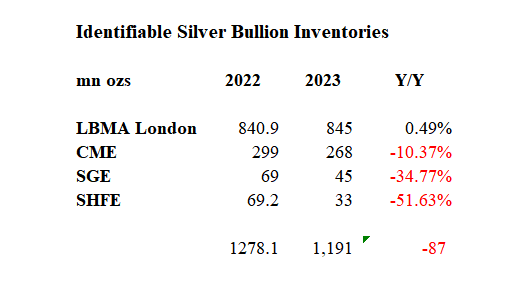
Note the very suspicious lack of net movement in the LBMA vault figures over 2023, all the while when silver inventories in the other three vault networks all fell substantially. This data is saying that there has been a net outflow from these combined vault networks of 87 million ozs during 2023.
With SI-MF claiming a silver deficit of 140 mn ozs during 2023, by their logic, this means that ‘unreported silver inventories’ (whatever and wherever they are) would have had to fall by 53 mn ozs this year. This is because only 87 mn ozs came out of the identifiable vaults to plug the 140 mn ozs deficit, so another 53 mn ozs would have to have come out of unidentifiable vaults. Again, this logic takes no account of the extra sources of silver demand which the Silver Institute – Metals Focus model does not capture.
Conclusion
Given continued growth in silver demand across industrial / technology and investment sectors – with demand outpacing supply – coupled with falling mining output and seemingly unresponsive / inflexible supply from recycling, it is certain that the continued deficits in the silver market will continue to eat up above ground stockpiles
Structural silver deficits should in theory mean that the price of silver should rise significantly during 204. This is Economics 101 on supply and demand.
A rising price would encourage more silver mining, more silver recycling, and would entice “some" investment holders of silver bars and coins to sell at a higher price.
However, given that the LBMA bullion banks totally control silver price discovery via the trading of unlimited synthetic paper (unallocated) silver credit in London and similar unlimited paper trading of silver futures on the COMEX, then it will be a case of seeing how long the bullion bankers can keep up their price manipulation scheme before something snaps, and the silver deficit starts to direct influence the silver price.
Popular Blog Posts by Ronan Manly
 How Many Silver Bars Are in the LBMA's London Vaults?
 ECB Gold Stored in 5 Locations, Won't Disclose Gold Bar List
 German Government Escalates War On Gold
 Polish Central Bank Airlifts 8,000 Gold Bars From London
 Quantum Leap as ABN AMRO Questions Gold Price Discovery
 How Militaries Use Gold Coins as Emergency Money
 Hungary Announces 10-Fold Jump in Gold Reserves
 Planned in Advance by Central Banks: a 2020 System Reset
 Surging Silver Demand to Intensify Structural Deficit