
An Update on SGE Vault Withdrawals & Price Premiums

 Ronan Manly
 3 Comments
In 2016, withdrawals of gold from the Shanghai Gold Exchange totalled 1970 tonnes, the 4th highest annual total on record. This was 24% less than SGE gold withdrawals recorded in 2015, which reached a cumulative 2596 tonnes (See Koos Jansen’s 6 January 2017 blog at BullionStar “How The West Has Been Selling Gold Into A Black Hole” for more details of the 2016 withdrawals).
SGE gold withdrawals are an important metric in the physical gold market because SGE gold withdrawals are a suitable proxy for approximating Chinese wholesale gold demand. This proxy functions well because China’s domestic gold mining production, Chinese gold imports, and most Chinese gold scrap are all sold on the Shanghai Gold Exchange. As a reminder, gold withdrawals from the SGE means actual physical gold bars withdrawn from the SGE’s network of 62 approved precious metals vaults in 35 cities across China. (See “The Mechanics Of The Chinese Domestic Gold Market" for a discussion of why this proxy works).
2017 SGE Gold Withdrawals
Year-to-date, which now includes the first four months of 2017, SGE gold withdrawals have reached 727 tonnes, which annualized equals 2181 tonnes, and would make 2017 the 3rd highest SGE vault withdrawal year on record, and only slightly behind the 2197 tonnes of registered withdrawals from the Exchange’s vaults in 2013. And since SGE gold withdrawals are a suitable proxy for wholesale Chinese gold demand, it would point to 2017 shaping up to be one of the strongest years ever for physical gold demand in the Chinese gold market.
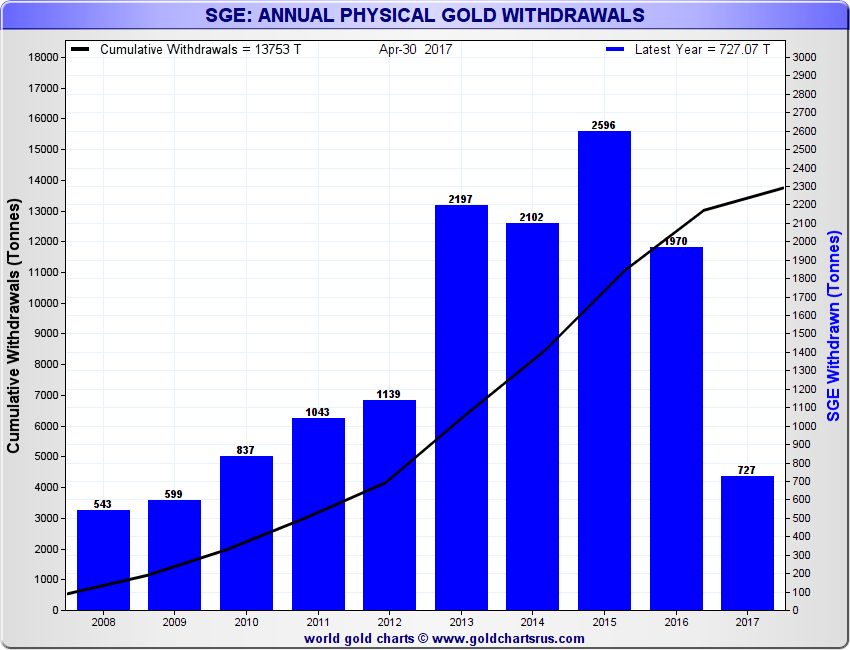
SGE Gold Withdrawals 2008 – 2017. The 2017 figure reflects January – April inclusive. Source:www.GoldChartsRUS.com
With two-thirds of the year still to play out, annualised estimates of year-to-date gold withdrawal figures will always be approximations and will change when each successive month’s figure is added.
For example, January 2017 gold withdrawals of 184.4 tonnes suggested an annualised withdrawal figure of 2213 tonnes. February’s withdrawals as per published SGE data came in at 179.2 tonnes, implying an annualised figure of 2182 tonnes. As monthly withdrawals increased in March to 192.2 tonnes, this edged the annual estimate up to 2224 tonnes. But coincidentally, April’s SGE gold withdrawal figure brought the annual estimate back to ~2182 tonnes. This was so because combined gold withdrawals for January and February exactly equaled combined withdrawals for March and April, in both cases 363 tonnes over the two consecutive two month periods.
January + February = 184+179 = 363 tonnes
March + April = 192+171 = 363 tonnes
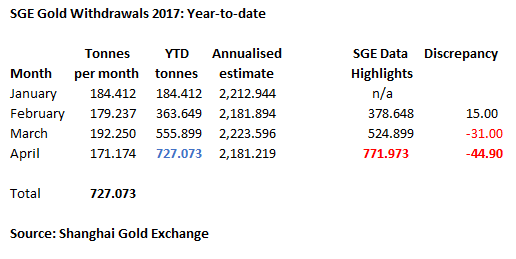
There is also a data discrepancy worth pointing out with the Shanghai Gold Exchange’s gold withdrawal figures for 2017. This discrepancy relates to the fact that the monthly withdrawal numbers for the 4 month period from January to April do not add up to the cumulative gold withdrawal figure for 2017 as published elsewhere on the Exchange’s website.
SGE gold withdrawals for January to April inclusive summate to exactly 727.073 tonnes.
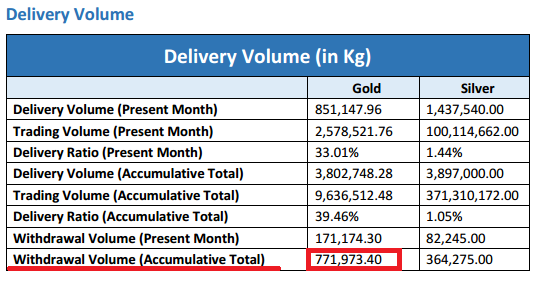
However, in the latest (April) edition of the SGE’s monthly “Data Highlights” report, which is published in English, it states that cumulative withdrawal volume inclusive of April totalled 771.973 tonnes, which is 44.9 tonnes higher than the figure implied by the summation of the 4 individual months’ figures.
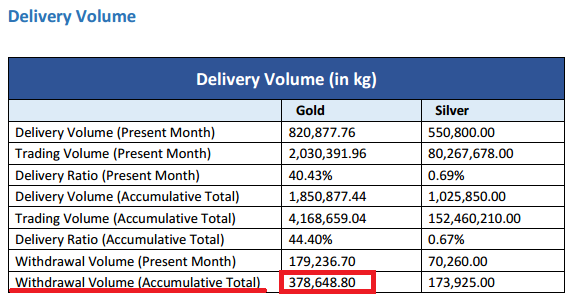
This data discrepancy has been present in the ‘Data Highlights’ report each month since February. For example, at the end of February 2017, the combined monthly withdrawals of January (184.412 tonnes) and February (179.237 tonnes) were 363.649 tonnes, but the ‘Data Highlights’ report for February stated that the cumulative withdrawal total for those two months was 378.649 tonnes. This is exactly 15 tonnes more than the two months combined would suggest. So, it seems that there is a data issue somewhere in SGE record keeping, especially given the rounded figure nature of the discrepancy number.
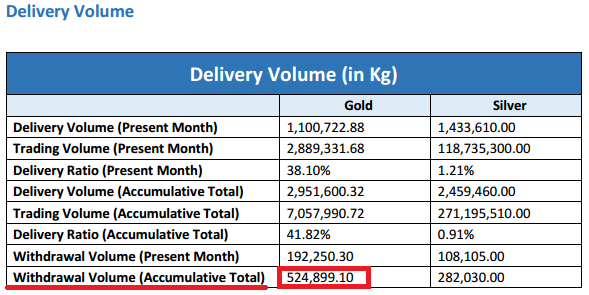
The SGE March report also had an error when the monthly totals for January – March pointed to gold withdrawals of 555.899 tonnes , while the March ‘Data Highlights’ listed cumulative gold withdrawals of 524.899 tonnes, in this case exactly 31 tonnes less than the summation of the 3 monthly figures would suggest. Again, the rounded figure nature of the discrepancy number suggests a data issue somewhere in the SGE reporting system.
Until the SGE clarifies the discrepancy, its best to go with the summation of the individual month’s withdrawal figures while awaiting feedback from the Exchange.
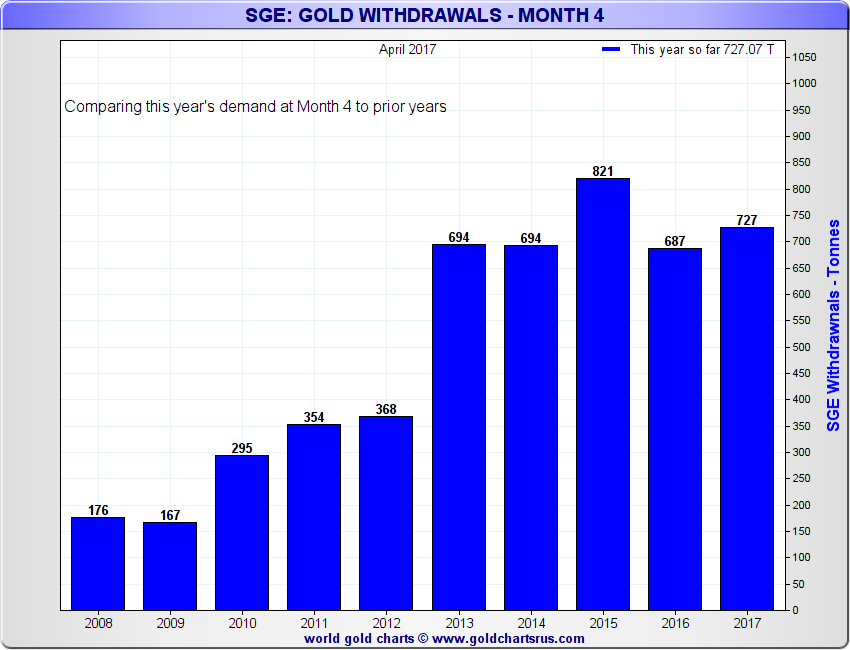
The above chart plots cumulative gold withdrawals for the 4 months to end of April compared to similar periods in previous years, and again shows that 2017 looks set to be one of the strongest years for Chinese gold demand on record. The cumulative gold withdrawals of 727 tonnes for the January to April timeframe are the 2nd highest ‘Month 1-4’ cumulative figure on record, with only 2015 higher, when the similar figure came in at 821 tonnes.
SGE Premiums
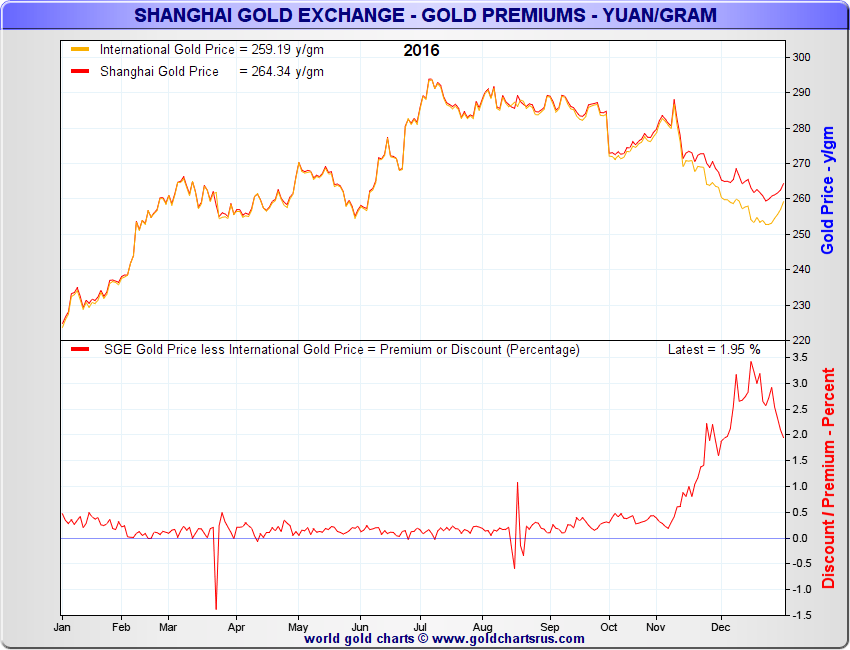
Beginning last November and persisting into December 2016, the SGE gold price and the International gold price (as expressed in Yuan) began to diverge with the SGE gold price trading significantly higher. This created a noticeable and rapidly rising premium in the SGE gold price, and at one point in mid December this premium was $40 per ounce higher than, or over 3% above the international gold price.
This phenomenon was at the time attributed to the introduction by the Chinese authorities of more stringent restrictions on gold imports in an effort to reduce currency outflows. For example, Reuters, citing trader sources, wrote on 9 December 2016 that China was “curbing gold imports in [a] bid to limit yuan outflow".
There were also rumours in the gold market at that time that a number of banks that had been authorised to import gold into China had lost their import licences (or that their licenses had not been renewed), and that the People’s Bank of China was also becoming stricter on the quotas of gold that it would allow banks to import in a given consignment. However, when BullionStar asked the SGE about this in December, the SGE did not reply.
Only 13 banks are authorised to import gold into China, 10 of which are local Chinese banks, and the other 3 of which are the foreign banks HSBC, ANZ and Standard Chartered.
In theory, an expansion in the SGE price premium could have been caused by a combination of limited supply or higher demand, or both. The below chart for 2016 (lower panel) illustrates the emergence of this premium in early November, with the premium rising rapidly from less than 0.5% at that time to nearly 3.5% at one point in December, but still ending the year in the 2% range. The upper panel of the chart show that same phenomenon only in terms of the relative prices of the SGE and International gold prices.
In contrast, for the 10 months of 2016 that preceded November, the premium of the SGE price to the International price was persistently very low and static from January to October 2016.
Fast forwarding to 2017, the most interestingly observation of the SGE premium since the November-December timeframe is that although the premium dropped sharply in January from the 2% range down to the 0.4% range by January month-end, it resumed a uptrend in February before spiking up noticeably again during March to levels approaching those seen in November and December.
In the case of March, it appears that premiums rose again for the very same reason that was attributed to the sharp rise in late 2016, i.e. the re-emergence of supply constraints brought on by more stringent gold import restrictions. According to Reuters in an article on the subject dated 17 March in which it quoted a Hong Kong based trader saying that:
“imports are happening, but with some restrictions. The government has been doing this since November to control the capital outflows. Now, it is becoming a bit aggressive with stringent reviews"
“The quotas are reviewed regularly and extended on a case by case basis."

Although premiums shrank after mid-March and returned to the 1% level, they oscillated in the 1% to 0.5% range until mid-April and since then have resumed a steady rise to the 1% level, which is a very different chart to the one that persisted for most of 2016.
It therefore seems that the impact of tighter import restrictions that appeared in November and December of last year and which the rising premiums reflected was not a transitory phenomenon but instead has become a persistent feature of the Chinese gold market.
And what does this say about the Chinese authorities’ plans to liberalise the Chinese gold market since more restrictive import quotas and rules appear to be doing the opposite by undermining some of the liberalisation steps that had already been underway?
Popular Blog Posts by Ronan Manly
 How Many Silver Bars Are in the LBMA's London Vaults?
 ECB Gold Stored in 5 Locations, Won't Disclose Gold Bar List
 German Government Escalates War On Gold
 Polish Central Bank Airlifts 8,000 Gold Bars From London
 Quantum Leap as ABN AMRO Questions Gold Price Discovery
 How Militaries Use Gold Coins as Emergency Money
 Hungary Announces 10-Fold Jump in Gold Reserves
 Planned in Advance by Central Banks: a 2020 System Reset
 Surging Silver Demand to Intensify Structural Deficit