
Koos Jansen vs. WGC/GFMS/CPM Update

 Koos Jansen
Recently Thomson Reuters GFMS released its global gold demand figures for 2014 in which they stated Chinese demand was 866 tonnes. I briefly expanded on why I didn’t agree with this number by a humongous margin in my post from January 30 – as Chinese supply was at least 1,834 tonnes. Followed by a post released January 31 on the fact that GFMS again had double counted Chinese gold volume traded on the Shanghai Gold Exchange and the Shanghai Futures Exchange. However, this quarrel does not exclude the World Gold Council and CPM Group.
In Gold Demand Trends Full Year 2014 the World Gold Council (WGC) discloses Chinese gold demand at 814 tonnes, far below the tonnage we see being supplied to China. My previous extensive post on my disagreement with WGC demand figures I wrote months ago, hence I feel a strong propensity to update the blogosphere with my latest insights regarding the Chinese market.
Recap; in China gold demand and thus import is greatly stimulated by the government; gold export is prohibited (in general trade), except for Panda coins; all imported and domestically mined gold is required to be sold first through the Shanghai Gold Exchange (SGE) before entering the Chinese marketplace; once gold is withdrawn from the vaults of the SGE it’s not allowed to re-enter these vaults before it’s re-cast into a new bars by an SGE approved refiner; tax incentives push scrap supply to be sold through the central bourse as well, if casted as new bars. Because of the structure of the Chinese gold market many analysts, including myself, use SGE withdrawals as a proxy for Chinese wholesale demand. Read these three posts (I)(II)(III) for more detailed information on the structure of this market. A simplified equation for the SGE is:
SGE withdrawals = import + mine + scrap
When I started publishing SGE withdrawals and later connected them to Chinese wholesale demand (on September 18, 2013, December 12, 2013 and April 15, 2014) I was merely using numbers published in Chinese – from reports that are now all taken offline (CGA Gold Yearbook 2007-2009 & 2013, SGE Annual Report 2007-2011, China Gold Market Report 2007, 2008, 2010, 2011), the only two dots I connected was aggregated demand and SGE withdrawals, the rest became self-evident. In the next chart we can see total demand from 2004 to 2013 as disclosed by the China Gold Association (CGA) Gold Yearbook 2013, which is written in Chinese and only published in hard copies; the blue bars represent total demand in tonnes (LHS), the red line y/y growth in percentages (RHS).
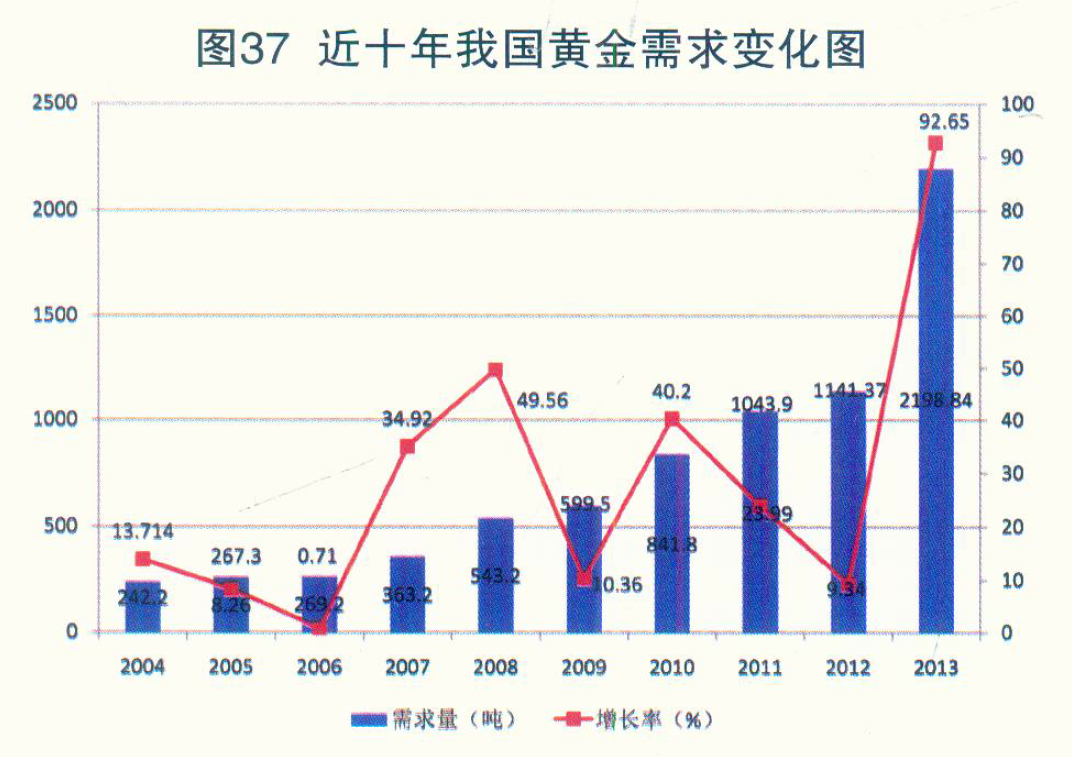
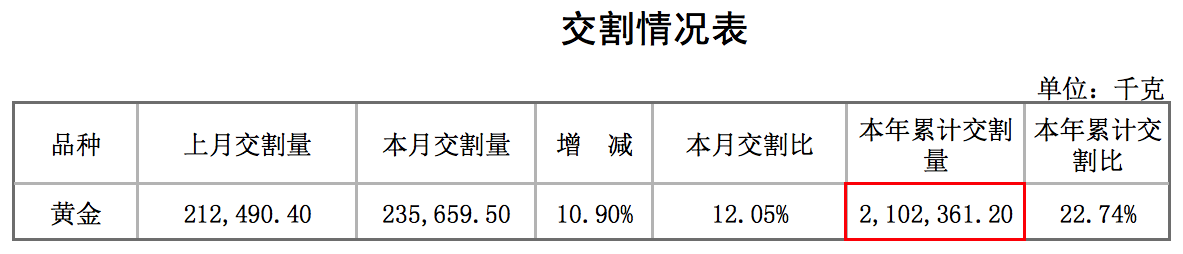
When I say Chinese wholesale demand in 2013 was nearly 2,200 tonnes I’m not making this up, these are metrics used by the CGA (SGE/PBOC).
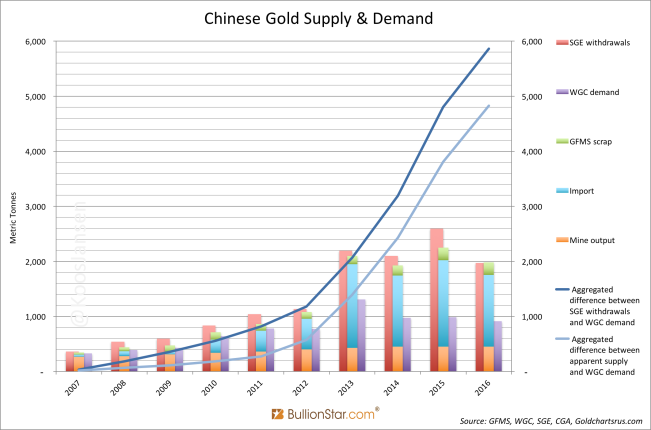
Gold supply in China has been outstripping the WGC’s demand numbers by literally thousands of tonnes in the past years, to which the WGC is continuously seeking to find arguments that should explain the difference. In vain the Council has published two reports dedicated to the Chinese gold market that were permeated with incorrect statements. Jumping from one argument to the next hasn’t strengthened their case either. The oncoming chart gives you a rough approximation of the difference.
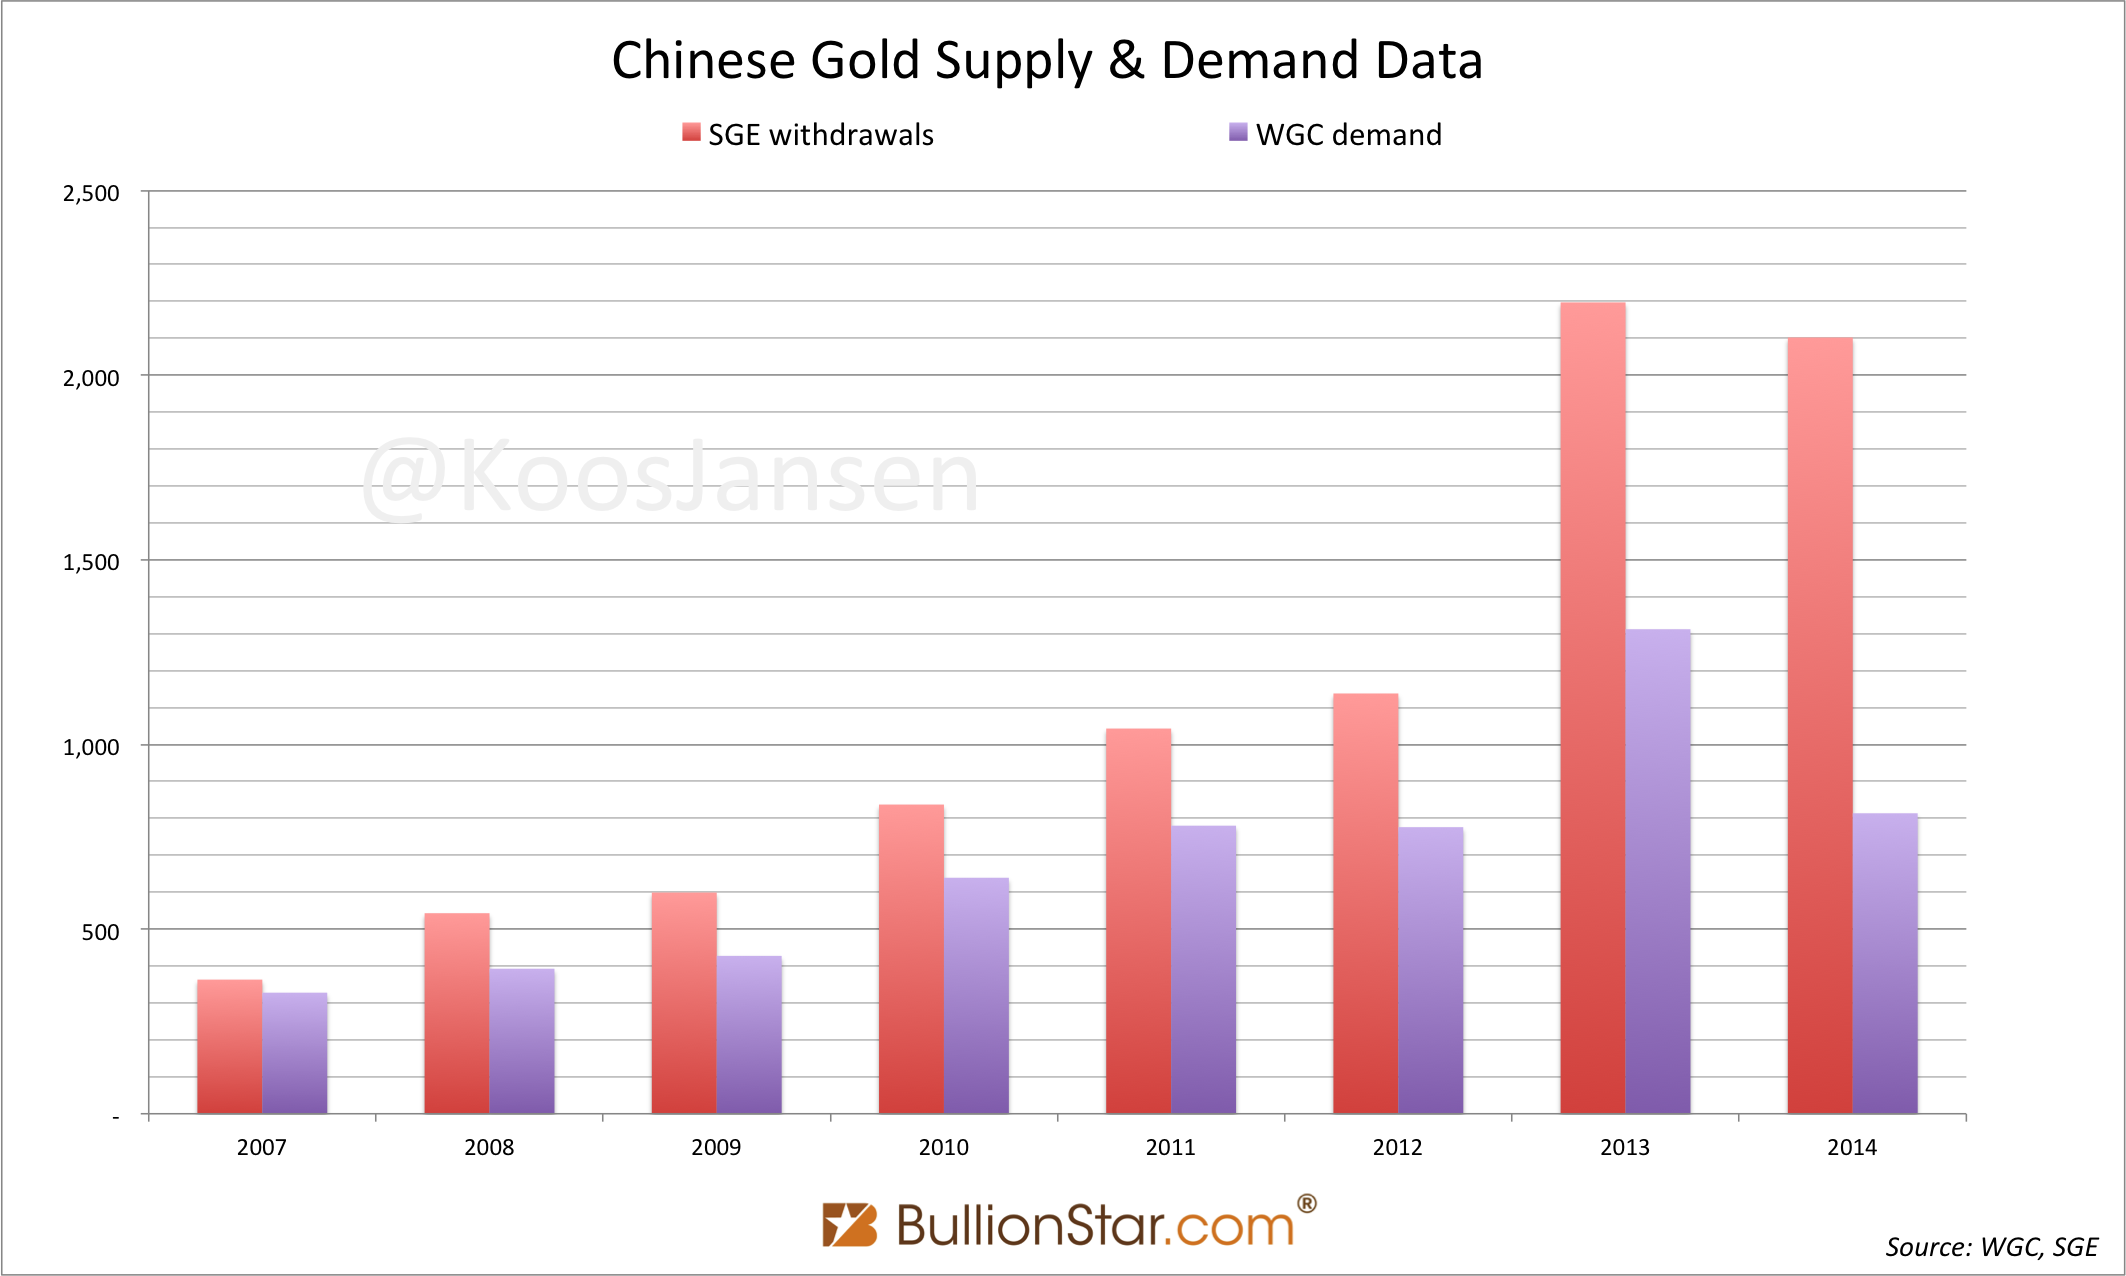
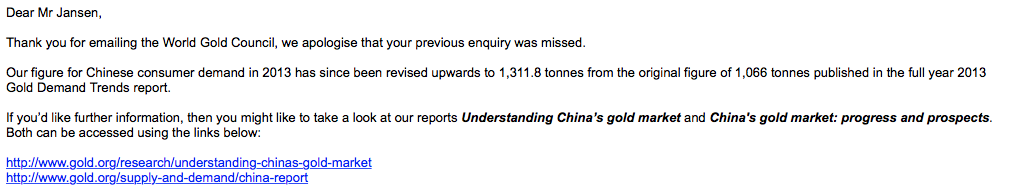
Kindly note the WGC has revised their Chinese demand numbers 2013 from 1,066 tonnes to 1,312 tonnes. The revision rebutted their initial data by 23 %.
For this post we’ll use data from 2013 as a model to examine the Chinese gold market.
Chinese Gold Supply And Demand Metrics
According to SGE chairman Xu Luode Chinese consumer demand in 2013 was 2,000 tonnes. In his speech at the LBMA forum in Singapore June 25, 2014, he noted:
Last year, China imported 1,540 tonnes of gold. Such imports, together with the 430 tonnes of gold we produced ourselves, means that we have, in effect, supplied approximately 2,000 tonnes of gold last year.
The 2,000 tonnes of gold were consumed by consumers in China. Of course, we all know that the Chinese ‘dama’ [middle-aged women] accounts for a significant proportion in purchasing gold. So last year, our gold exchange’s inventory was reduced by nearly 2,200 tonnes, of which 200 tonnes was recycled gold.
The SGE chairman makes a distinction between SGE withdrawals (2,200 tonnes) and his measure of consumer demand (2,000 tonnes), which he calculates by subtracting recycled gold (200 tonnes) from SGE withdrawals. Xu’s consumer demand equates exactly to how much gold was added to Chinese non-government reserves; typically this is what Chinese leaders track, the amount of gold held among the population. Total demand (equals supply) minus scrap = import plus mined gold. Scrap supply doesn’t add to a country’s reserves, only import and mine supply increase reserves.
All players in this game use different metrics to produce supply and demand figures, partially this explains the difference. In this post we’ll examine these metrics and go through the arguments the authority on gold, as the WGC has crowned itself, has brought up to enlighten us in the past years.
To capture a nation’s gold demand the authority only publishes end-user demand data (consumer demand measured at retail level) in the Demand Trends Reports (page 26).
Consumer demand
The sum of jewelry and total bar and coin purchases for a country i.e. the amount of gold acquired directly by individuals.
If you read the report you’ll notice the WGC measures end-user demand in the form of jewelry, bar and coin demand per country at retail level, next to “ETFs, OTC investment and stock flows” to compute global total investment. But, what if Chinese individuals buy physical gold at the SGE and have the gold withdrawn from the vaults to store the metal at their own discretion? Would this show up anywhere in demand numbers from the WGC? Fact is the SGE has over 5 million individual clients, according to the chairman of the SGE, next to 8,000 institutional clients!
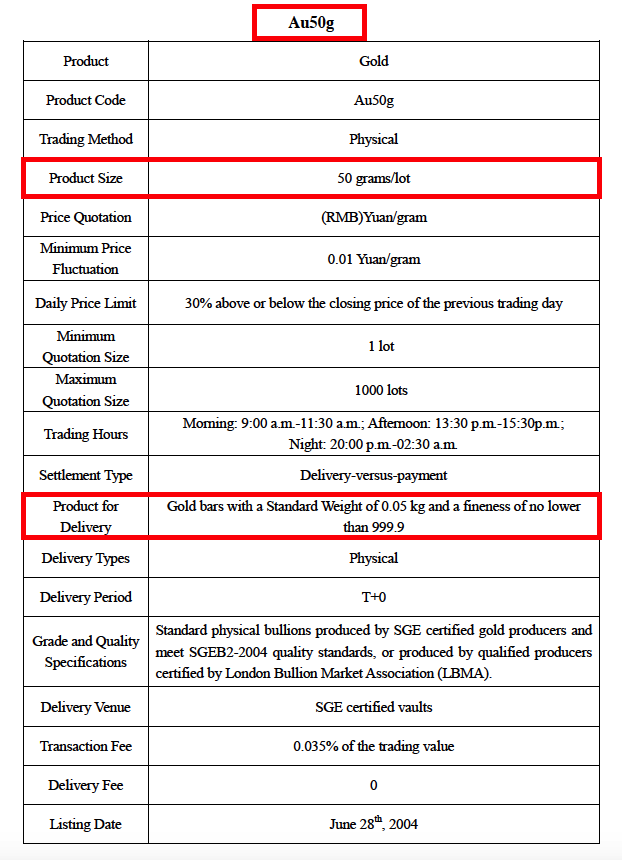
The reason the WGC only discloses end-user demand is because that’s all that matters to the price of gold, if a jeweler has 2 tonnes of inventory this is hedged and therefor has no net effect on the price. But measuring Chinese gold demand at retail level is inaccurate as every single Chinese citizen can open an SGE account, buy gold and withdraw. Most SGE products are denominated is small lots, consumer sizes: 1 Kg, 100 grams, 50 grams, and 10 grams. There is one product to trade 12.5 Kg bars, though this contract has only been active on three days since its inception (total volume since its inception accounts for 3 tonnes, measured unilaterally). SGE customers (potentially every single Chinese citizen) can buy and withdraw bars as small as 50 grams at the SGE, granted of the highest quality.
This is one of the reasons there is such a huge discrepancy between retail demand (WGC) and SGE withdrawals. Not all Chinese citizens buy their bars at a jewelry shop, au contraire.
The CGA Gold Yearbook 2013 shows us how demand is composed.
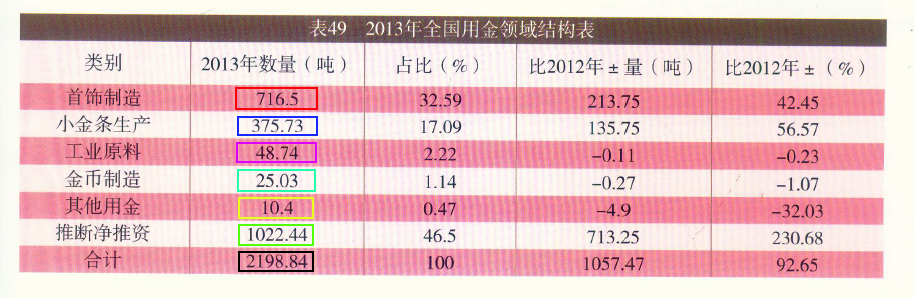
- Red = Jewelry manufacturing (716.5)
- Blue = Small gold bar production (375.73)
- Purple = Industrial material (48.74)
- Turquoise = Gold coin manufacturing (25.03)
- Yellow = Other (10.4)
- Green = Net investment (1,022.44)
- Black = Total (2,198.84)
I think Small gold bar production is the amount of non-SGE bars manufactured by jewelry companies, banks, etc.
If we add jewelry, bar, coin, industrial and other we get 1,176.4 tonnes. This is demand measured at retail level – which is close to what the WGC initially disclosed as demand. Than there is net investment of 1,022.44 tonnes. An SGE employee once told me this simply is a residual of SGE withdrawals minus what is measured at retail level, or, everything bought directly at the SGE that wasn’t sold at retail level. The huge difference between WGC demand and SGE withdrawals is mainly caused by net investment. The Council’s mission seems to be explaining why net investment is irrelevant, coming up with feeble arguments that should support this. Later on we’ll go through the argument list and what type of demand net investment can be.
Now, let’s have a look at the supply side.
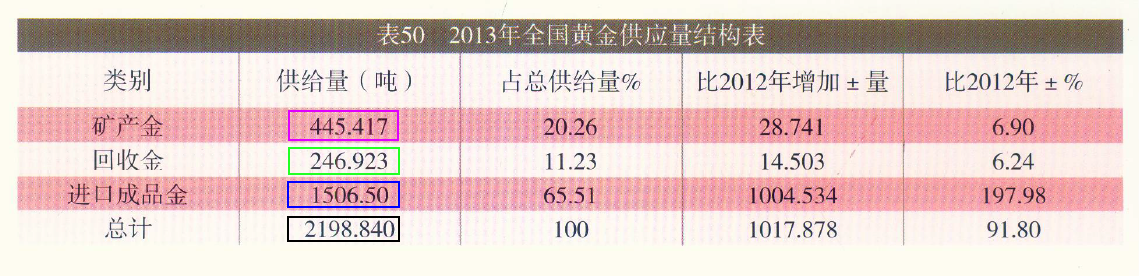
- Purple = Domestic and overseas mine output (445.417)
- Green = Recycled gold (246.923)
- Blue = Bullion import (1,506.50)
- Black = Total (2,198.840)
From this article we know in 2013 China domestically mined 428.16 tonnes and 17.25 came from offshore activities, so actually 1,523.75 tonnes were imported. SGE withdrawals accounted for 2,196.96 tonnes in 2013, meaning 1.88 tonnes (2,198.4 – 2196.96) were imported in the form of ie jewelry that wasn’t required to be sold through the SGE.
In Understanding China’s Gold Market the WGC notes there are two types of recycled gold in China.
Recycling: There are two types of recycled gold: i) Gold-for-cash and ii) gold-for-gold. At a retail level consumers can sell gold for cash or, especially in the case of jewelry, exchange old pieces of gold for new pieces of gold. It may be that in tonnage terms, gold-for-gold recycling is similar in size to gold-for-cash recycling: we recently surveyed 1,000 consumers and found that 8% of gold owners had sold gold-for-cash, while 10% had exchanged gold-for-gold. At a wholesale level banks and jewelers may also sell or exchange gold stock with other suppliers.
I fully agree, again we see the difference in metrics; gold-for-cash is what GFMS measures (150 tonnes in 2013), gold-for-gold is measured by the CGA as a residual.
SGE withdrawals – import – mine – gold for cash supplied to the SGE = 96.923 tonnes
Hence total recycled gold in Exhibit 6 is disclosed at 246.923, this is gold-for-cash and gold-for-gold. More information on recycled gold in China according to CGA metrics we can read in the China Gold Market Report 2008 and 2009:
… At present, gold scrap in China mainly is in two major forms: repurchase of gold bars, only applicable to brand gold bars in reference to real-time gold price, and repurchase of gold jewelry through retailers.
… China’s actual gold recycling likely reached 100 tons in 2008. Physical gold withdrawals on the Shanghai Gold Exchange (SGE) topped 543.19 tons in the year, including gold imports of 81.44 tons by commercial banks, stock carry-over of 31.661 tons from 2007 and 282.007 tons of gold produced in the year. In theory, the gap of 148.082 tons was filled by recycled gold. Therefore the gold recycled in China in 2008 should have amounted to more than 100 tons in 2008.
A few years later (2014) from the WGC in Understanding China’s Gold Market:
Given the complexity of the market there could be many reasons, but the most likely explanation is that the SGE delivery figure includes the flow of recycled gold-for-gold as well as gold-for-cash. As explained previously, while recycled gold-for-gold will increase supply and demand, the net effect is market neutral. For this reason, demand and recycling estimates as reported in Gold Demand Trends and GFMS, Thomson Reuters’ Gold Surveys exclude recycled gold-for-gold. But because the structure of the Chinese gold market requires refined and recast recycled gold to be sold through the SGE [this is not mandatory, tax incentives stimulate refined gold to be sold through the SGE], it is likely the delivery figure captures this circulation of recycled gold-for-gold.
The next flow chart from the WGC is also quite helpful:
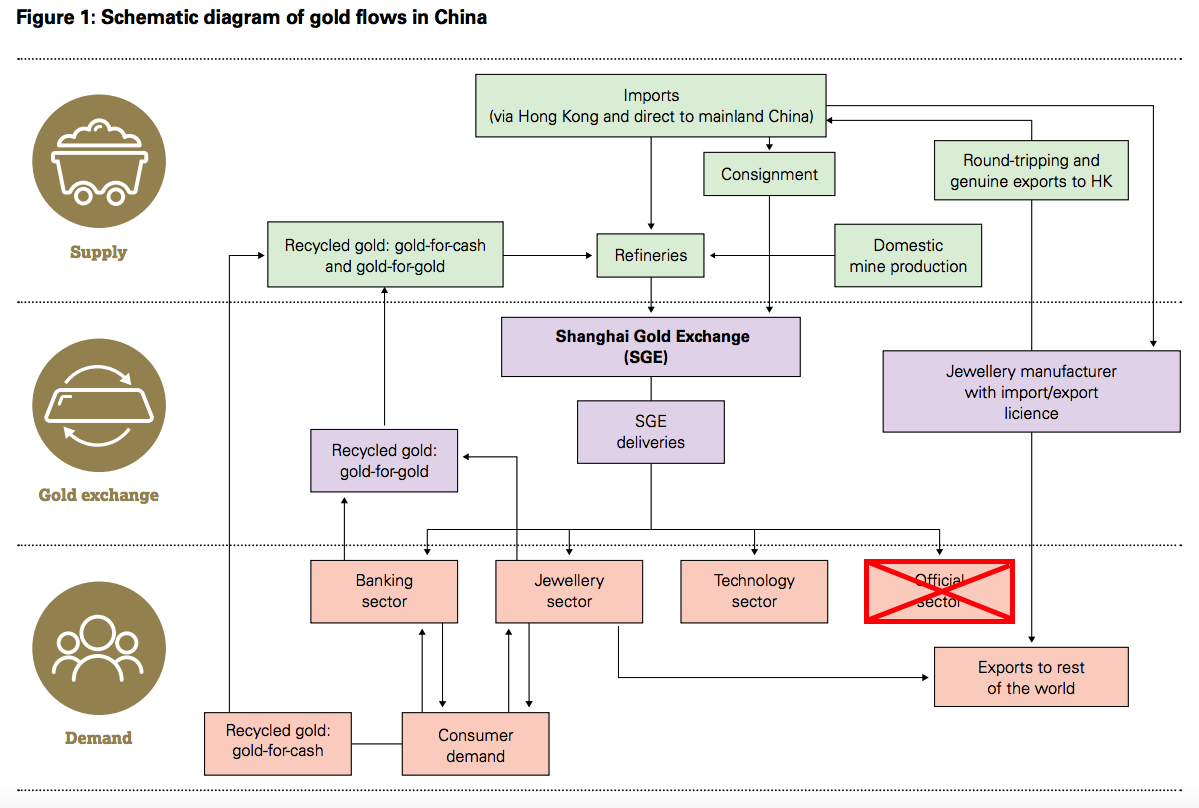
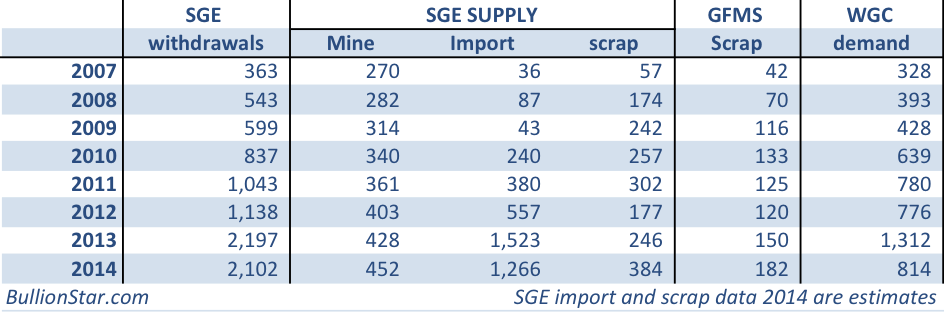
I hope it’s clear now what different metrics are used for both supply and demand. If we take another look at the Exhibit-2-chart, supplemented by import, mining and scrap data, it becomes more clear what the difference is.
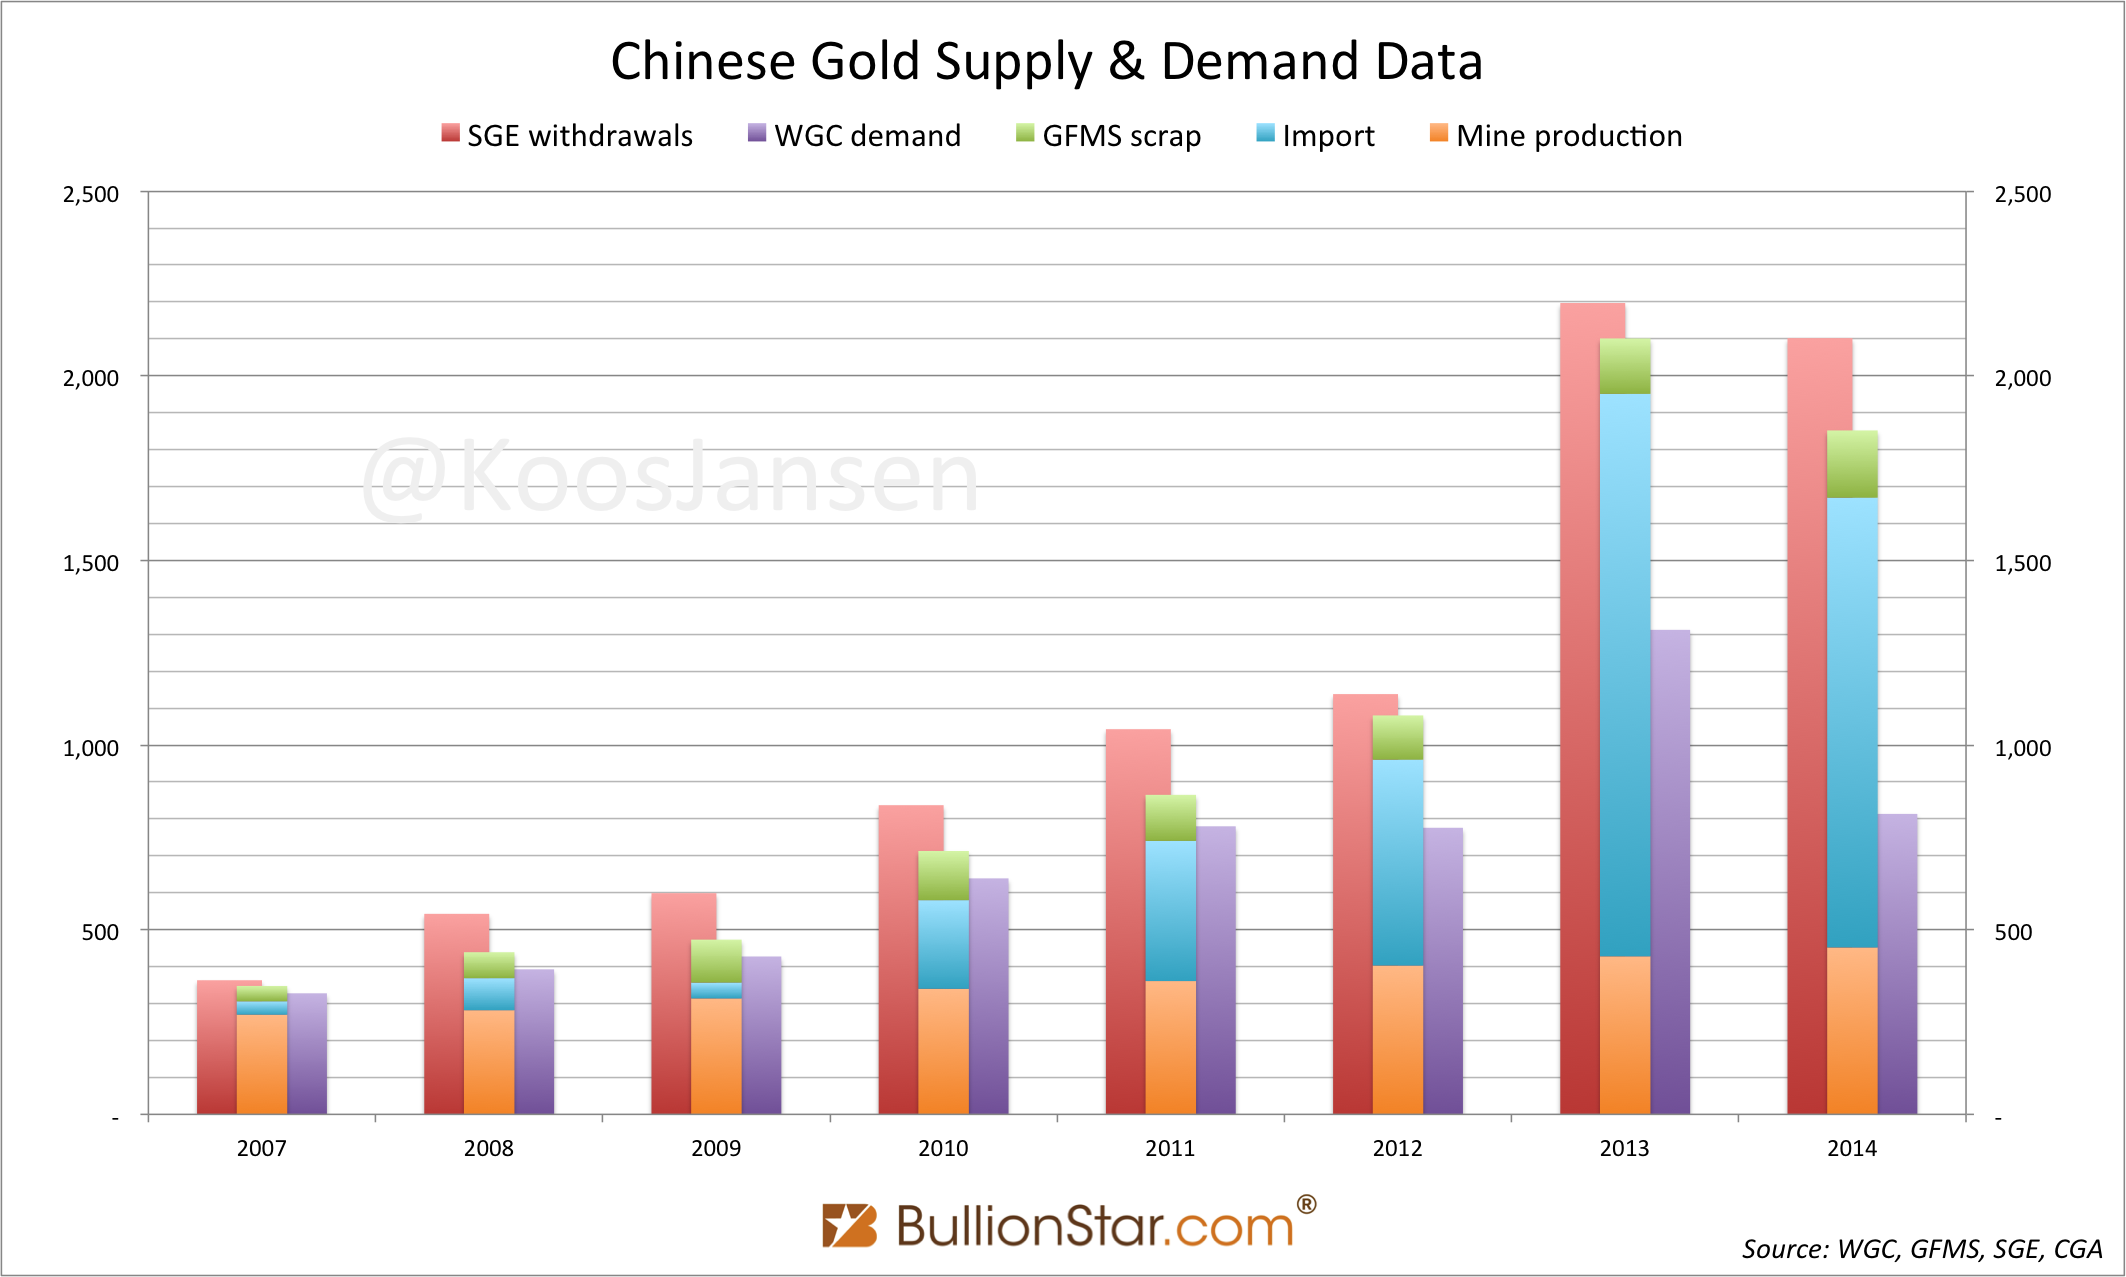
Even if we take out gold-for-gold scrap supply (the green bars represent gold-for-cash scrap) total aggregated supply from 2007 to 2014 was 7,872 tonnes, while total aggregated WGC demand over this period was 5,469 tonnes. Leaving 2,403 tonnes to be explained by the Council in their argument list, which is focused on the ‘surplus’ in the Chinese gold market, but indirectly aimed at debunking the size of SGE withdrawals.
Chinese Commodity Financing Deals
Gold is used in two sorts of Chinese Commodity Financing Deals (CCFD) to raise cheap funds: round tripping and gold leasing (read this post on the details of round-tripping, this and this on gold leasing). CCFD’s are definitely on the WGC’s argument list.
As I’ve mentioned above the WGC has published two China specials to explicate where a few thousands tonnes of gold went missing somewhere on the Asian continent, next to all quarterly Gold Demand Trends.
1) China’s gold market: progress and prospects (April 2014)
2) Understanding China’s Gold Market (July 2014)
In the first report on page 56 it’s stated, “round-tripping can inflate the SGE delivery figures”. This is absolutely not true, as I have extensively written about in The Round Tripping Myth And Why It Doesn’t Hurt Chinese Gold Demand. No need to repeat myself.
Also on page 56:
The ‘surplus’ in the Chinese market mainly stems from either possible official purchases or the extensive use of gold for financial operations.
… No statistics are available on the outstanding amount of gold tied up in financial operations linked to shadow banking but Precious Metals Insights believes it is feasible that by the end of 2013 this could have reached a cumulative 1,000t…
Although the mainstream media got completely carried away with the assumption 1,000t was tied up in CCFD’s, in reality it’s not so worrisome. Because it doesn’t involve round- tripping it can only be gold leasing. Somewhat simplified, only three parties engage in leasing gold to raise cheap funds: jewelers, miners and speculators. In China all gold leasing is settled through the SGE. If miners or speculators lease gold, they would instantaneously sell it spot at the SGE – they would not withdraw – and use the proceeds for investments. Only jewelers would withdrawal leased gold from the vaults to fabricate jewelry, subsequently sell the jewelry and use the proceeds to repay the gold loan. These withdrawals would eventually end up at retail sales. Additionally, it’s not likely a jeweler purchases gold off-SGE to have it refined and bring it to the SGE vaults to settle the lease, because the jeweler can simply buy directly at the SGE to settle the lease. This means gold leasing (CCFD’s in general) does not inflate SGE recycled gold supply.
In my opinion CCFD’s cannot substantially distort Chinese wholesale demand (SGE withdrawals). Occasionally I read numbers on the size of the Chinese gold lease market, though for me it is impossible to say what share is withdrawn or processed within the SGE system. I only know the part that is withdrawn is mostly genuine gold business.
In Gold Demand Trends Full Year 2014 the Council states:
The flow of gold into China has far exceeded the amount needed to meet domestic jewelry and investment demand in recent years [please tell us gold investors how much!]. The role of the commercial banks in using this gold for financing purposes has been well documented, including in our report Understanding China’s Gold Market and this activity expanded in 2014. To some extent, this helps explain why Shanghai Gold Exchange delivery figures are significantly higher than consumer demand.
If the only document they disclose on CCFD’s is Understanding China’s Gold Market, there is nothing new for us to learn. Yes, jewelers can lease gold, have it withdrawn and produce it into jewelry while it’s pending to be sold in retail. But this gold will not return to the SGE, so eventually it will be end-user demand. The part that is pending can partially explain the difference.
Commercial banks can have all sorts of gold (leases, pledges, ETF’s, gold savings accounts, etc) on their balance sheet, this doesn’t mean this gold has left the SGE vaults. In China gold ETF’s are backed by SGE contracts.
Official Purchases
We just read on page 56 from China’s gold market: progress and prospects, the difference might be explained by PBOC purchases. However, on page 9 from Understanding China’s Gold Market:
China’s authorities have a range of options when purchasing gold. They may acquire some of the gold which flows into China; there has been no shortage of that. But there are reasons why they may prefer to buy gold on international markets: gold sold on the SGE is priced in yuan and prospective buyers – for example, the PBOC with large multi-currency reserves – may rather use US dollars than purchasing domestically-priced gold. The international market would have a lot more liquidity too.
That’s what I wrote in this post (April 2014), it seems the WGC turned 1800 and agrees the PBOC doesn’t buy gold through the SGE.
PBOC purchases remain a very tough subject to analyze. I know they buy gold, but I have weak evidence of how much. The theory of China implementing the Turkish model to build official reserves is interesting, yet one of many problems with this theory is that the PBOC has a very strong incentive to diversify $4 trillion in FX reserves from US dollars into physical gold. So, until I bump into any evidence that would suggest otherwise, the PBOC does not buy any gold through the SGE.
Import
There are incredible amounts of gold imported into China. The Council has often noted on the argument list exact data is hard to get by because round tripping and scrap flows may distort import figures. From page 14, Gold Demand Trends Q1 2014:
Trade flows: illustrated last year when gold flowed out of western ETFs, through refineries in Switzerland and to consumers in the East, official trade data can provide insights into global gold flows. Global Trade International Services provide access to a wide range of countries’ trade data and we also monitor individual countries’ trade data, particularly from the Hong Kong Census and Statistics Department. However, looking purely at trade data can be misleading. It can include scrap, doré and concentrates, which would be captured in supply rather than demand. Nuances such as ‘round-tripping’ can affect the data too. So, while trade data plays a valued role in informing a view on global gold flows, it is an imperfect measure of gold demand.
I’ve written an extensive post on why this is not true. In the CGA Gold Yearbook 2013, it’s precisely disclosed how much gold is imported. For other years data is available as well.
Stock Inventory
Next on the argument list is stock inventory. As demonstrated above, if a jeweler has 2 tonnes of inventory this is likely hedged, which makes it for the Council’s metrics not count as demand. From Understanding China’s Gold Market:
… It is, however, indicative that as jewelers expanded, so too did their inventory levels and it is our judgment that across the industry between 75t to 125t may have been absorbed in the supply chain since 2009.
Ok, let’s go along with this, 125 tonnes of gold (at max) is held by jewelers and alike as inventory.
The Shanghai International Gold Exchange
Something the WGC hasn’t listed on the argument list, which they should, is trading on the Shanghai International Gold Exchange (SGEI). Because SGE withdrawals at this stage also capture potential withdrawals from the SGEI in the Shanghai Free Trade Zone, this can distort withdrawal numbers in the domestic market. However, trading on the SGEI has been faint since its launch, so in my opinion it doesn’t play a substantial role now. Read this post for a detailed explanation.
Conclusion
The difference in metrics should be clear; SGE withdrawals are the widest measure to capture demand, whilst WGC demand is said to capture retail demand. Though, I think there is a lot of demand from individuals and institutions that buy directly at the SGE that is overlooked by the WGC.
If we stick to WGC metrics (not count gold-for-gold supply) the only legitimate argument that can explain the difference is stock inventory, either purchased at the SGE or leased at the SGE by wholesalers. According to the Council this accounts for 125 tonnes. Exhibit 8 showed us the gap between supply from 2007 to 2014 (7,872 tonnes) and WGC demand over this period (5,469 tonnes) is 2,403 tonnes. So, the difference is 2,403 tonnes and the only real WGC argument we can find to fill this void is 125 tonnes of stock inventory.
In my humble opinion stock inventory can be higher than 125 tonnes, say 300 tonnes, but this would still not fill the gap. Therefor the WGC massively understates Chinese gold demand. 2014 Chinese gold demand disclosed by the WGC is 814 tonnes, though supply was approximately 1,850 tonnes (excluding gold-for-gold), SGE withdrawals accounted for 2,102 tonnes.
Gold-for-cash scrap (GFMS’ scrap numbers) supply is not required to be sold through the SGE, theoretically it could be refined into, for example, goldwire and sold directly to jewelers. Aggregated mine and import supply from 2007 to 2014 is 6,934 tonnes.
For anyone who is interested in analyzing the Chinese gold market, here are some numbers to begin with:
One last point I want to make; if we look below at the weekly SGE withdrawal chart since 2010 we can see spikes around every New Year / Lunar Year (and from April – September 2013 due to the crash in the gold price) when traditionally the Chinese people buy presents for each other, often gold. Would this chart look the same if SGE withdrawals also contained CCFD’s or official purchases? Or would the chart than look more seasonally independent? In my opinion, IF the PBOC would acquire gold through the SGE the chart would look more seasonally independent.

CPM Group
Somewhere in November 2014, Jeffrey Christian, Managing Partner of CPM Group, wrote an email to one of my colleagues, arguing SGE withdrawals are not what they seem. The post in which my colleague published the email and responded is taken offline (dead link), but here’s the email in full:
…,
Someone sent me a piece you wrote on gold, in China but also elsewhere.
One comment: You use SGE gold deliveries seemingly as a surrogate of gold demand. A significant amount of the gold purchased by jewelry and electronics manufacturers and used in making products is re-refined and returned to dealers as new or process scrap. I presume you know that. The scrappage rate for most manufacturing of gold products is between 50% and 70%, depending on the processes used in manufacturing various jewelry, electronics, dental implants, catalysts, and other products. This means that the ‘end demand’ of gold that goes off into products to customers is substantially less than the amount delivered, via the SGE or any other supplier anywhere in the world.
For example, let us assume a manufacturer – it could be a jeweler or an electronics component maker – uses sputtering targets, as most of them do for the past many, many years. The new scrappage rate in the manufacturing process is 70%. In this example, let’s say that the manufacturer is using 10,000 ounces per month, buying 10,000 ounces per month through the SGE, having it made into sputtering targets, using the targets (or, in reality, selling them to clients who use them), and then collecting the process scrap, having it re-refined, and returning it to a dealer. In reality, there are various companies involved in this loop, but let’s keep it simple and say, the manufacturer. So, each month the manufacturer is buying 10,000 ounces of gold via the SGE, using 3,000 ounces in products, and recycling 7,000 ounces. At the end of the year, it will have taken delivery of 120,000 ounces of gold, but will have used 36,000 ounces of gold. The remaining 84,000 ounces of gold will have recirculated through the market repeatedly, each time being counted as an SGE delivery. So, if you are trying to guess how much gold is being used in jewelry, electronics, and other manufacturing processes in China by looking at SGE deliveries, you would be over-estimating actual demand or use by 233%.
I assume anyone writing about fabrication demand levels for gold knows this, but thought I would mention it to you in case it’s news to you. I know that when I mention it in presentations to mining executives, institutional investors, Eric Sprott, the WGC, and other gold market participants or observers, they often have no idea of this, and sometimes cannot even understand the processes I am describing.
I hope this helps. See you soon, next year, I hope.
Sincerely,
Jeff Christian
The key takeaway of Mr Christian’s letter is that the scrap rate in China is much higher than we think and it’s all recycled through the SGE (note, in the process he describes the recycled gold is not required to go through the SGE). My reply is, if we look at Exhibit 6 we can see that by the widest measure SGE scrap supply is 247 tonnes. If we subtract all scrap (247) from SGE withdrawals (2,197), we get 1,950 tonnes. Mr Christian notes this over-estimates demand by 233 %. So actual demand was 585.6 tonnes in 2013??
Popular Blog Posts by Koos Jansen
 China’s Secret Gold Supplier is Singapore
 Audits of U.S. Monetary Gold Severely Lack Credibility
 China Gold Import Jan-Sep 797t. Who’s Supplying?
 The Gold-Backed-Oil-Yuan Futures Contract Myth
 Estimated Chinese Gold Reserves Surpass 20,000t
 PBOC Gold Purchases: Separating Facts from Speculation
 U.S. Mint Releases New Fort Knox Audit Documentation
 China Net Imported 1,300t of Gold in 2016
 Why SGE Withdrawals Equal Chinese Gold Demand and Why Not