
How Much Gold Is China Importing?

 Koos Jansen
We have some catching up to do in terms of discussing Chinese gold import in H1 2015 and how this relates to withdrawals from Shanghai Gold Exchange (SGE) vaults. For this post it’s advised you’ve read The Mechanics Of The Chinese Domestic Gold Market to have a basic understanding of the physical gold supply and demand flows through the Shanghai Gold Exchange within the Chinese domestic gold market.
SGE withdrawals in 2015 are stronger than ever. Although, SGE withdrawals are (seemingly) less correlated to Chinese gold import this year, nonetheless Chinese gold import in the first six months of 2015 was higher relative to the same periods in the years before.
Chinese Gold Market Recap
I started reporting on SGE withdrawals in 2013 because I noticed these numbers exactly equaled Chinese gold demand as disclosed in the China Gold Association (CGA) Yearbooks 2007 until 2011. In addition, the structure of the Chinese gold market appeared to be designed to direct all Chinese gold supply through the SGE. Therefor, what comes out of the SGE (withdrawals) must equal total supply, which must equal total (wholesale) demand.
SGE withdrawals equal domestic mine output plus recycled gold supply plus import. Therefor, by using withdrawal data from the SGE, Chinese domestic mine output figures from the CGA and estimate the amount of recycled gold supply, we could calculate import.
Mine + recycled gold + import = SGE withdrawals
And:
Import = SGE withdrawals – mine – recycled gold
SGE withdrawals proved to be a very effective tool to estimate import figures and measure Chinese wholesale gold demand. That is, until the Chinese gold market changed. In 2014 the Shanghai International Gold Exchange (SGEI) opened its doors, potentially inflating SGE withdrawals from the Shanghai Free Trade Zone without this gold ending up in the Chinese domestic gold market, and recycled gold supply increased significantly relative to 2013. From late 2014 I started writing SGE withdrawals were more difficult to analyze because of these changes in the Chinese gold market. After a period of abstinence from my side in reporting on SGE withdrawals, in this article we will resume to analyze the physical supply and demand flows in the Chinese domestic gold market.
The challenge is that China does not disclose gold import data in its regular customs reports. To find out how much China is importing we must use the foreign trade data statistics from all countries that export to China. A few years ago the bulk of Chinese gold import came in through Hong Kong and so gold export data from the Hong Kong Census and Statistics Department roughly elucidated how much China was towing in. Currently, China is importing gold directly from many other countries. To grasp how much gold China is importing I’ve started to chase the foreign trade statistics from all the major gold hubs (UK, US, Switzerland, Singapore, Hong Kong, Turkey, Dubai) and the big miners (Russia, South Africa, Ghana, Australia, Brazil, Canada, Mexico, Peru, Uzbekistan). Unfortunately this study is taking far longer than I was hoping for – in some countries the customs representatives, when finally contacted, are very sluggish in replying to my emails. I will share the data I have collected so far.
How Much Gold Has China Imported In H1 2015?
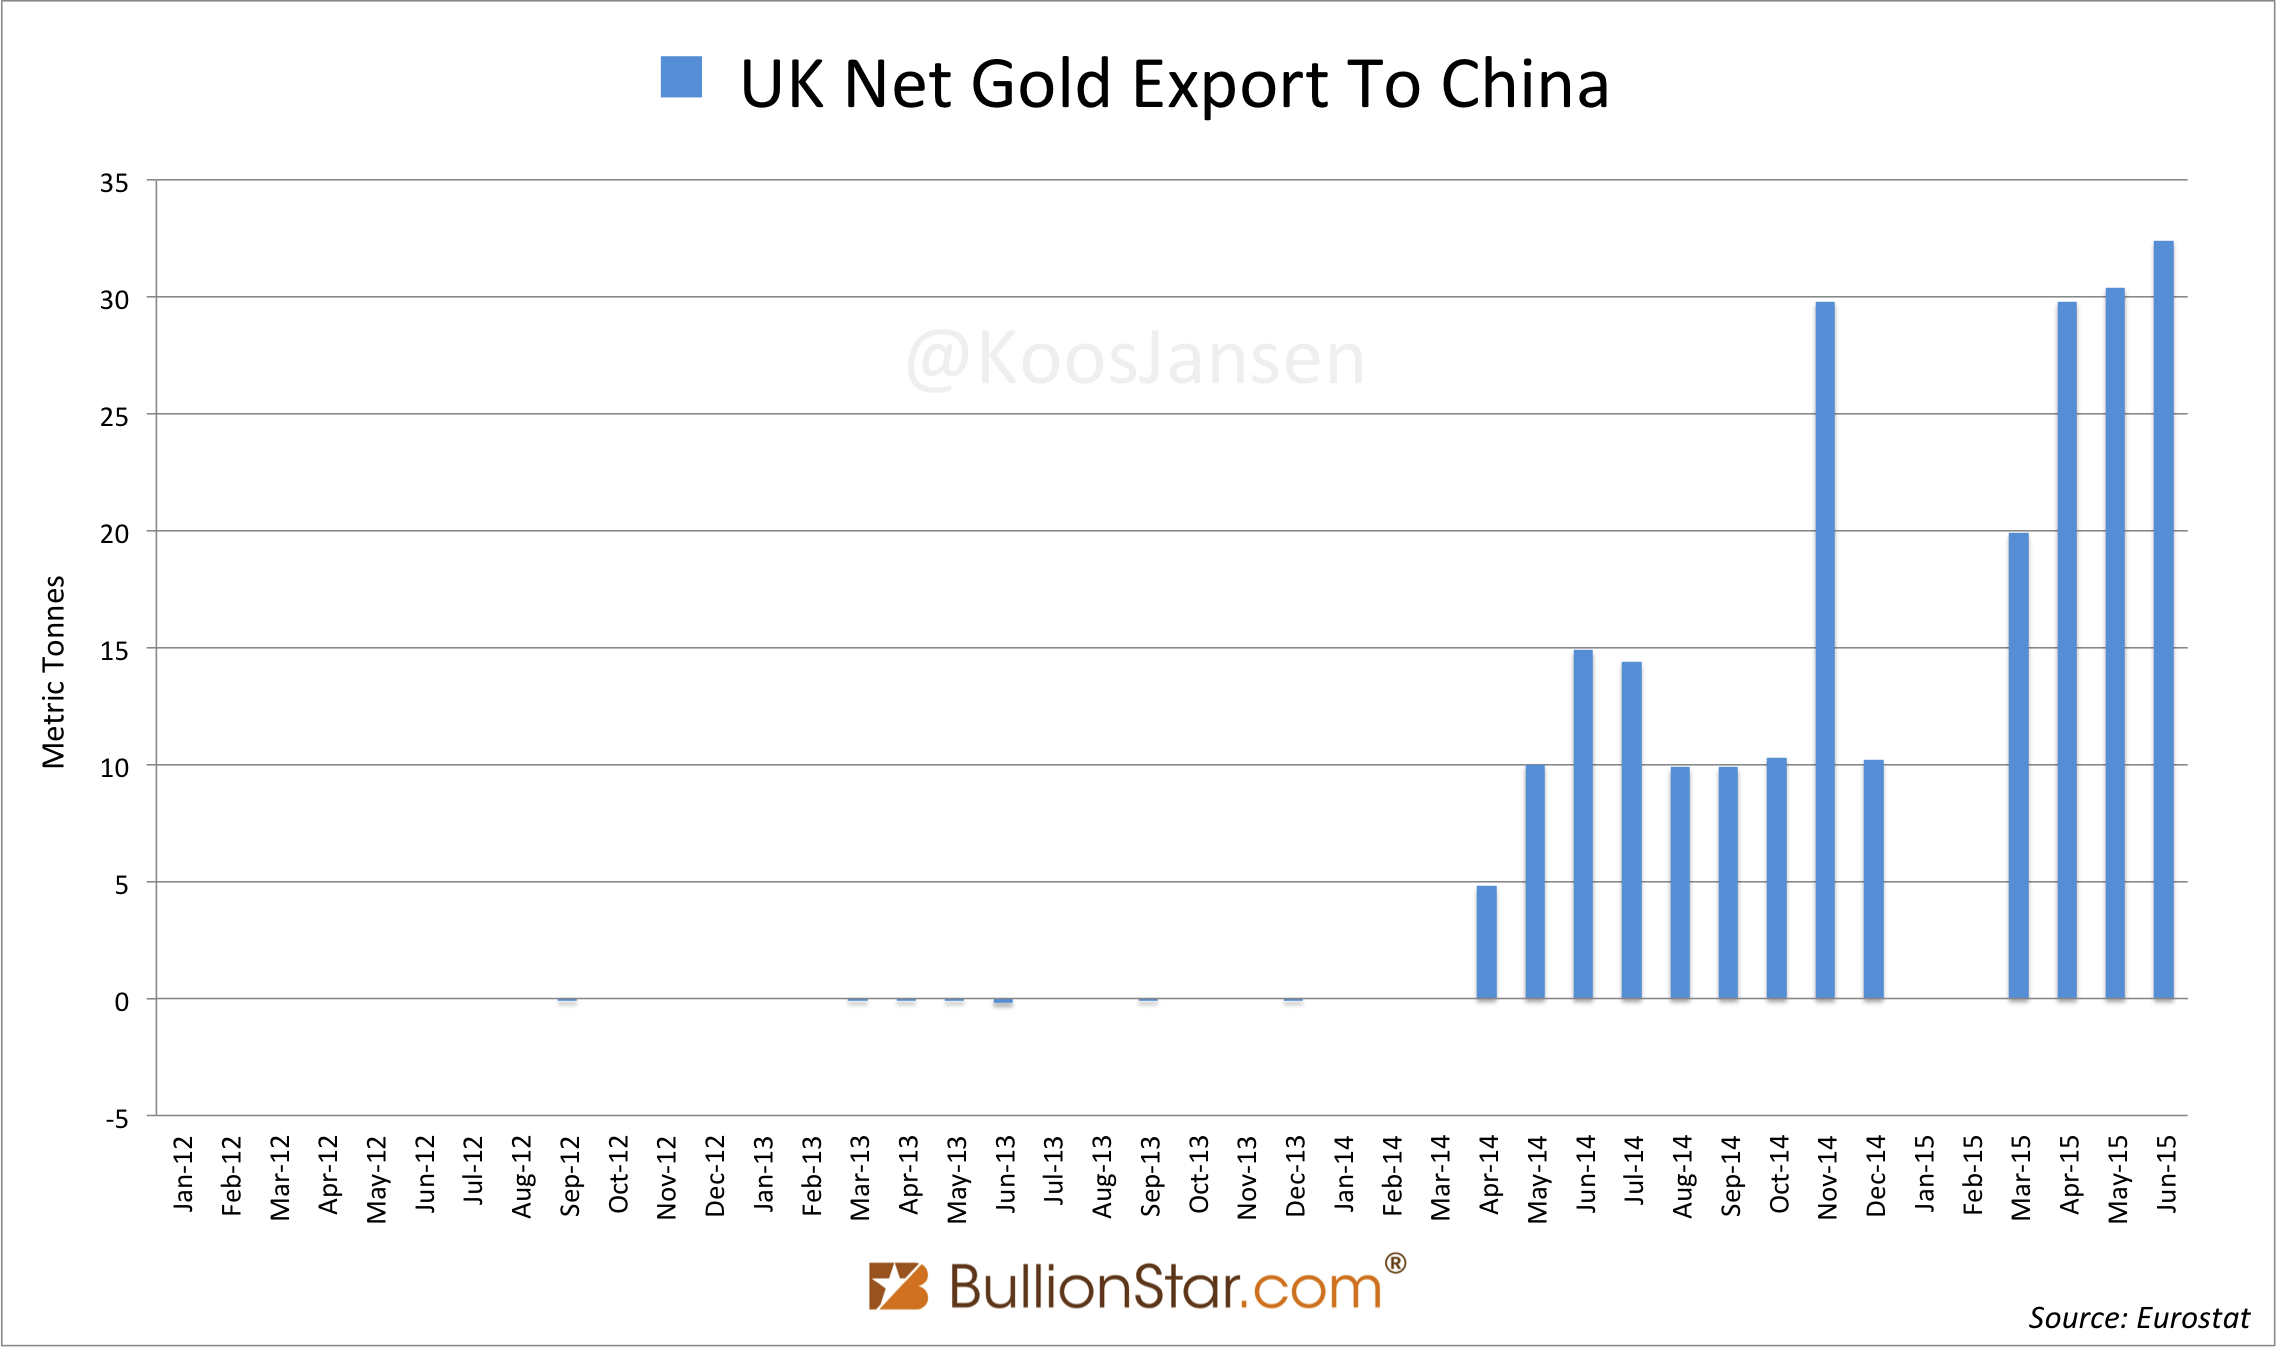
On 4 September I published an introduction to this research. The article was about the gold exports from the UK directly to China, which has been 112.5 tonnes in the first half of 2015.
H1 2015 UK net export to China: 122.5 tonnes.
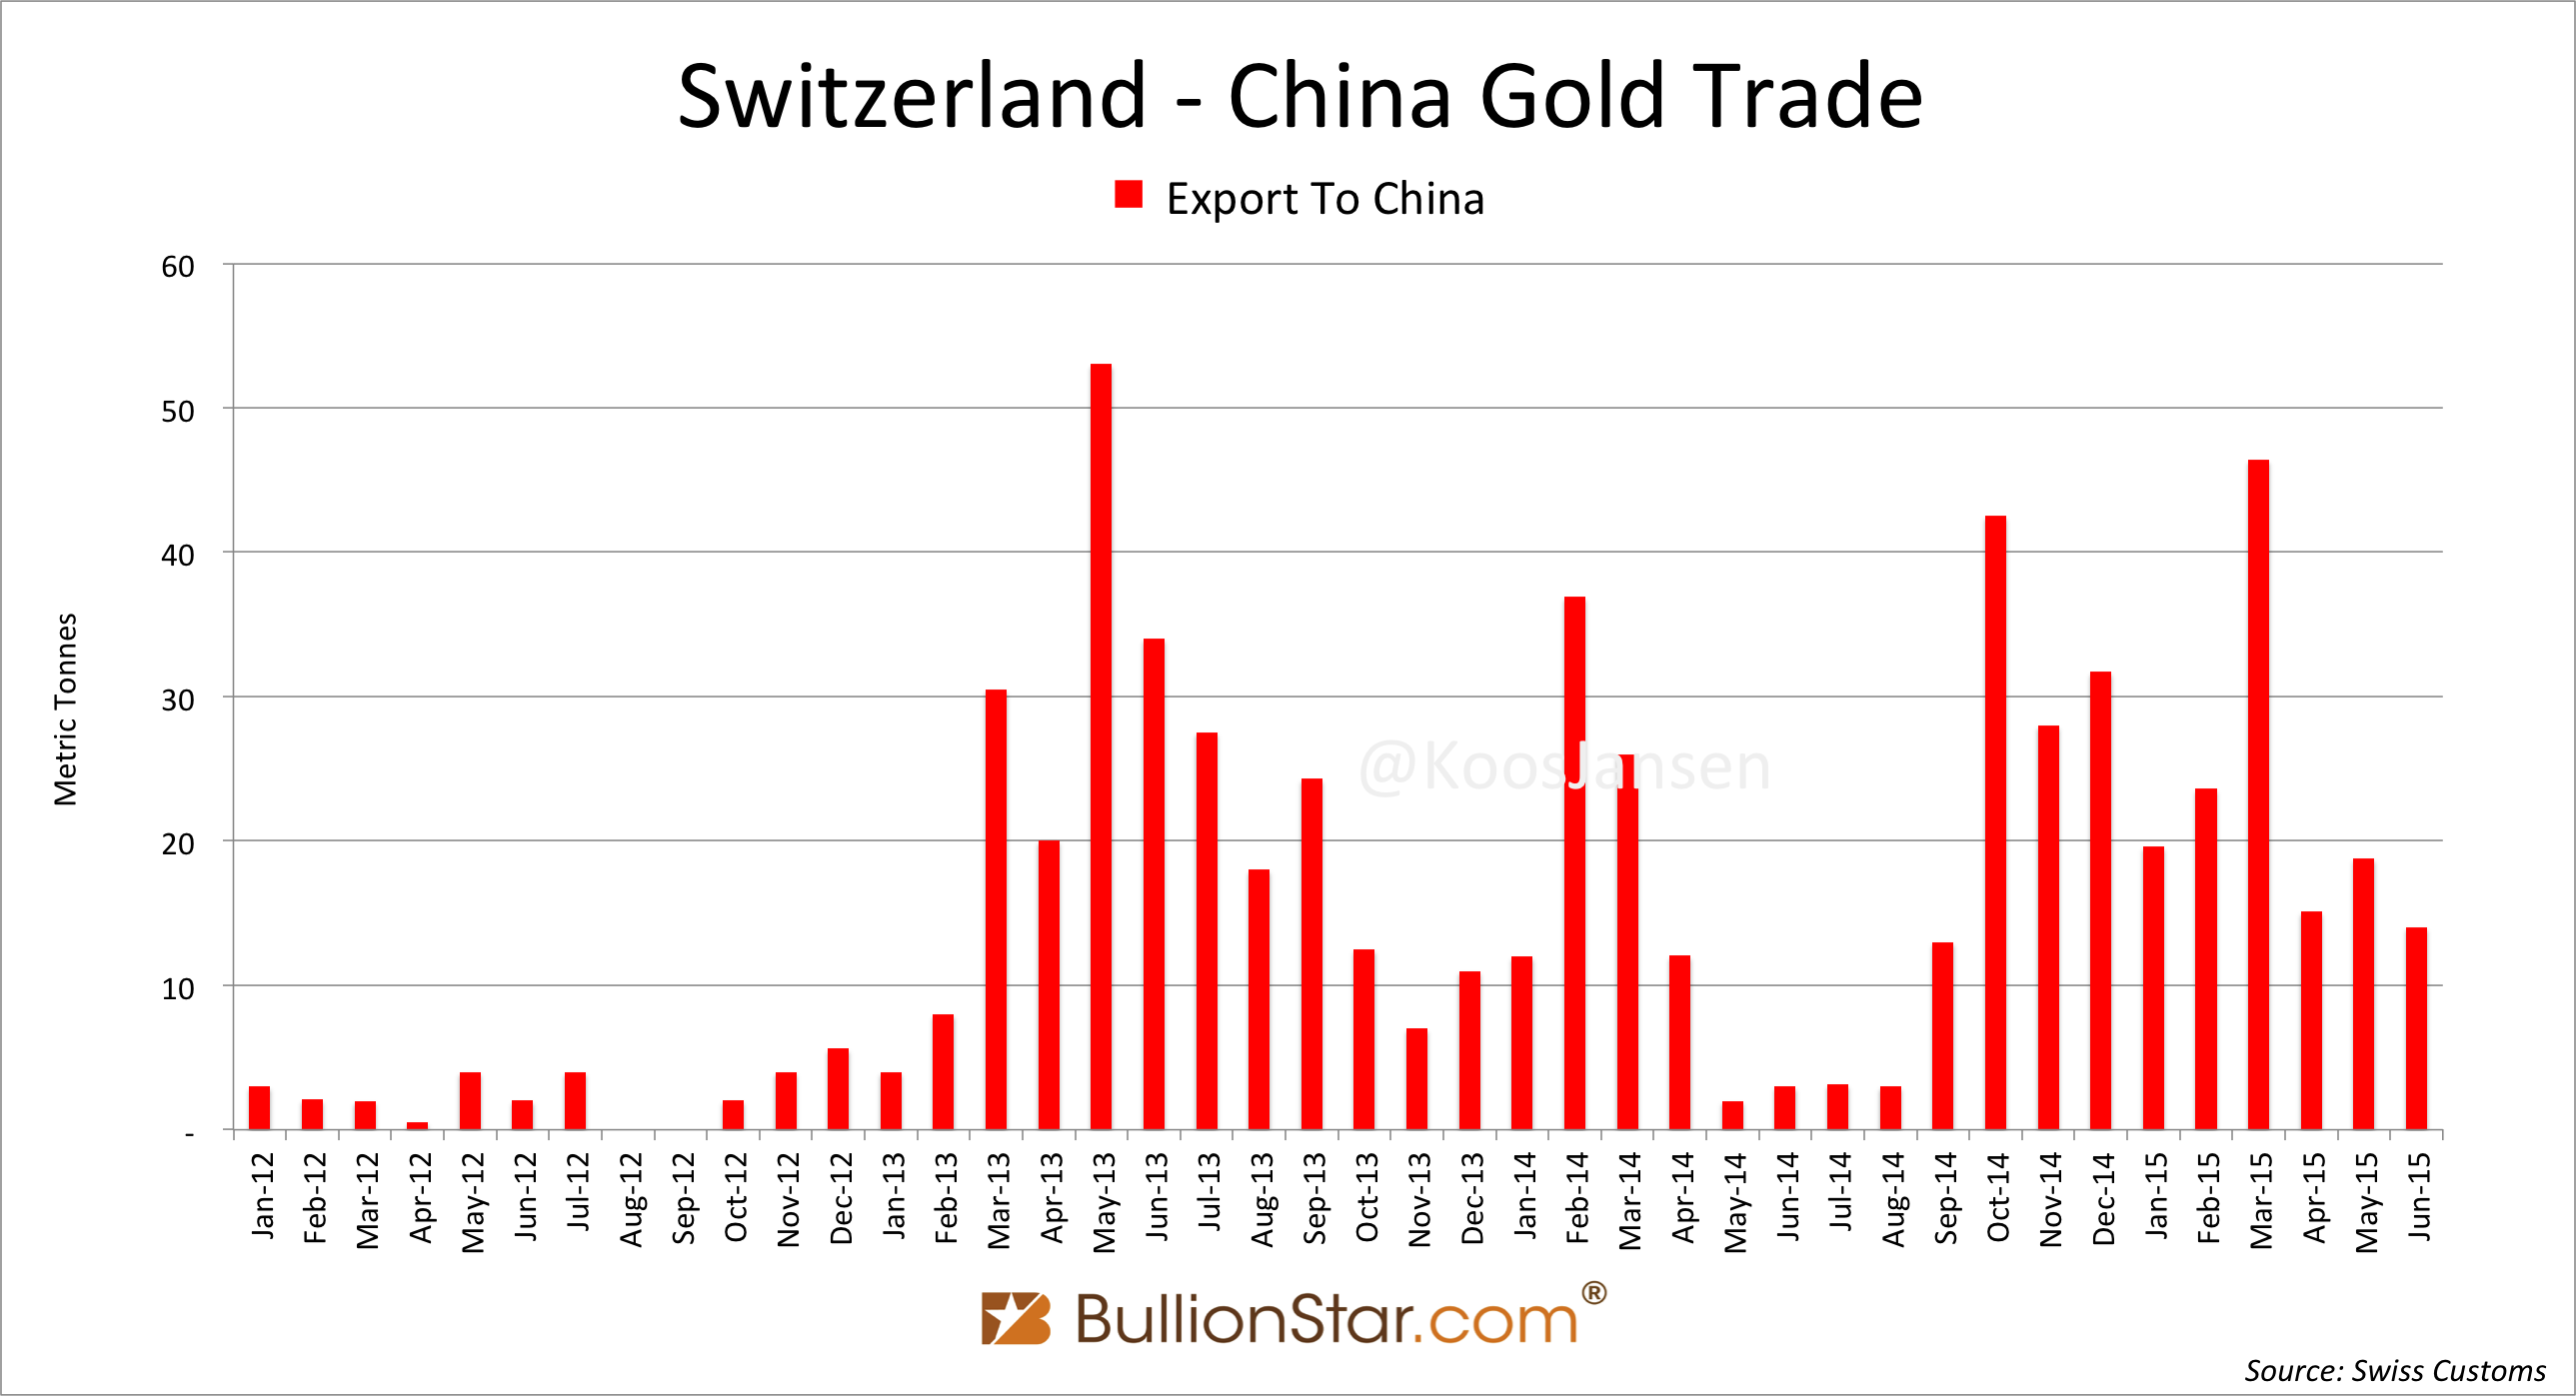
According to Swiss customs they shipped 137.5 tonnes of gold to China in the first six months of this year.
H1 2015 Swiss net export to China: 137.5 tonnes.
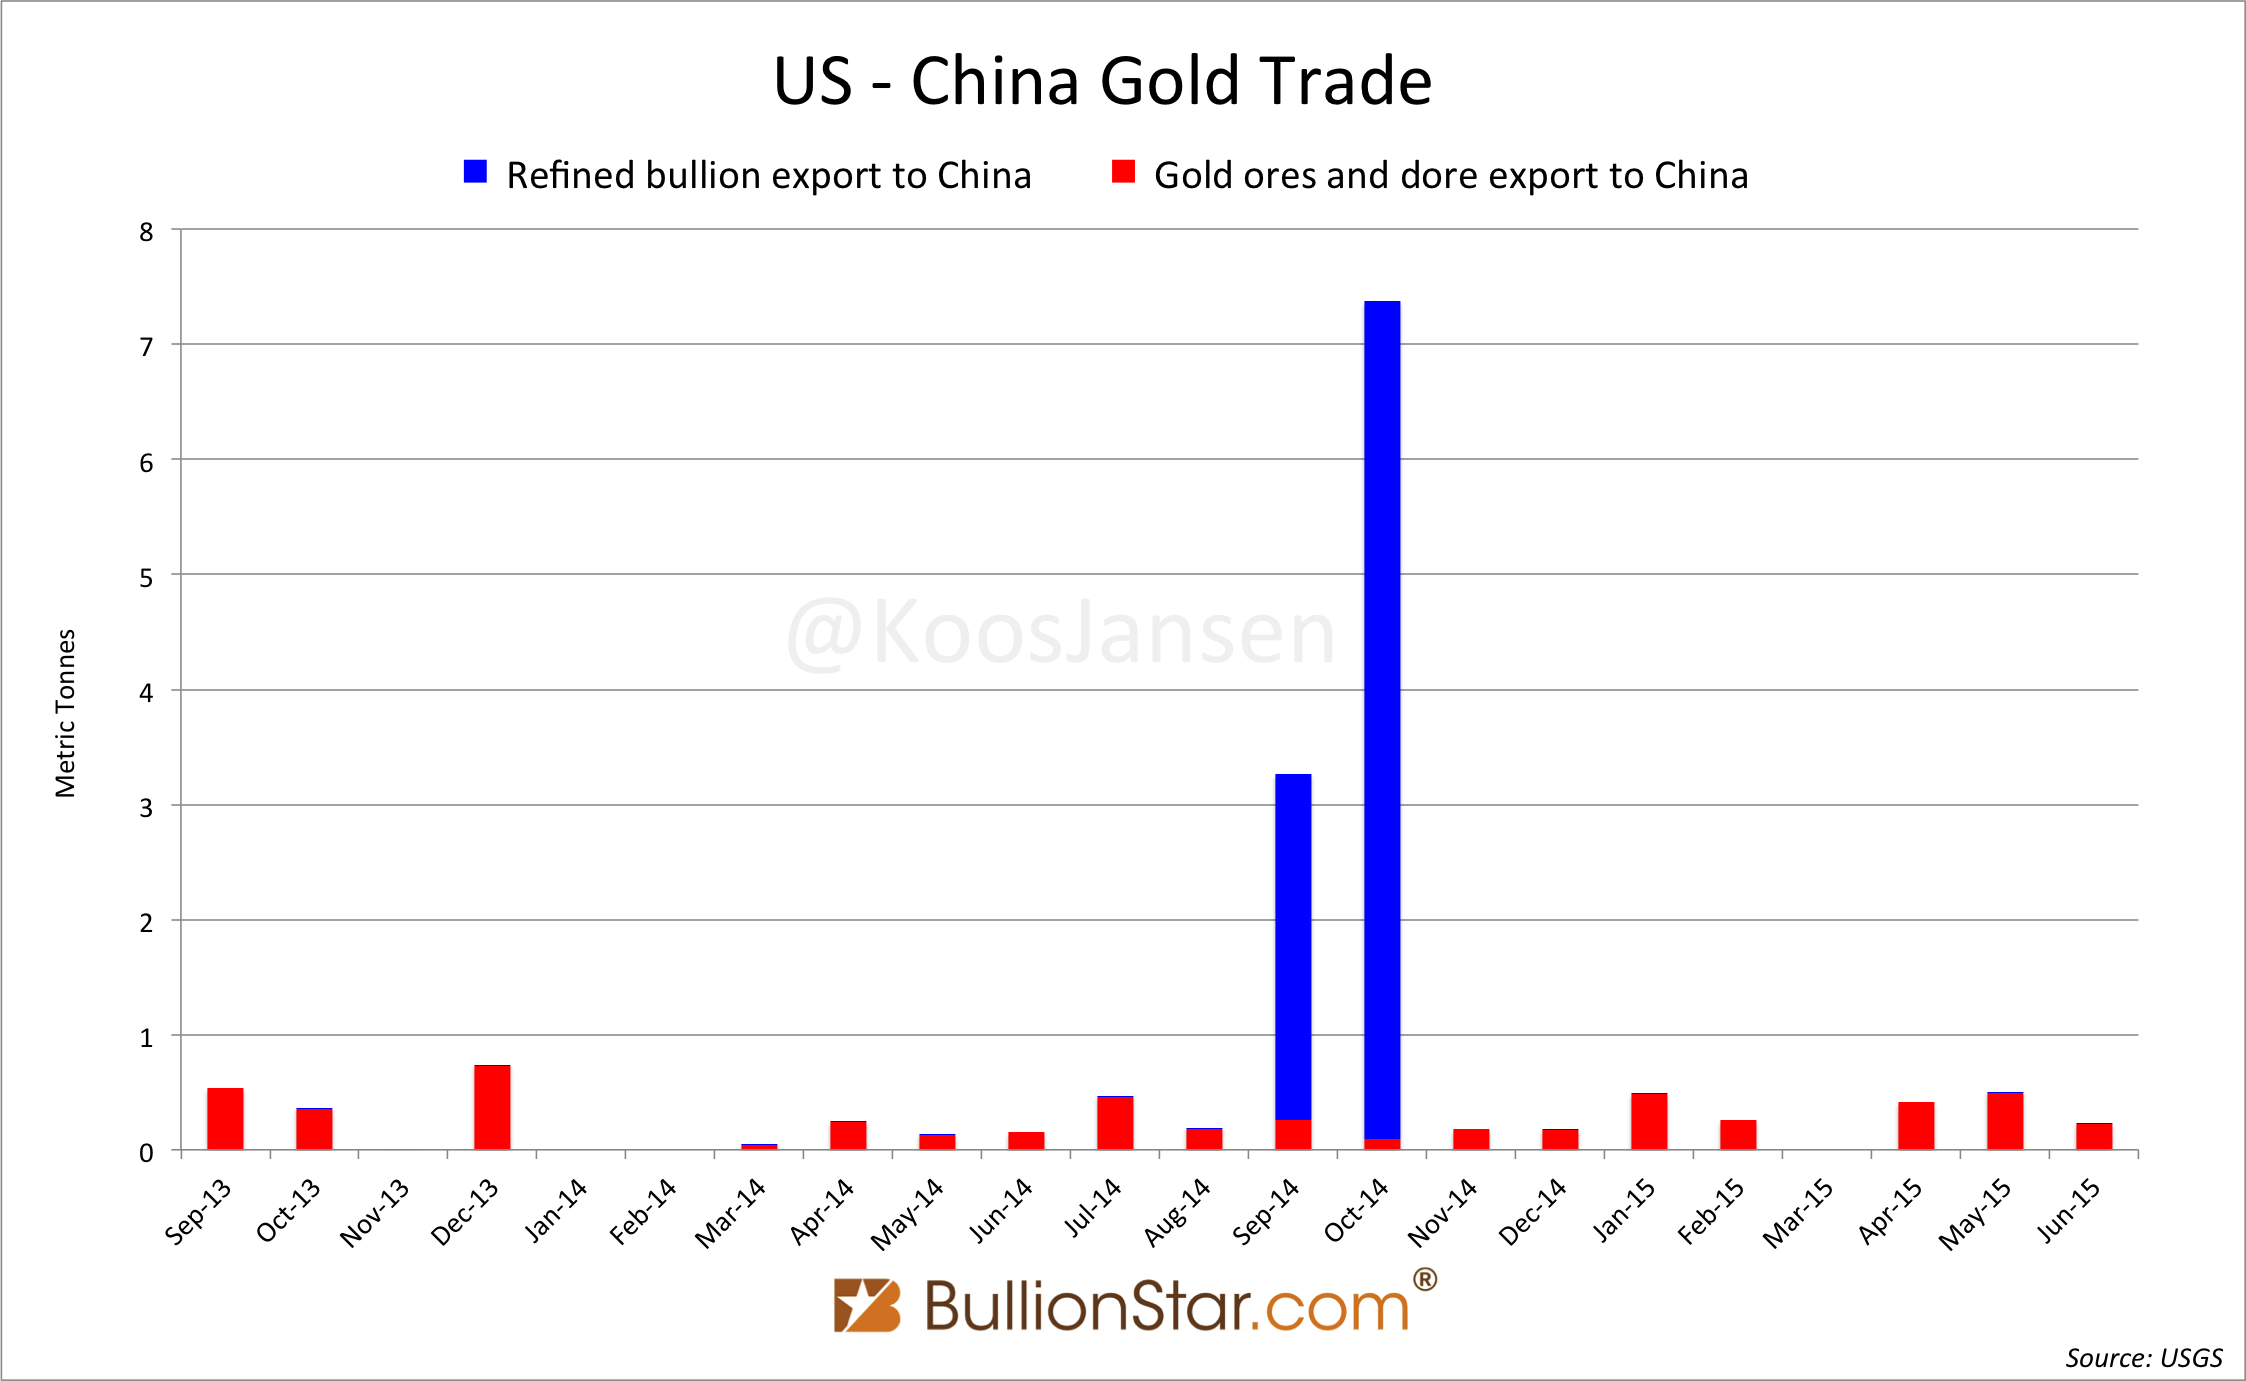
Direct gold exports from the US to China is very small, according to official data, it was about 1.6 tonnes in H1.
H1 2015 US net export to China: 1.6 tonnes.
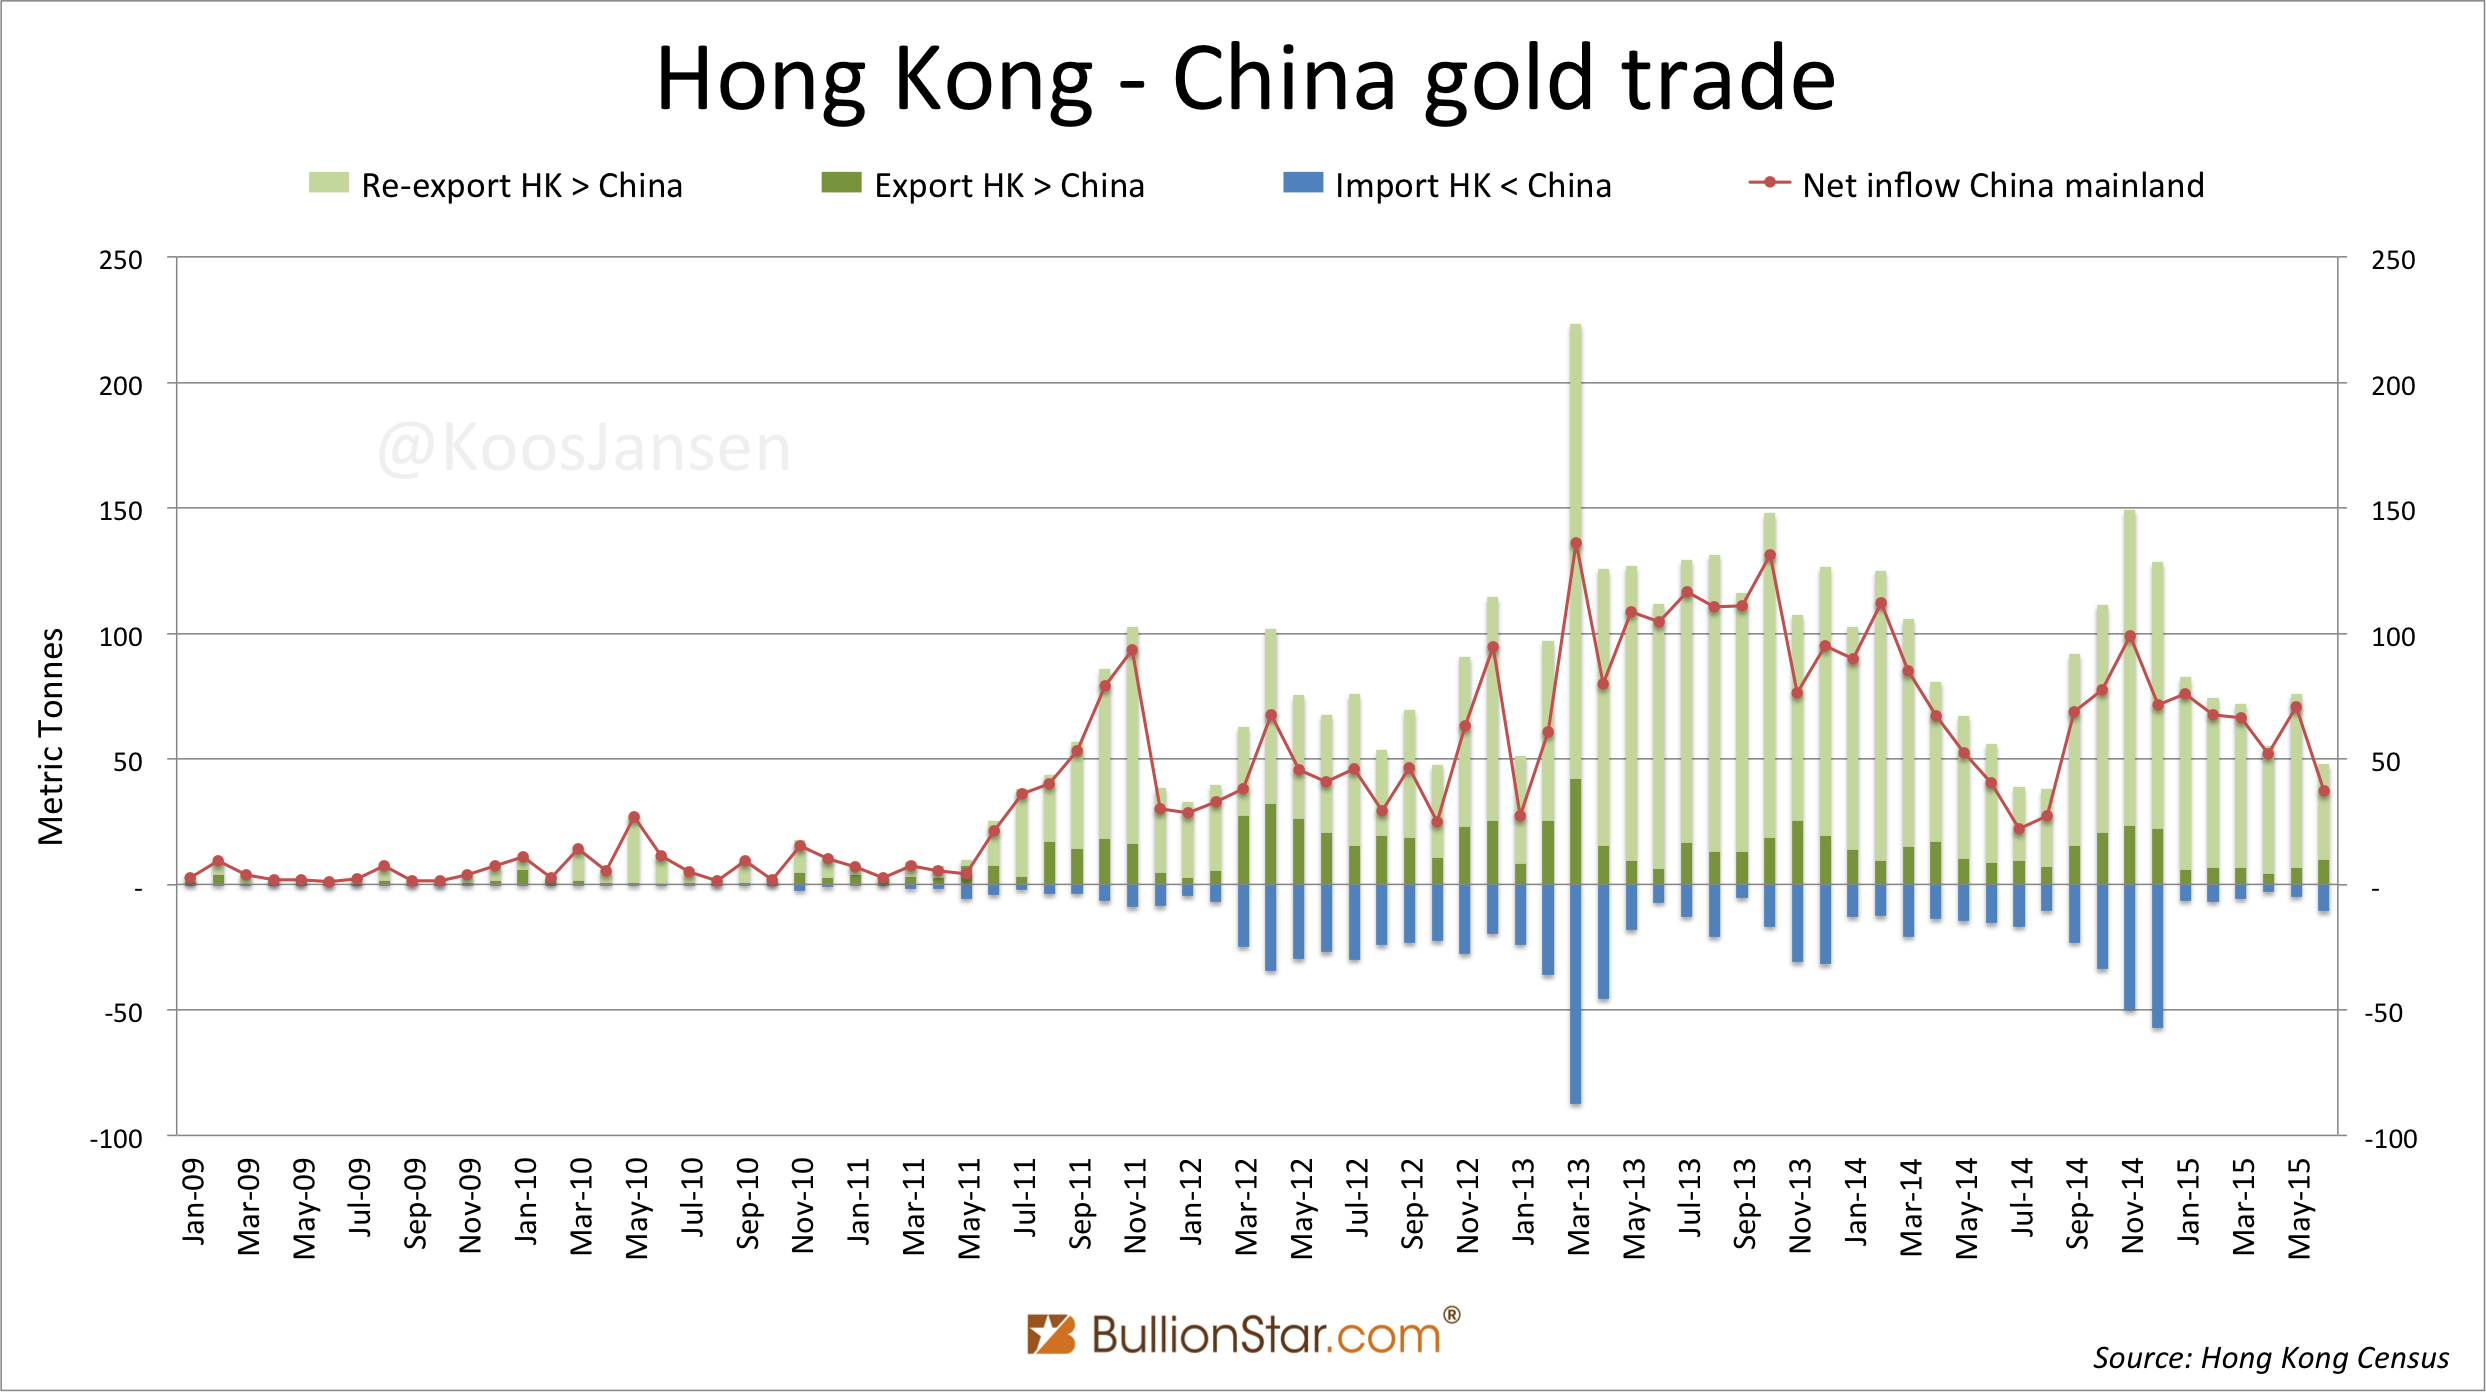
According to the local Census and Statistics Department Hong Kong net exported 370.3 tonnes of gold to China in H1.
H1 2015 Hong Kong net export to China: 370.3 tonnes.
Australia’s gold export to China is tricky to analyze. Strangely, Australia reports gold shipments as “being exported to China” even though it’s transferred via Hong Kong. Have a look at the chart below.
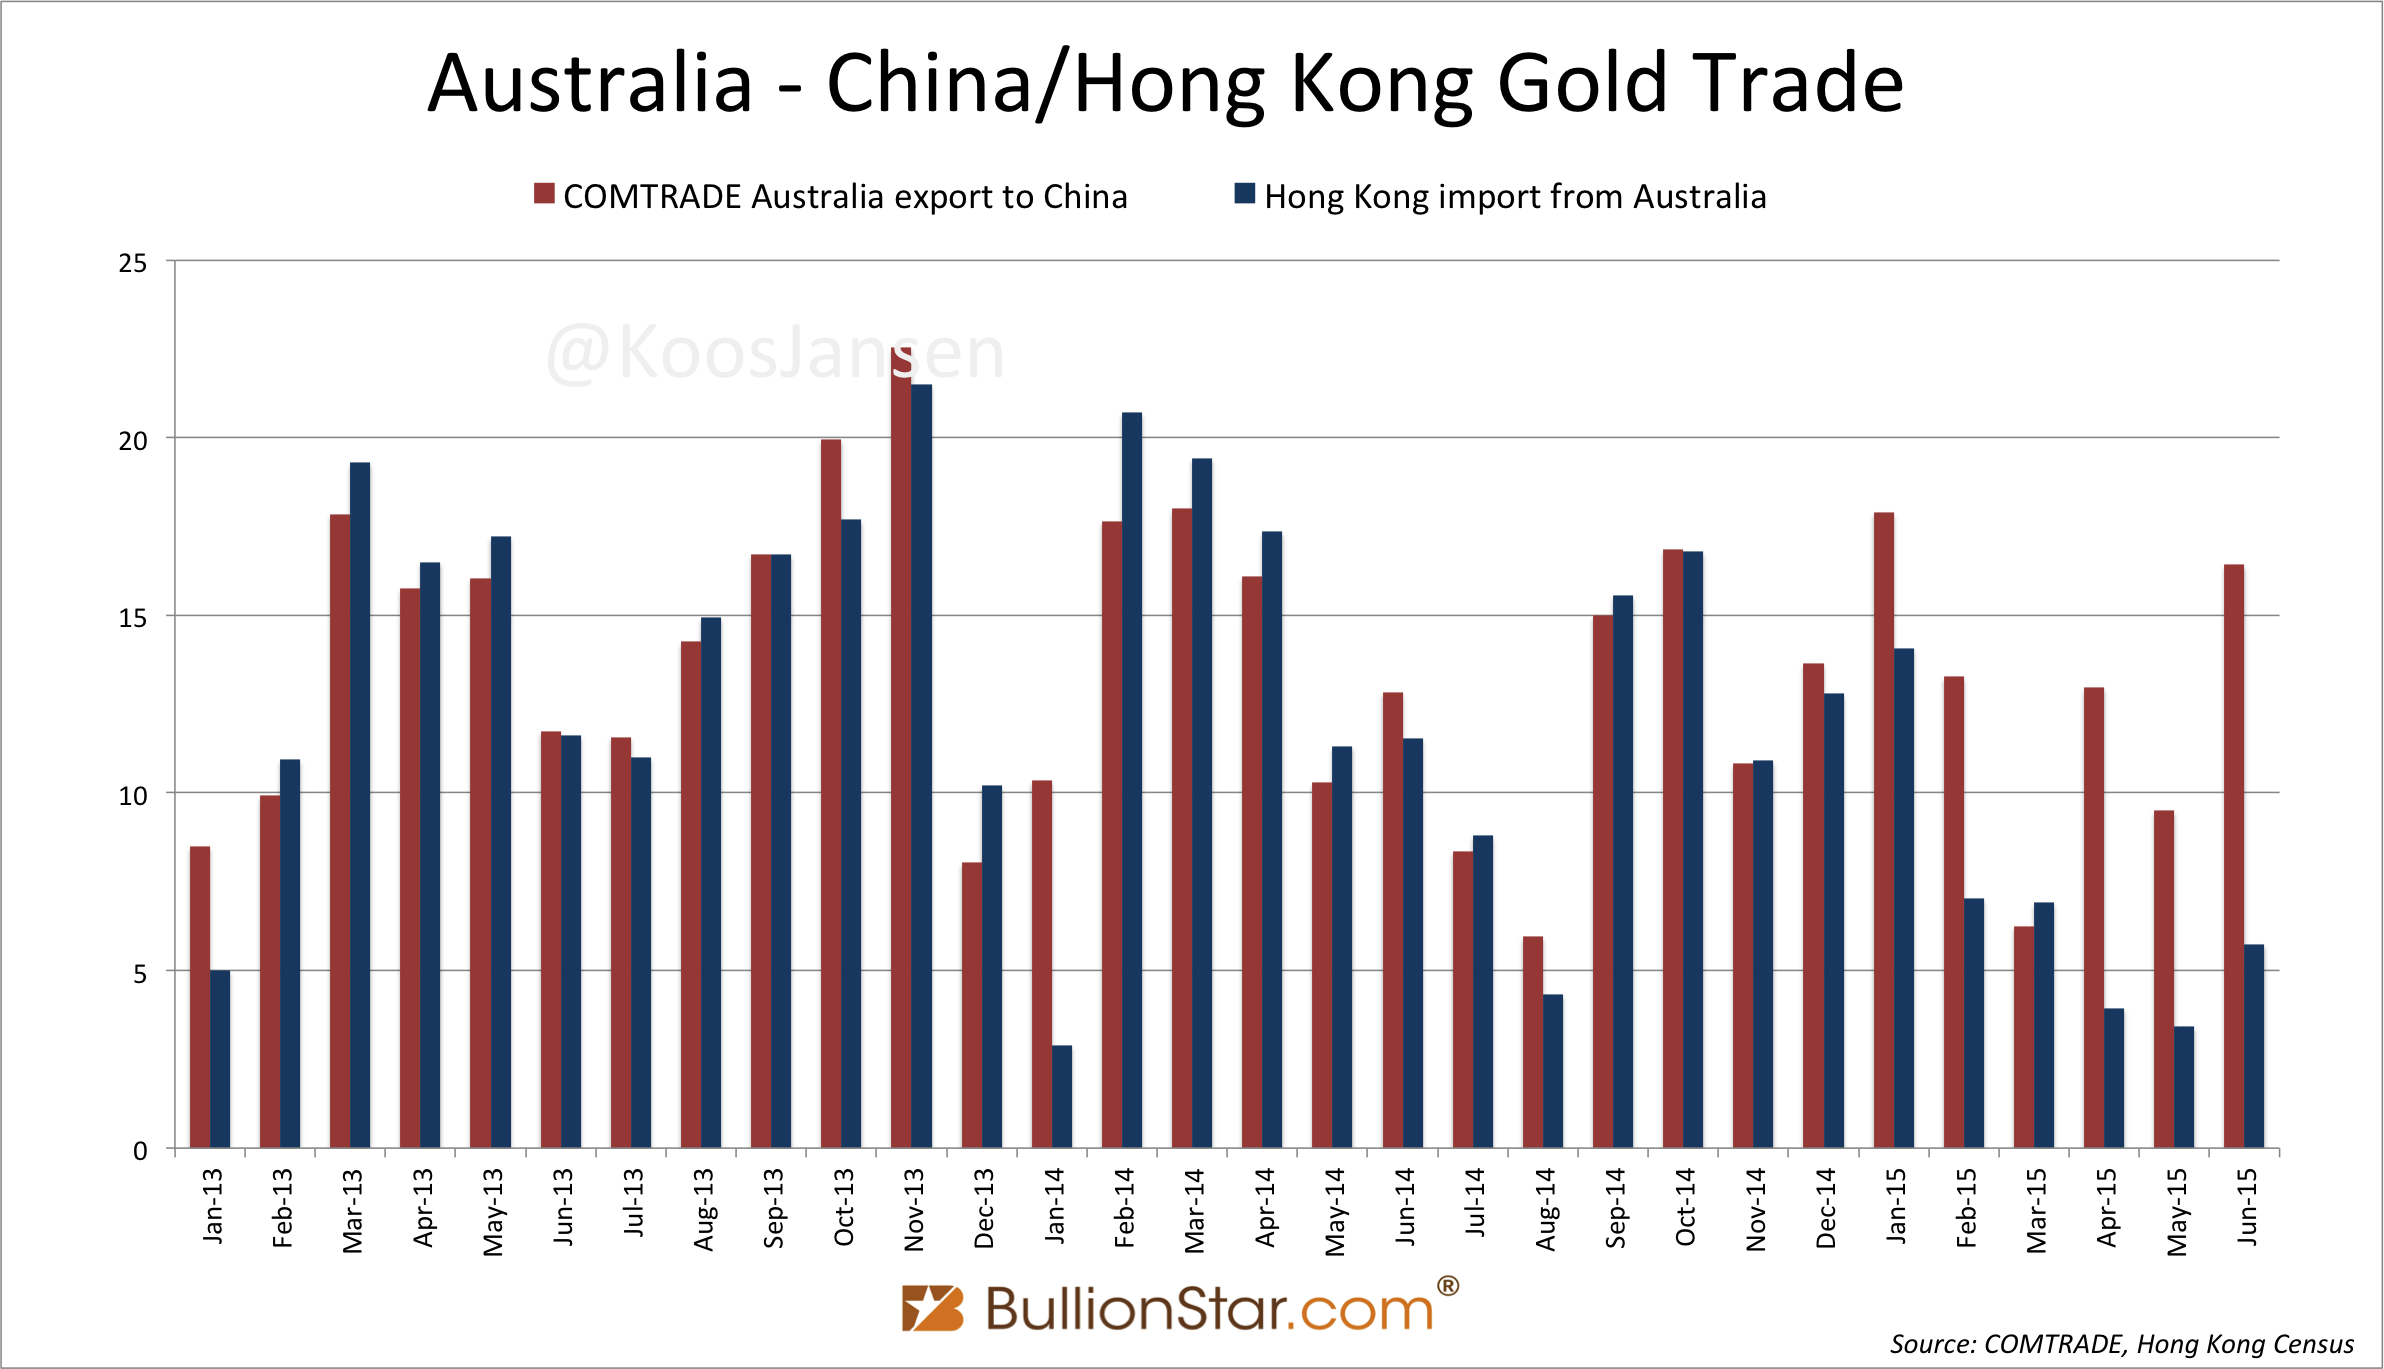
Australia also reports gold shipments as “being exported to Hong Kong”, but this is close to zero. Now, if we compare the “Australia gold export to China” from COMTRADE (red bars in the chart above) with “Hong Kong gold import from Australia” (blue bars in the chart above), these have been nearly equal until January 2015. Clearly, what Australia reported as “gold export to China” was first shipped to Hong Kong from where it was re-exported to China. Hong Kong has reported these imports from Australia also as an export to China, as we know that the gold Australia exported to Hong Kong was destined for China mainland. If, in order to compute China’s total gold import, we would add “Australia gold export to China” to “Hong Kong gold export to China”, this would result in double counting equal the volume of “Australia gold export to China”.
In the chart above we can see that since January 2015 “Australia gold export to China” starts transcending “Hong Kong gold import from Australia”. The red bars move up from the blue bars. From that point in time Australia started shipping bullion directly to the mainland, in addition to the Hong Kong route. By subtracting “Hong Kong gold import from Australia” from “Australia gold export to China”, what remains is what Australia directly exported to China, which is the figure we’re looking for.
H1 2015 “Hong Kong gold import from Australia” = 41 tonnes
H1 2015 “Australia’s gold export to China” = 76 tonnes
76 – 41 = 35 tonnes
H1 2015 Australia net export to China: 35 tonnes.
The remaining countries that transparently report gold trade with the mainland are Japan, having net exported 2.9 tonnes to China in H1 2015, and Canada, that exported 2.5 tonnes.
Let’s add up all proven net gold exports to China:
122.5 (UK) +
137.5 (Switzerland) +
1.6 (US) +
370.3 (Hong Kong) +
35 (Australia) +
2.5 (Canada) +
2.9 (Japan)
= 672.3 tonnes
H1 2015 proven Chinese net gold import: 672.3 tonnes.
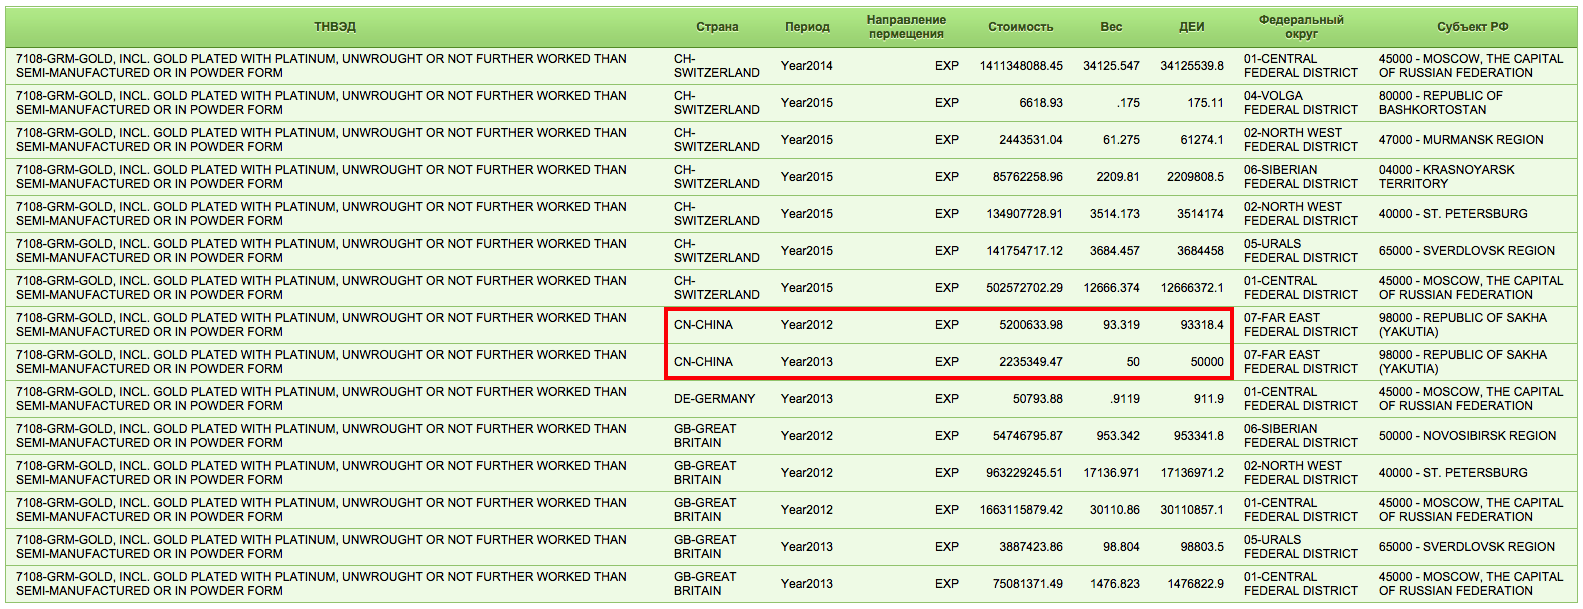
The Federal Customs Service of Russia states it has exported 93 kilograms of gold to China in 2012 and 2013, nothing more since then. Although I suspect this is not true, I can’t prove it yet.
Gold export numbers from South Africa, Singapore, Dubai, Ghana, Brazil, Mexico, Peru and Uzbekistan I have not yet obtained – or in some cases I have my reasons to doubt the accuracy of the data.
Connecting The Dots Between Chinese Gold Import, Chinese Domestic Gold Mining Output And SGE Withdrawals
Aside from the discussion on the metrics of Chinese gold demand, I will focus on the size of wholesale demand as measured by SGE withdrawals and how this relates to Chinese new gold supply. Out of interest how much physical gold China is accumulating, I like to track new gold supply consisting of net gold import plus domestic mining output – the gold added to China’s total reserves.
As the China Gold Association (CGA) has not yet updated Chinese domestic gold mining output up until June 2015, I have used an estimate of 239 tonnes for Chinese mining in H1 2015 (calculated as: half of China’s mining output 2014 increased by 5.6 %, which is by how much Chinese mining expanded in 2014 relative to 2013).
All together, in H1 2015 China has net imported 672.3 tonnes of gold and mined 239 tonnes, totaling 911.3 tonnes.
Let’s have a look at a chart to compare H1 2015 physical gold flows to previous years.
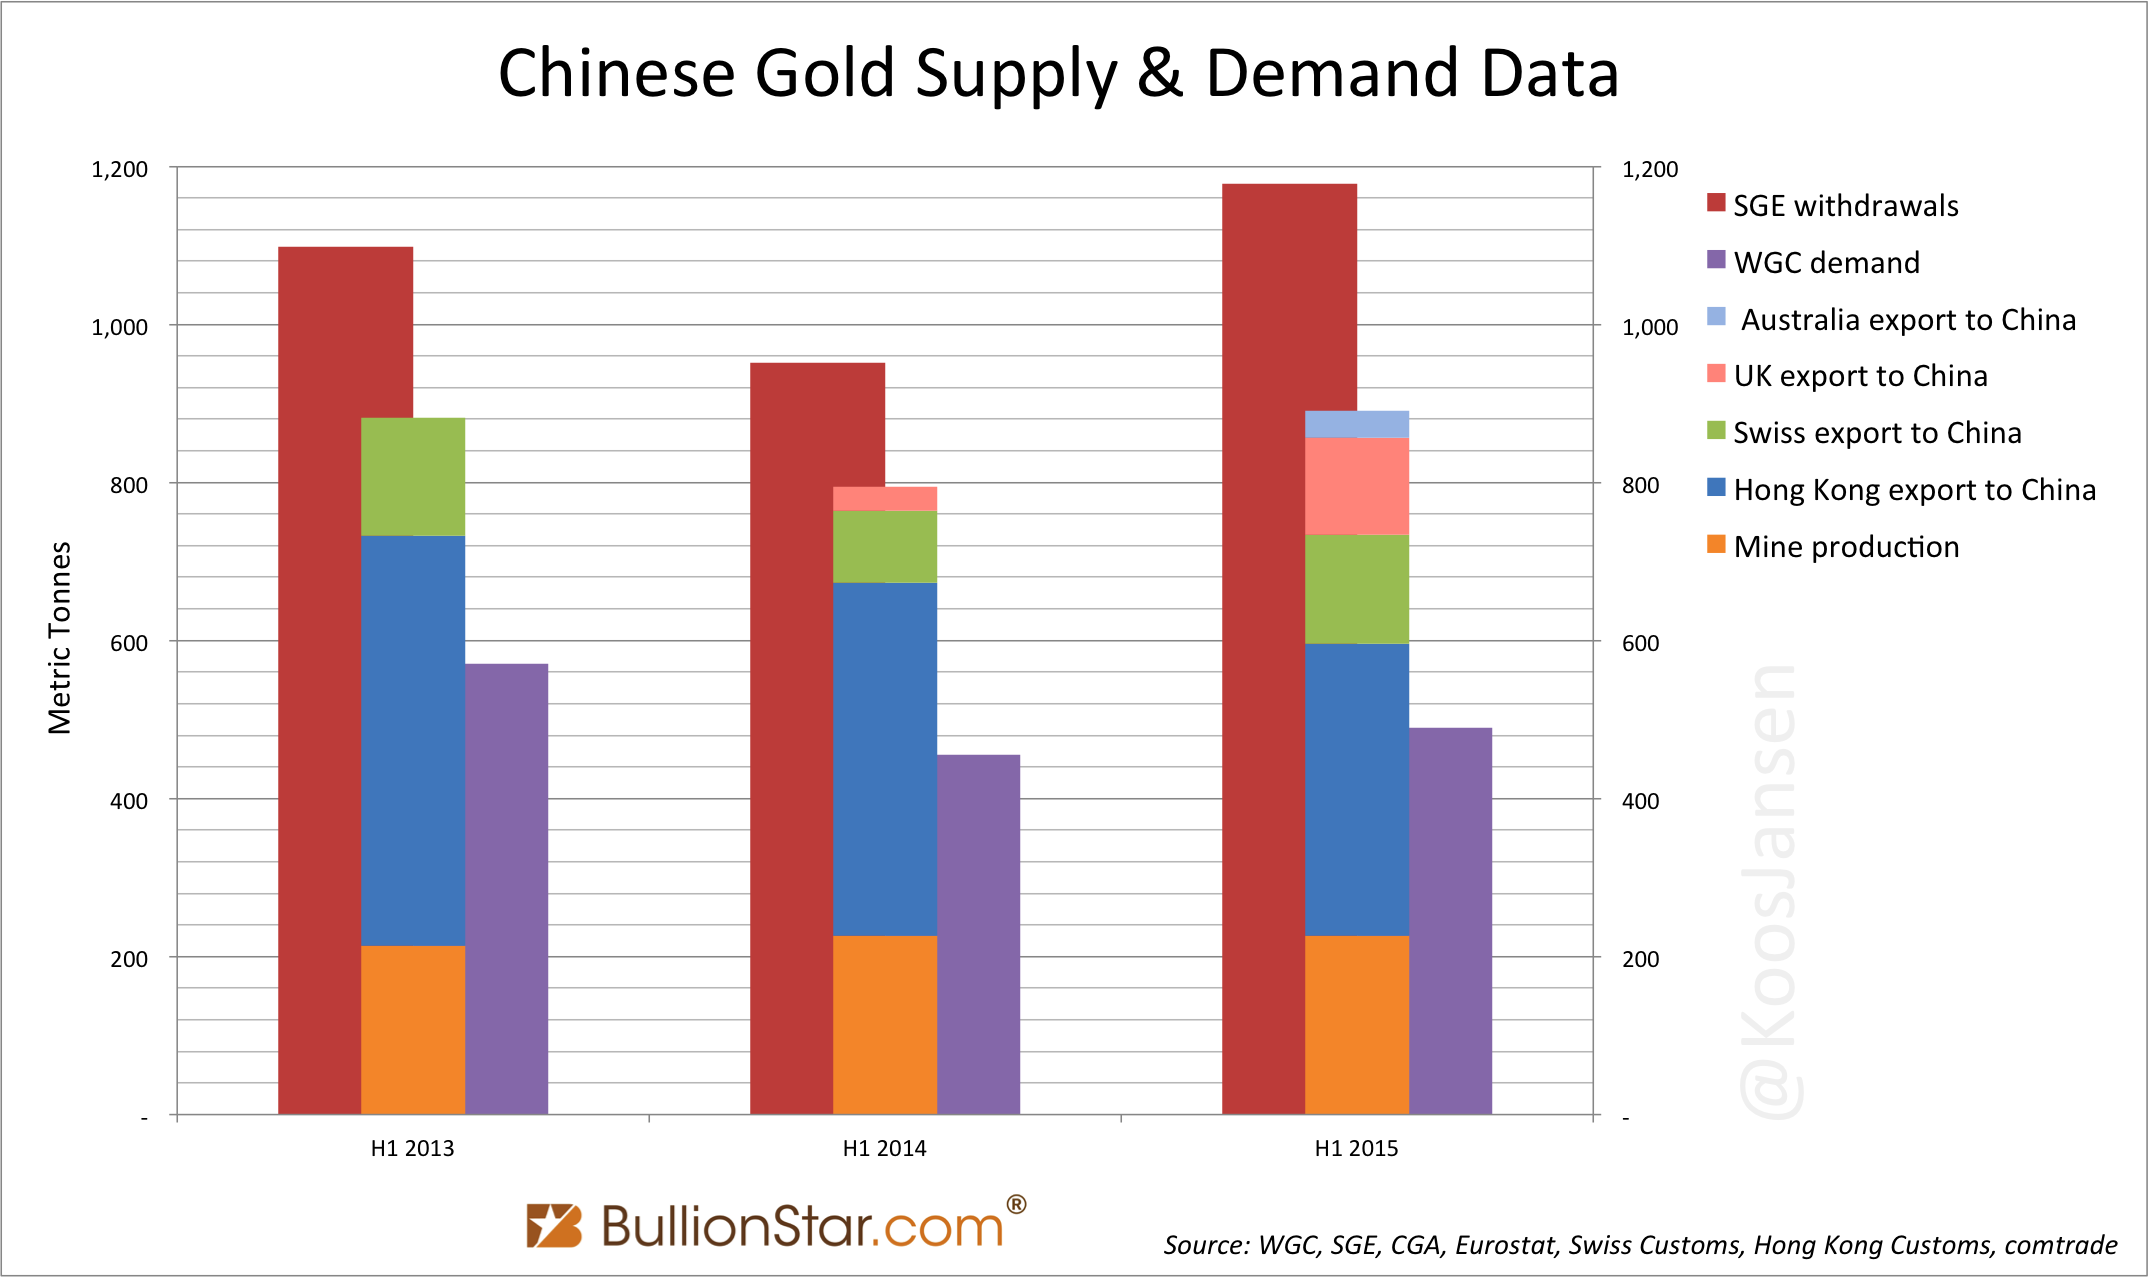
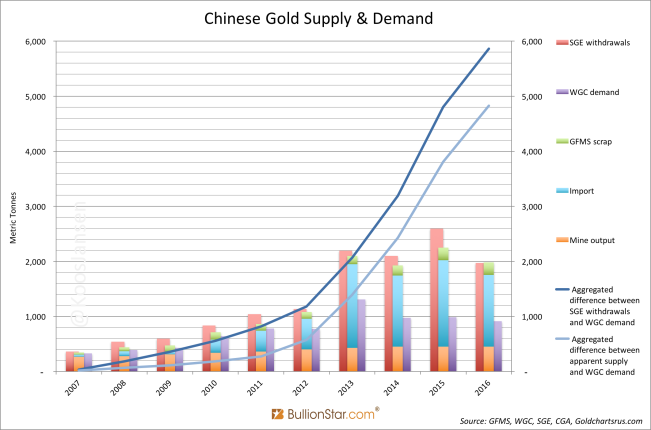
This year SGE withdrawals have been stronger than ever, having reached an astonishing 1,178 tonnes in H1 2015. However, the first thing we notice when eyeballing the chart above is the gap between estimated Chinese new gold supply (the center column in the chart) and SGE withdrawals. It is highly probable that recycled gold, whether that is gold-for-cash or gold-for-gold, supplying the SGE has increased this year (depending on how much China has imported from ie Singapore, South Africa and Russia). The gap previously cited accounts for 267 tonnes; this must have been supplied either by unknown imports or recycled gold. The ratio between both is impossible to reveal at this stage.
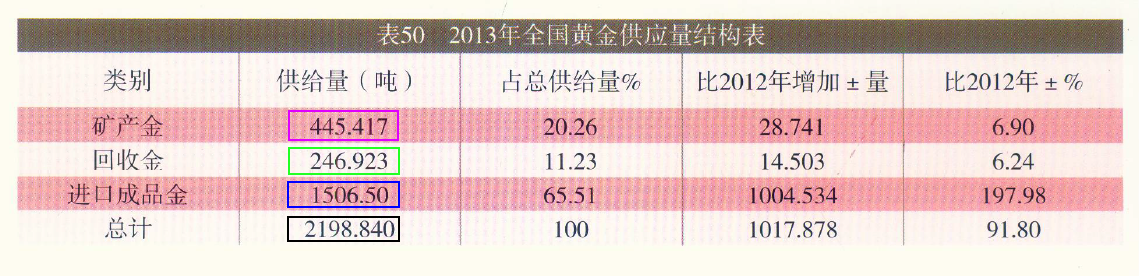
In the chart above we can see the gap was smaller in H1 2013 than in H1 2015. Though the gap can be deceiving. We know for a fact China has not only imported gold from Hong Kong and Switzerland in 2013. Net export from Hong Kong to China in 2013 plus net export from Switzerland to China in 2013, adds up to 1,403 tonnes. Whilst, the CGA has reported Chinese total net gold import in 2013 accounted for 1,506.5 tonnes. Therefor, China must have imported 103.5 tonnes of gold in 2013 from countries whose trade statistics I haven’t included in this post. The usual suspects are Singapore, South Africa and Russia, perhaps also Ghana. We can safely conclude that because China has imported gold from the usual suspects in 2013, it can also have imported gold from these countries in 2015.
Important to note, Chinese new gold supply in H1 2015 (domestic mine output plus import from Hong Kong, Switzerland, the UK and Australia: 911.3 tonnes) was higher than new gold supply in H1 2014 (domestic mine output plus import from Hong Kong, Switzerland and the UK: 795 tonnes) and higher than new gold supply in H1 2013 (domestic mine output plus import from Hong Kong and Switzerland: 861 tonnes).
My conclusion is, although SGE withdrawals are (seemingly) less correlated to Chinese gold import in 2015, caused by more recycled gold supply flowing through the SGE, estimated Chinese gold import in the first six months of 2015 was higher relative to the same periods in the years before. Annualized Chinese gold import 2015 is 1,345 tonnes.
Demand figures from the World Gold Council on China’s gold hunger are still dwarfed by the amounts of physical gold that are very clearly supplied to China mainland.
That’s all I have for now.
Popular Blog Posts by Koos Jansen
 China’s Secret Gold Supplier is Singapore
 Audits of U.S. Monetary Gold Severely Lack Credibility
 China Gold Import Jan-Sep 797t. Who’s Supplying?
 The Gold-Backed-Oil-Yuan Futures Contract Myth
 Estimated Chinese Gold Reserves Surpass 20,000t
 PBOC Gold Purchases: Separating Facts from Speculation
 U.S. Mint Releases New Fort Knox Audit Documentation
 China Net Imported 1,300t of Gold in 2016
 Why SGE Withdrawals Equal Chinese Gold Demand and Why Not