
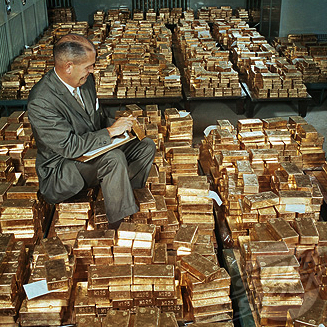
China Continues To Drain Global Gold Inventory

 Koos Jansen
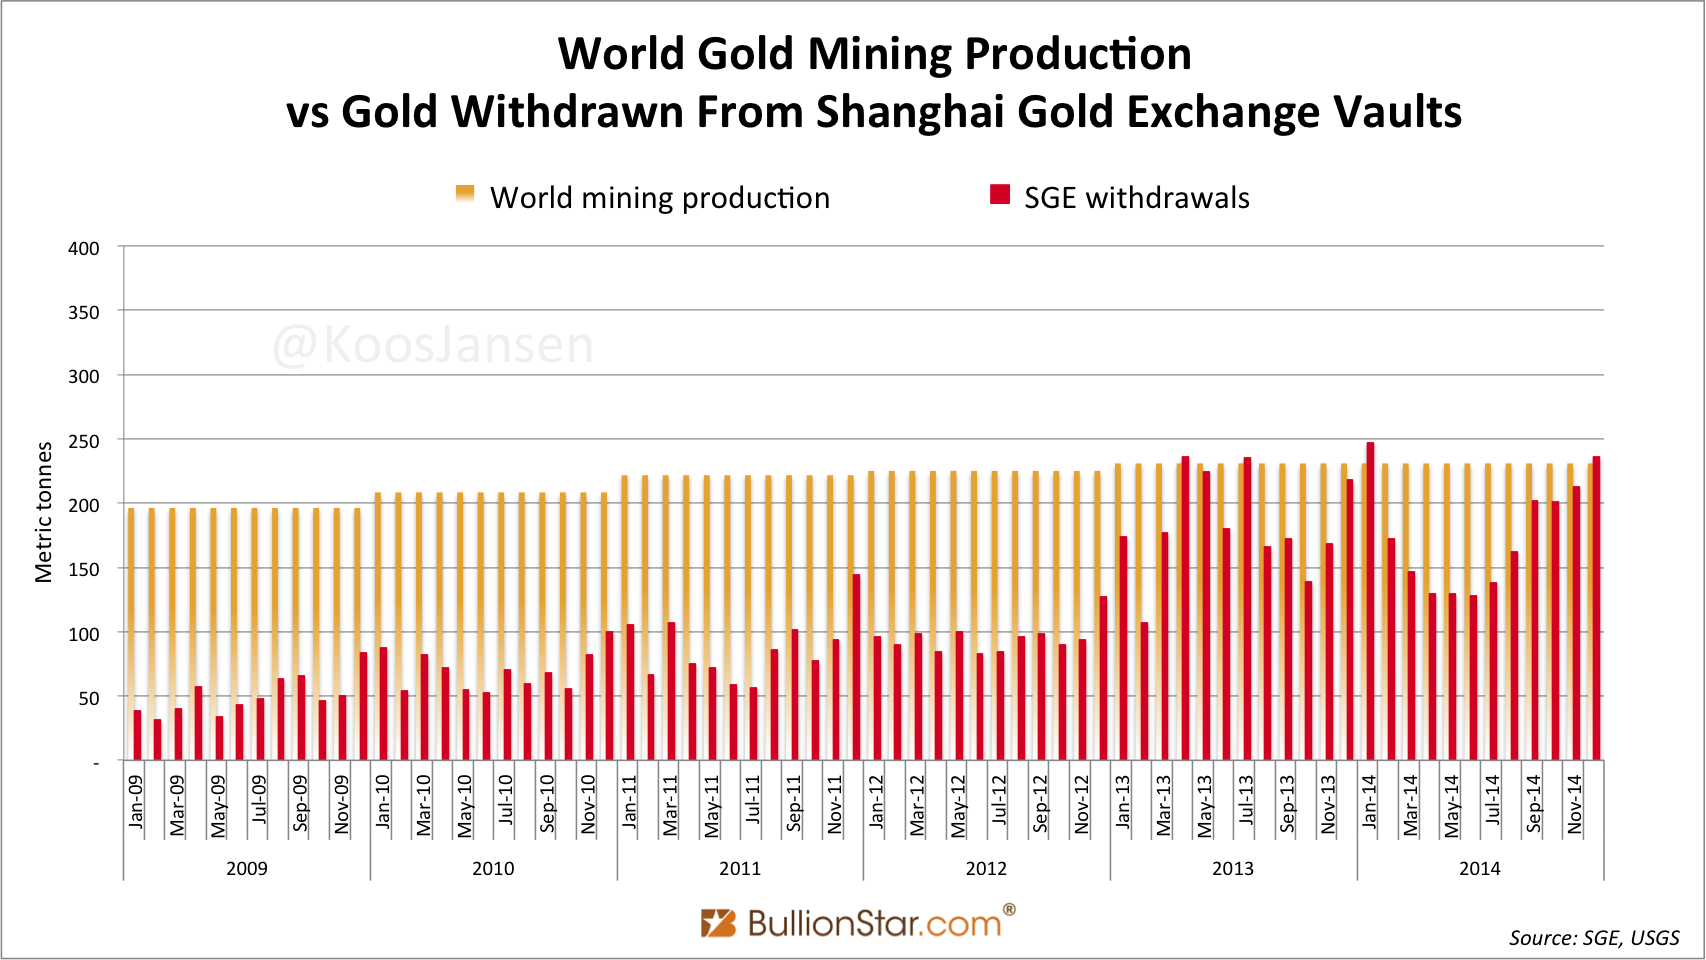
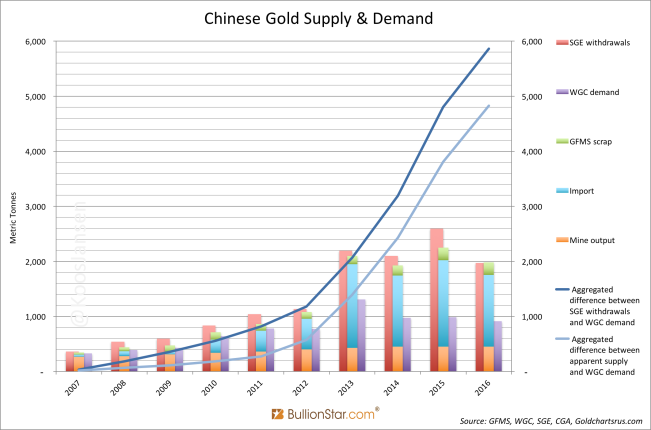
Withdrawals from the Shanghai Gold Exchange (SGE), the best indicator for Chinese wholesale demand, have been strong in 2014. In total 2,102 tonnes was loaded out from the SGE vaults. Mid 2014 withdrawals were relatively low, then they ramped up in September.
In this post we’ll examine where this gold was sourced from.
At this moment we don’t know exactly what the composition was of the supply side of SGE withdrawals in 2014 – scrap, mine or import, though SGE chairman Xu Luode gave us a hint at the ninth China Gold & Precious Metals Summit that took place in early December:
As regards the concerns over the Chinese gold demand, chairman of the Shanghai Gold Exchange Xu Luode told the conference that the gold market in 2014 is still a CHINA YEAR. …China has imported over 1,100 tonnes of gold by November this year and the whole year’s bullion import is estimated to reach 1,200 – 1,300 tonnes, a number only next to the year of 2013.
As I have demonstrated before the main feeder for China’s gold hunger is the London Bullion Market (the UK), though in 2013 this was more so than in 2014. Let’s go through the most recent customs data published by the largest suppliers to China mainland: the UK, Switzerland, Hong Kong, Australia and the US.
The UK
The great gold exodus from West to East started early 2013; 12.5 Kg London Good Delivery bars (995 purity) from the UK are shipped to Switzerland, where it’s refined into 1 Kg (9999 purity) bars and send forward to the East. The big change since 2014 is that more gold is being send directly to China instead of going via Switzerland and Hong Kong, partially because China has increased its refining capacity.
In total the UK net exported 173 tonnes in November, up 282 % m/m; the biggest outflow since July 2013. Net export to Switzerland also saw a huge spike in November, 118 tonnes, up 179 % m/m, the largest tonnage in 9 months.
In the next chart I have added SGE withdrawals to UK gold trade – since January 2013 we can see a correlation between net export from London and withdrawals in China.
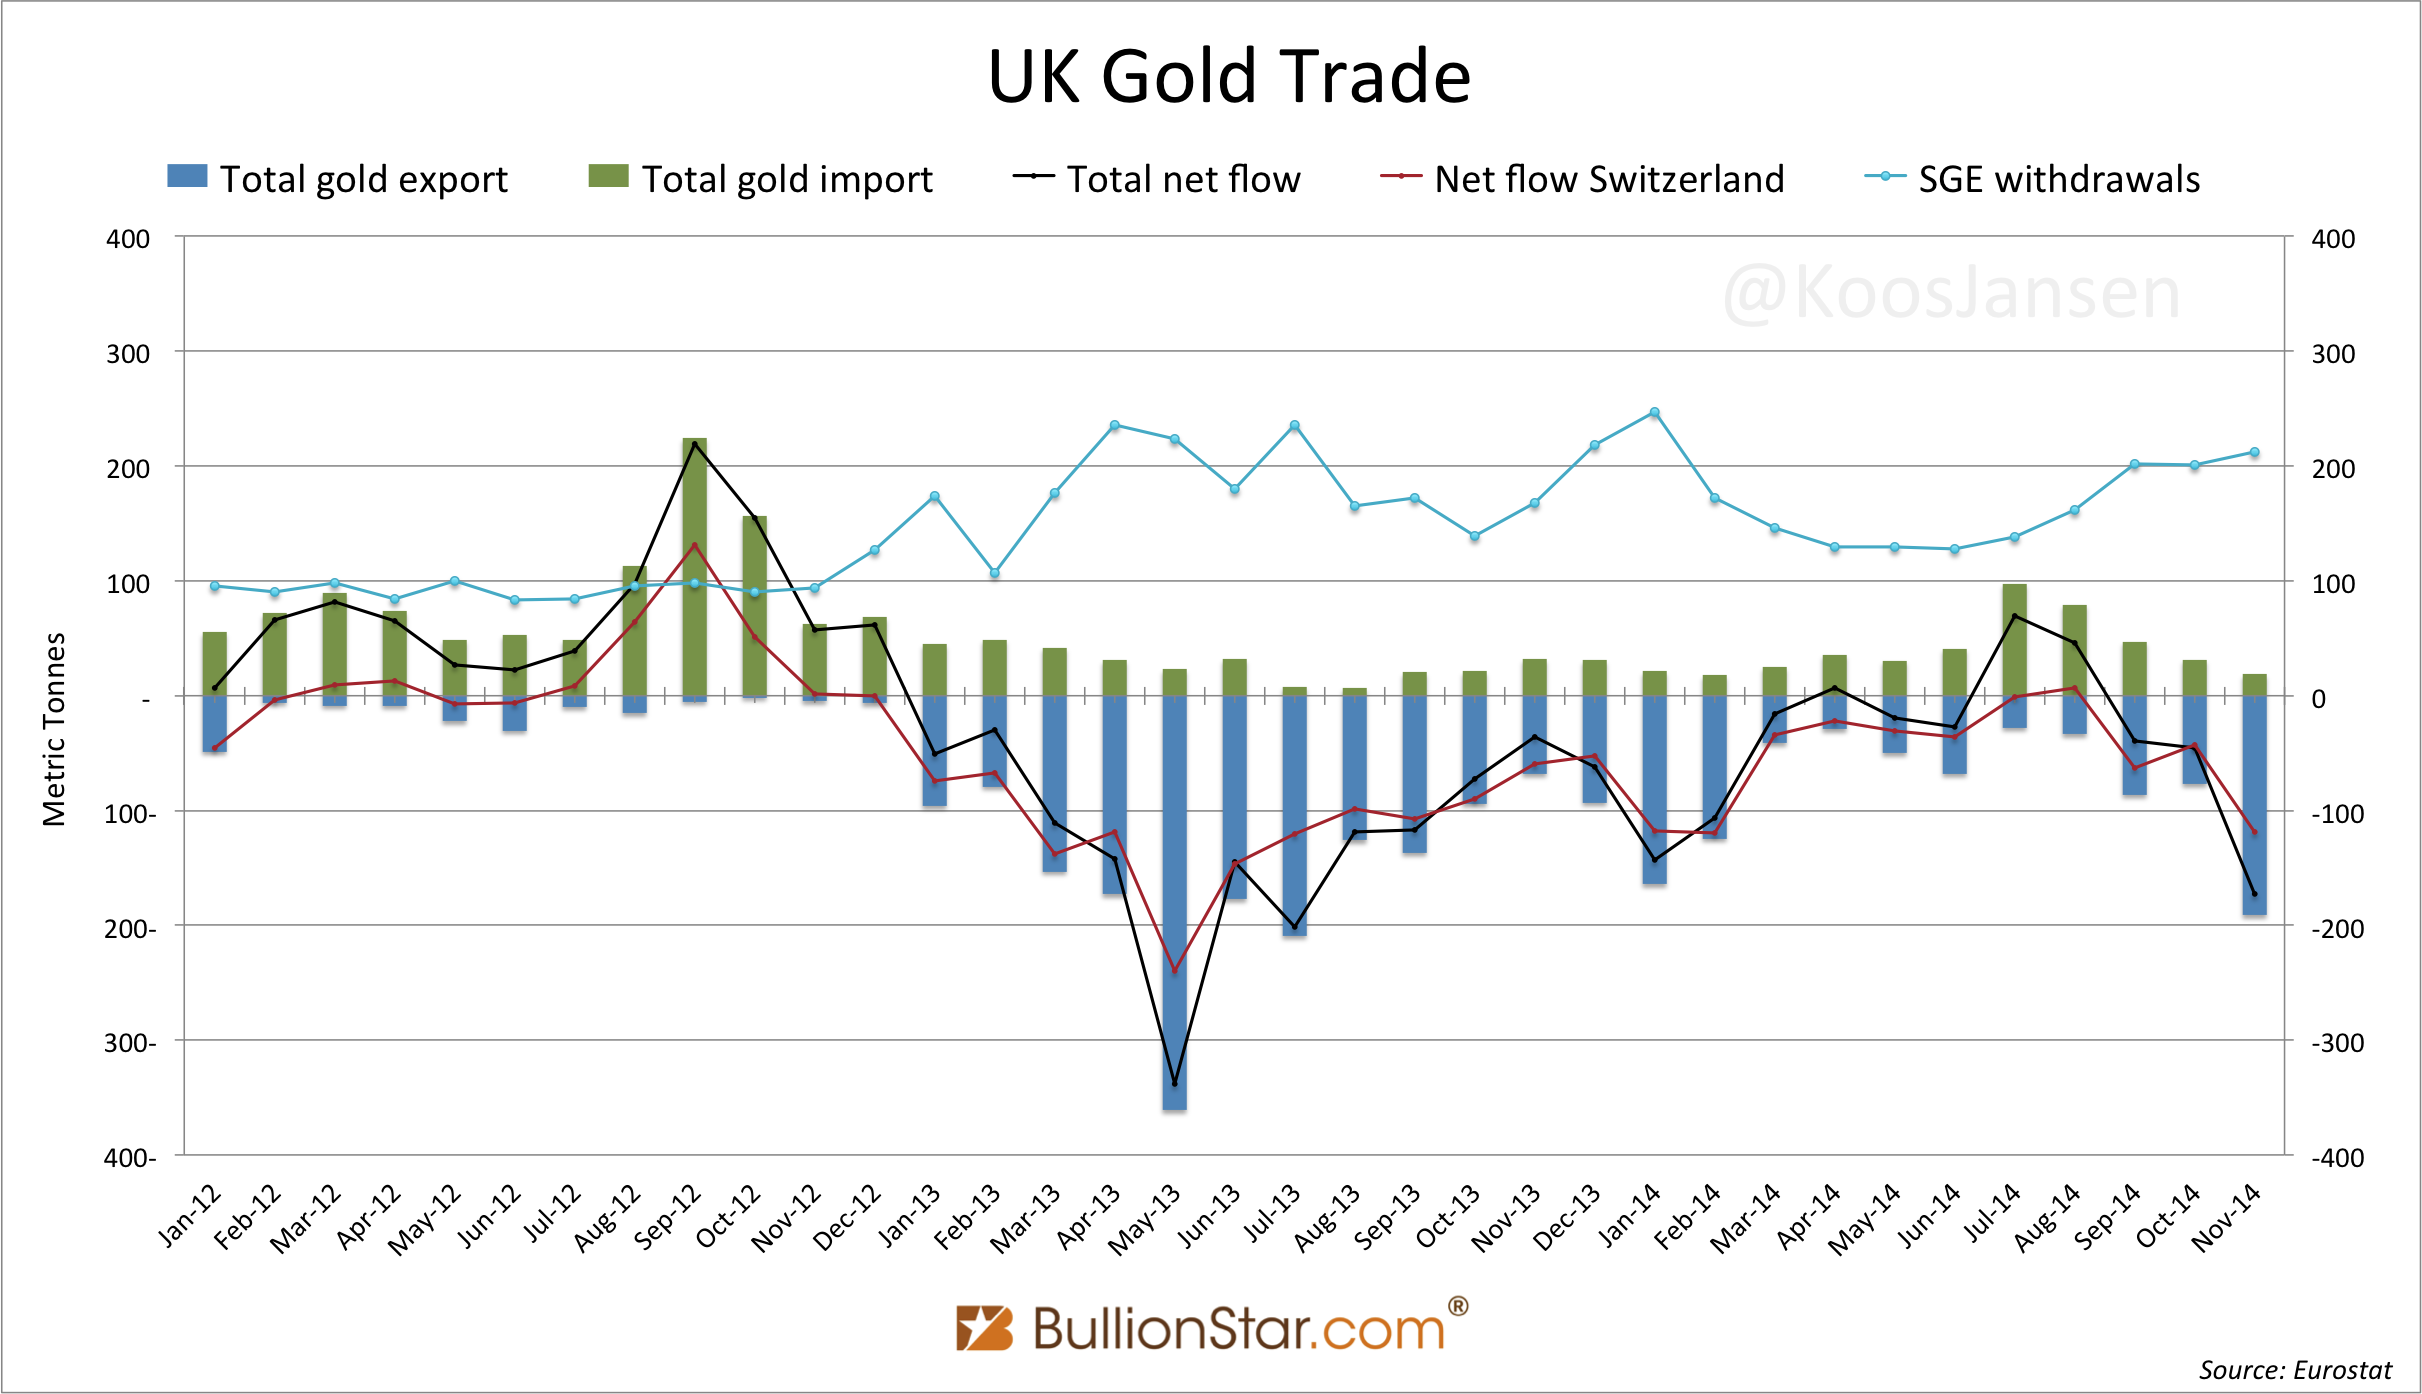
January – November total UK net gold export stands at 447 tonnes, net gold export over this period to Switzerland was for 579 tonnes.
In November UK gold export to China was 30 tonnes, up 186 % m/m, an all time record. Aggregated net gold export (January – November) heading for the mainland was 105 tonnes.

For all UK trade data I have used the tonnage disclosed by Eurostat.
Switzerland
The Swiss imported 1,597 fine tonnes in the first eleven months of 2014; export was 1,616 tonnes over this period.
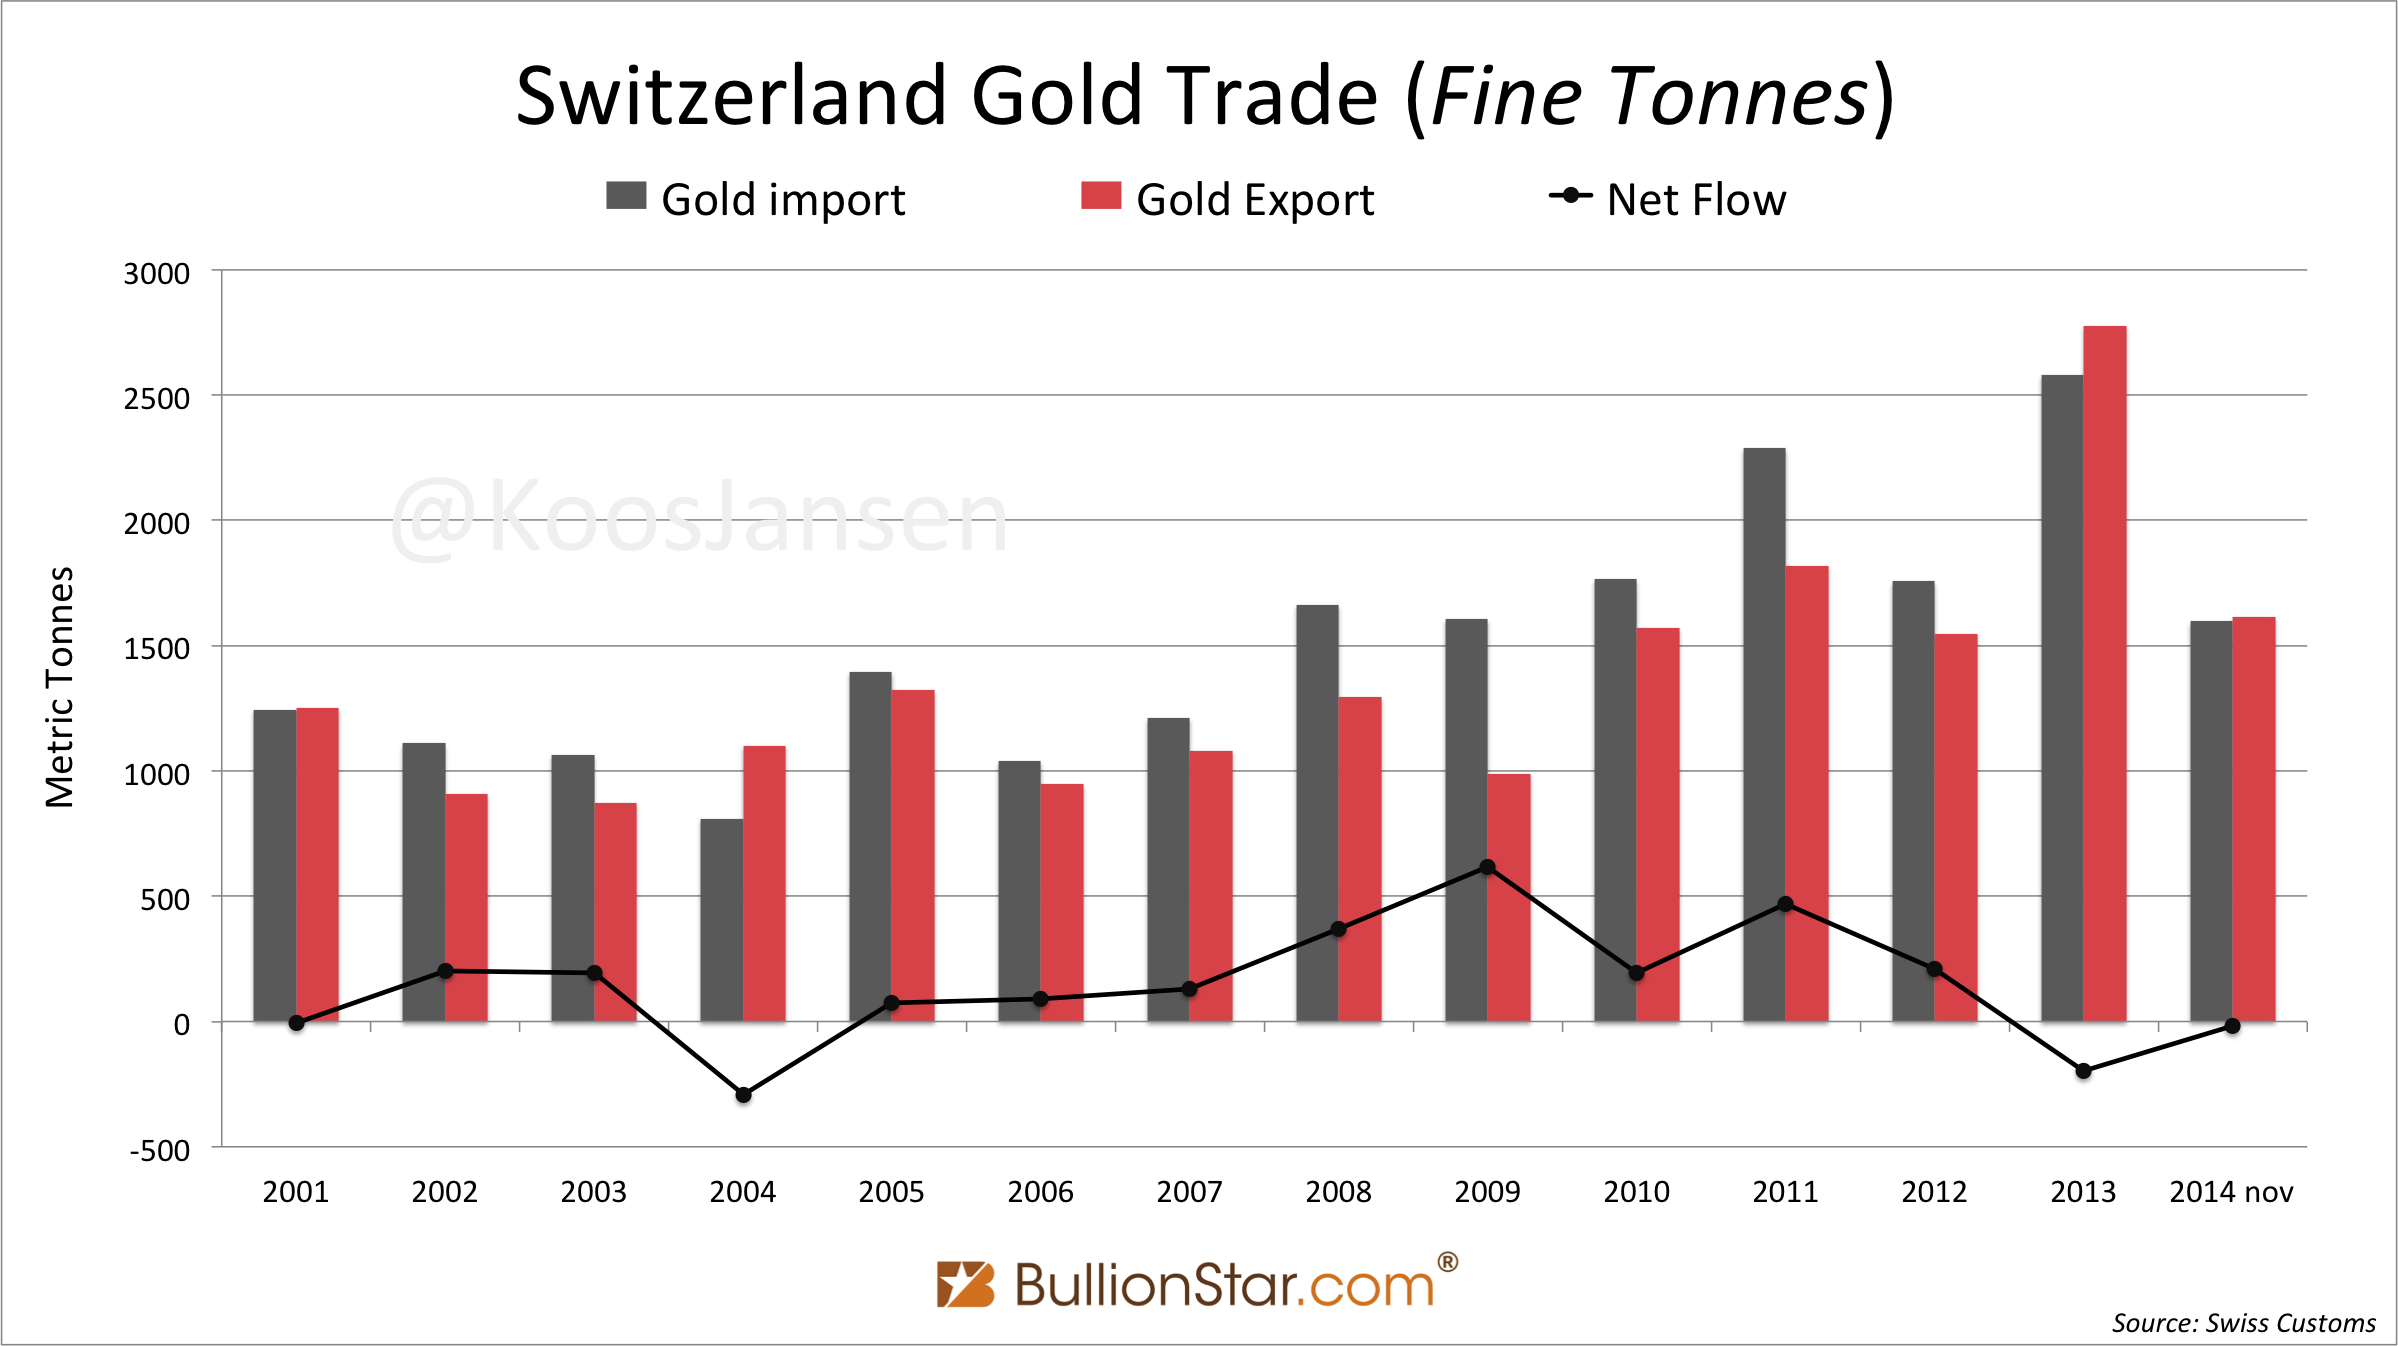
I would like to emphasize fine tonnes in the chart above. Thanks to a commenter on this blog (named sb) I have calculated the fine content of Swiss gold trade. One of Switzerland’s core businesses is refining gold; this means the import tonnage disclosed by Swiss customs is of a significant lower purity than the exported tonnage. A good example is 2014:
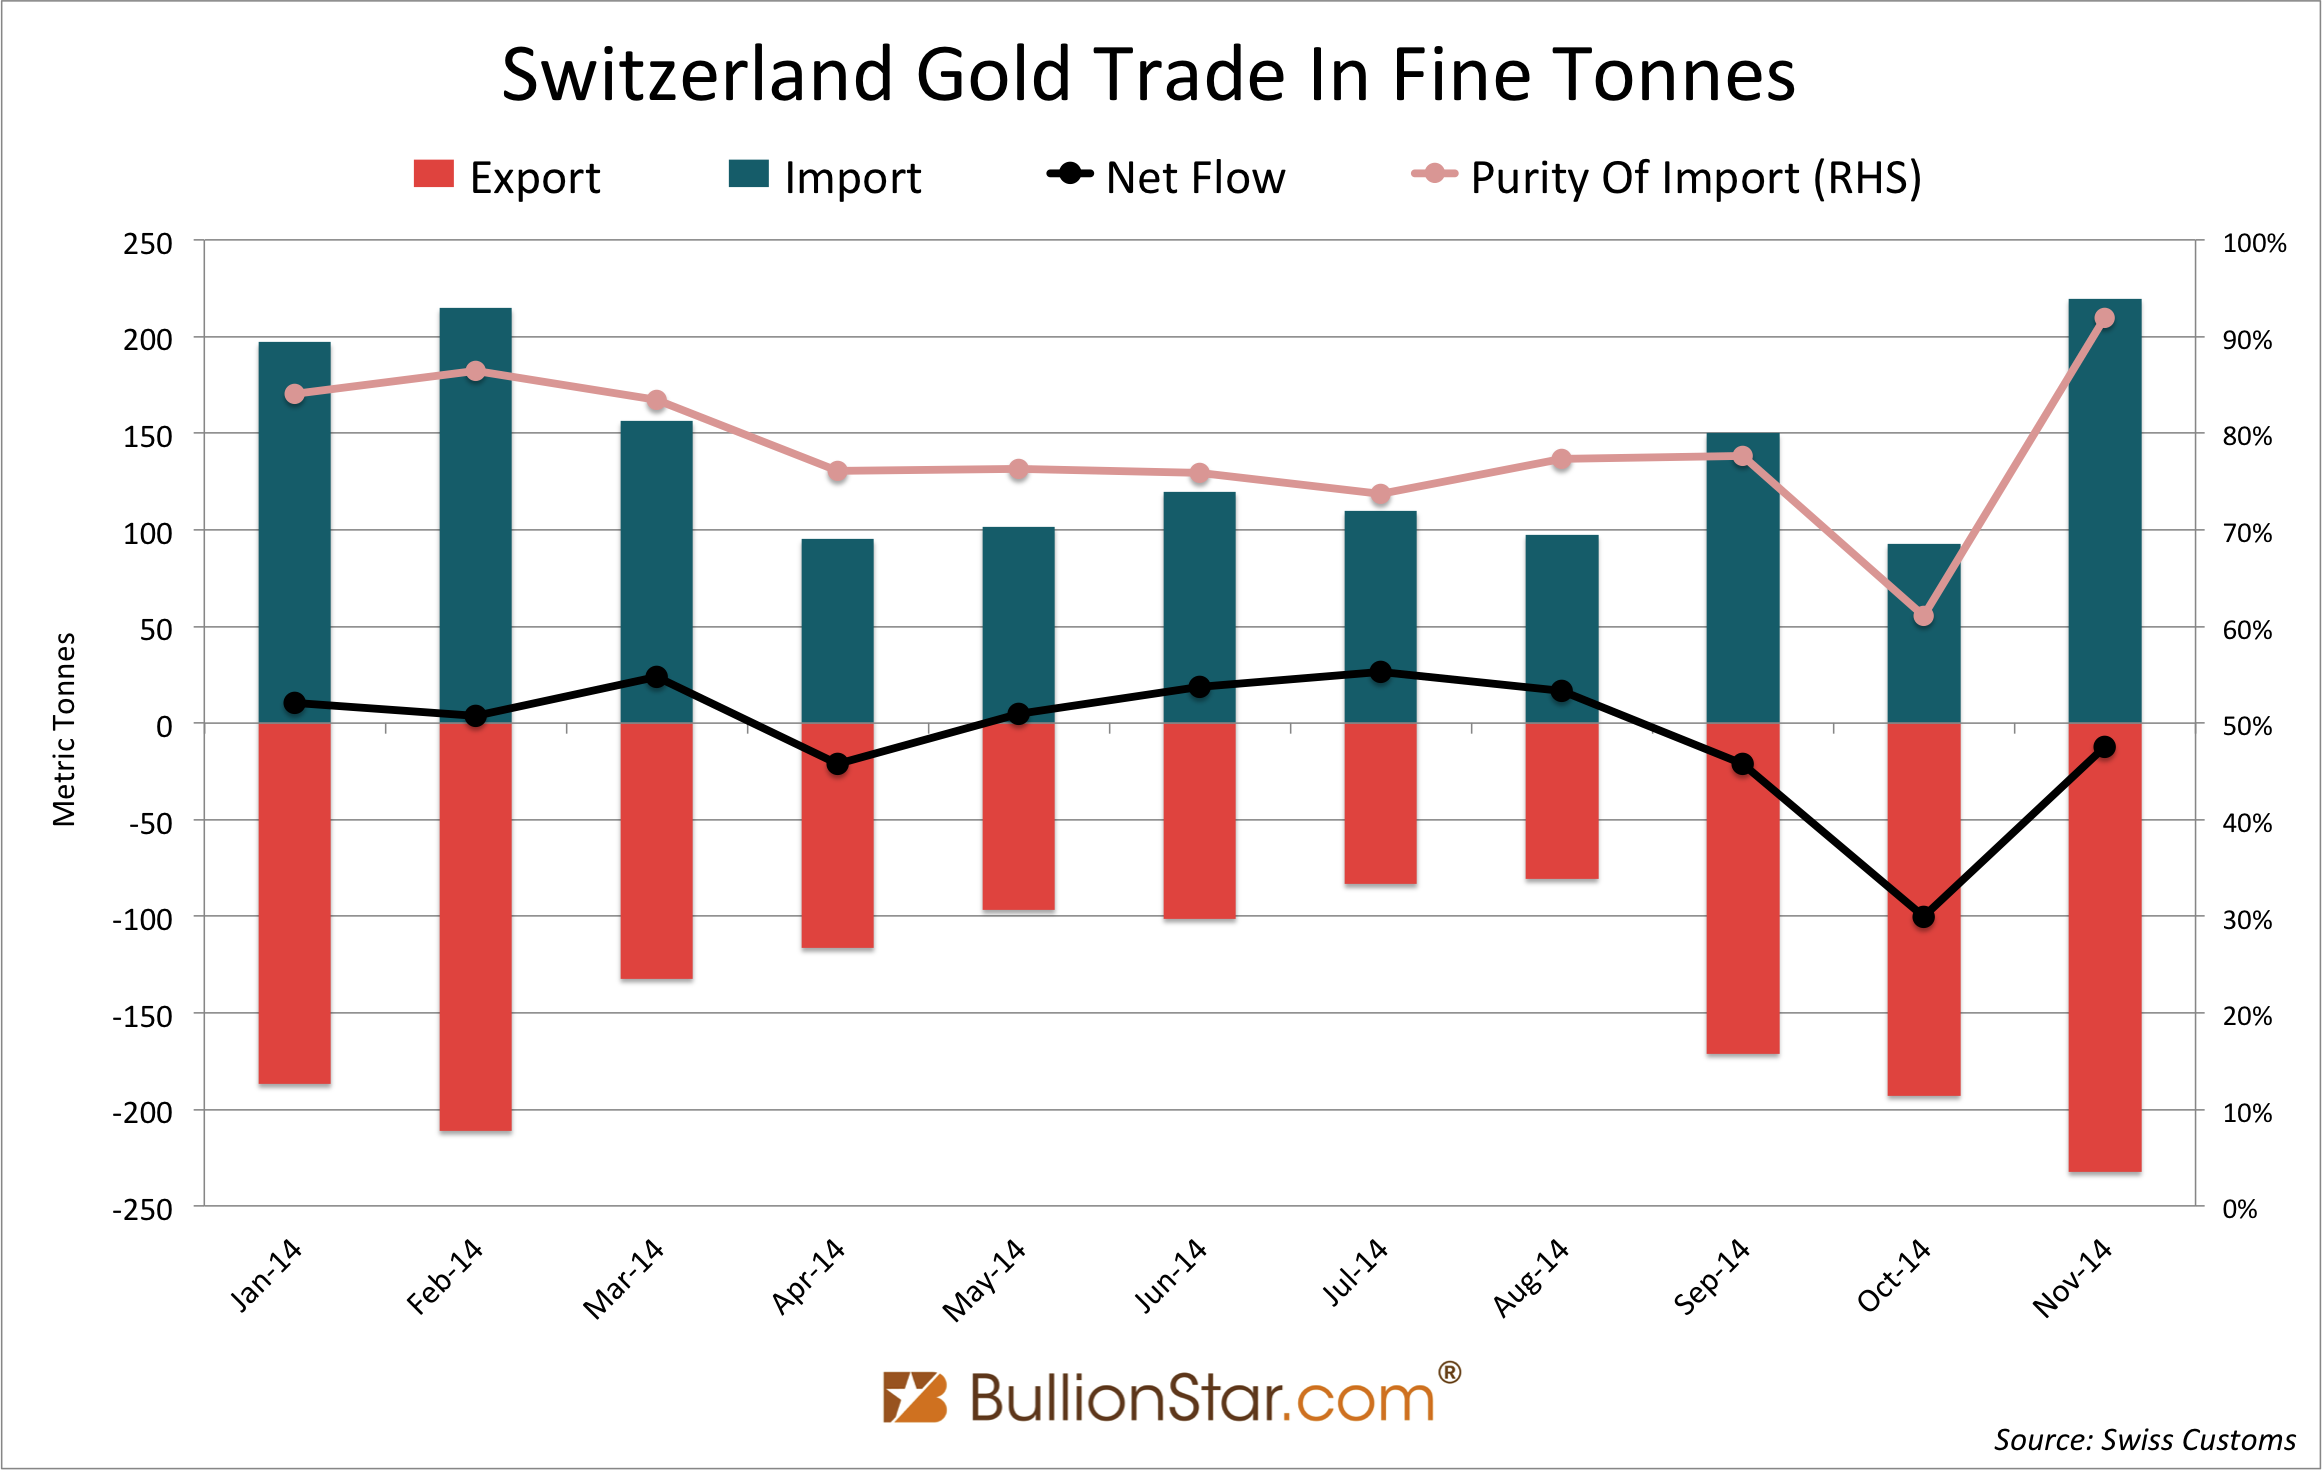
First the data: in November import was 219 tonnes, up 137 % m/m, a record for 2014; export was 232 tonnes, up 20 % m/m, a record for 2014 as well. Net outflow was 12.5 tonnes.
We can see the more Switzerland is importing the higher the purity of the imported gold. Here is why; there is a certain amount global mines can produce as doré every month (low purity), when demand exceeds this amount the Swiss need to import bullion bars, which makes the overall purity of import rise. The last chart clearly illustrates that the more gold is passing through, the more is drained from global bullion bar inventory.
The top destinations of Swiss gold are India, Hong Kong, Singapore and China mainland.
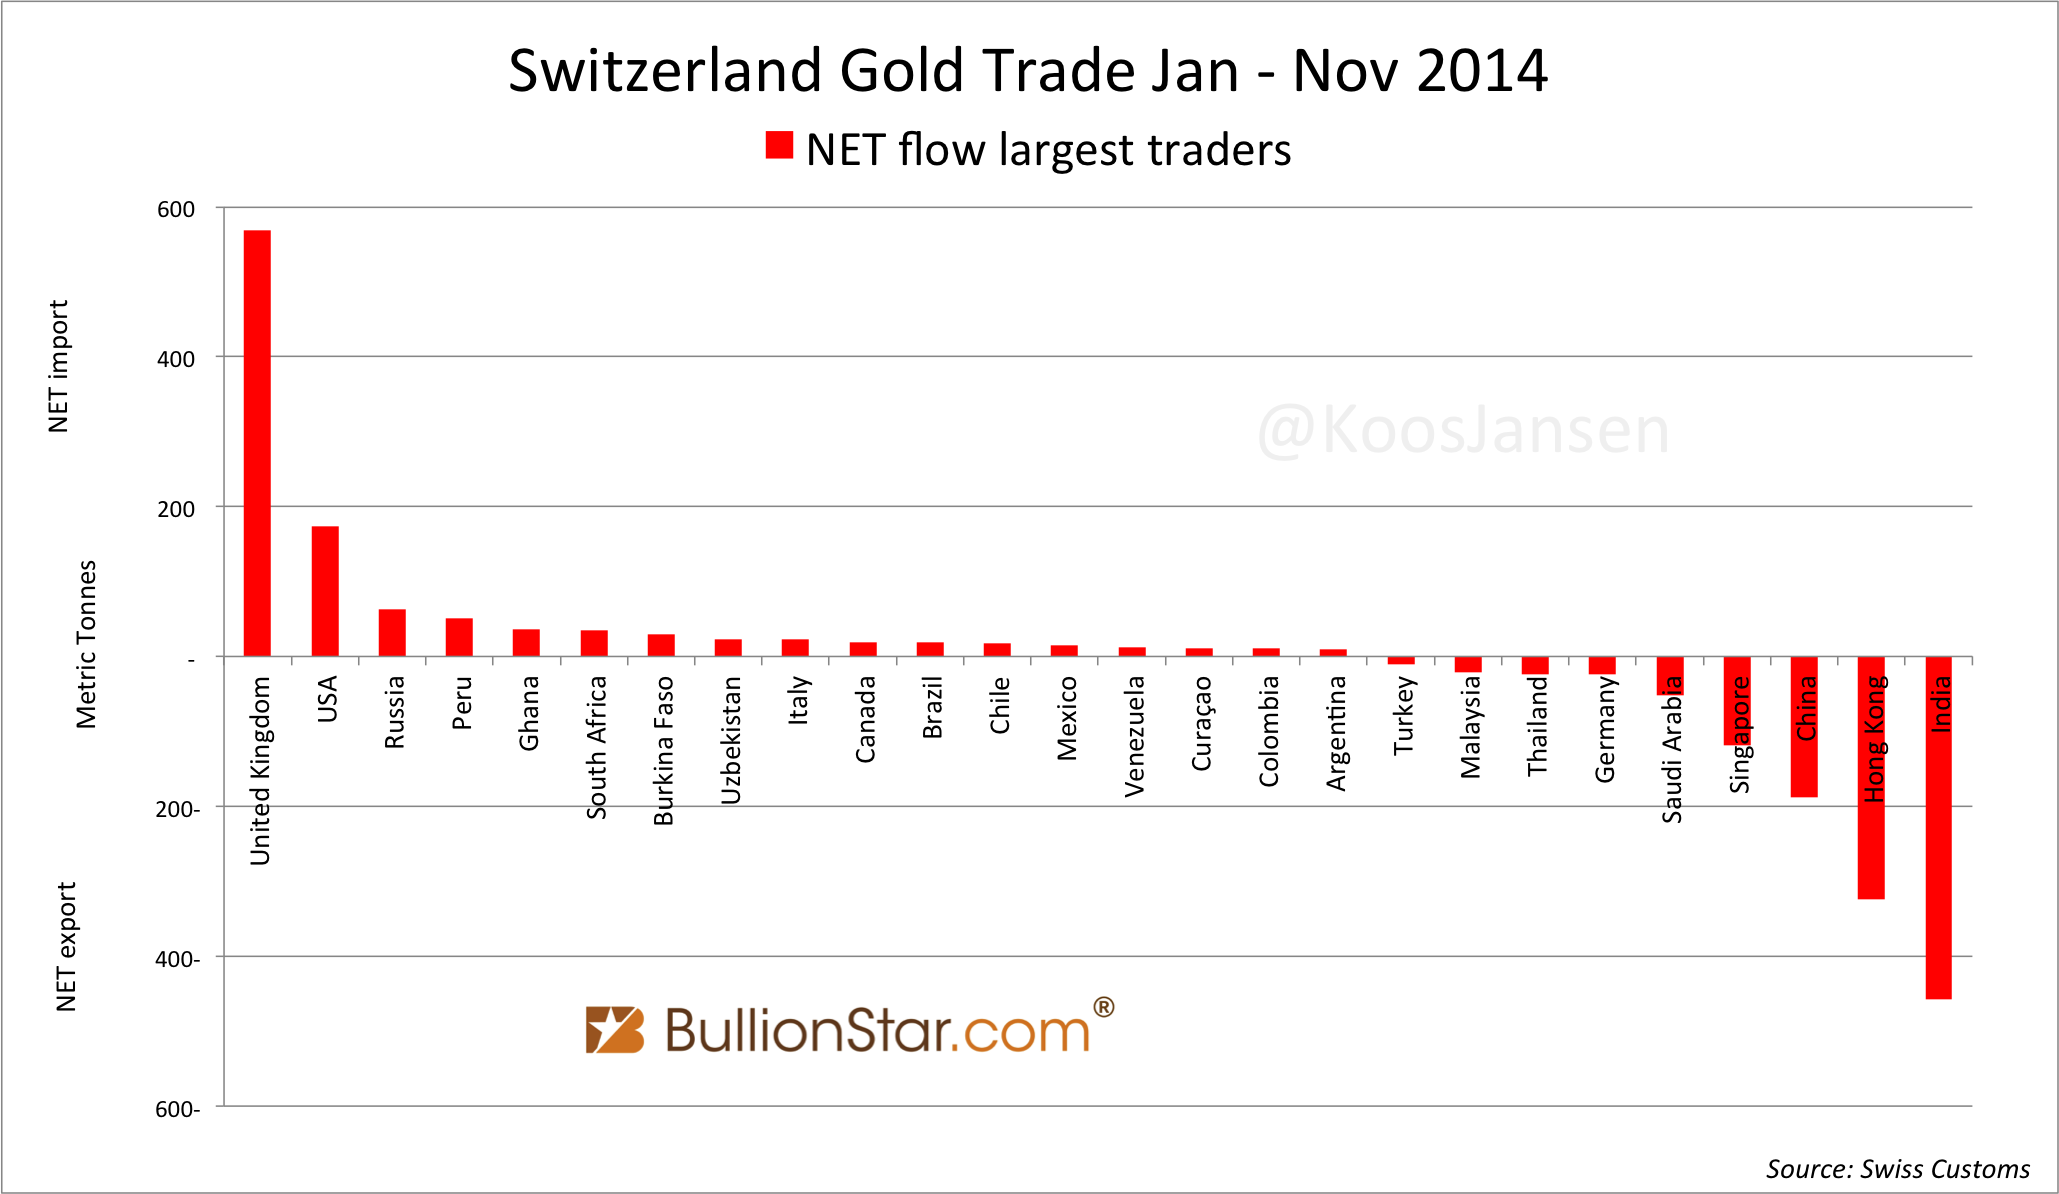
Export to China matches, again, the trend of SGE withdrawals; relative weakness from May until August, strength from September till present.
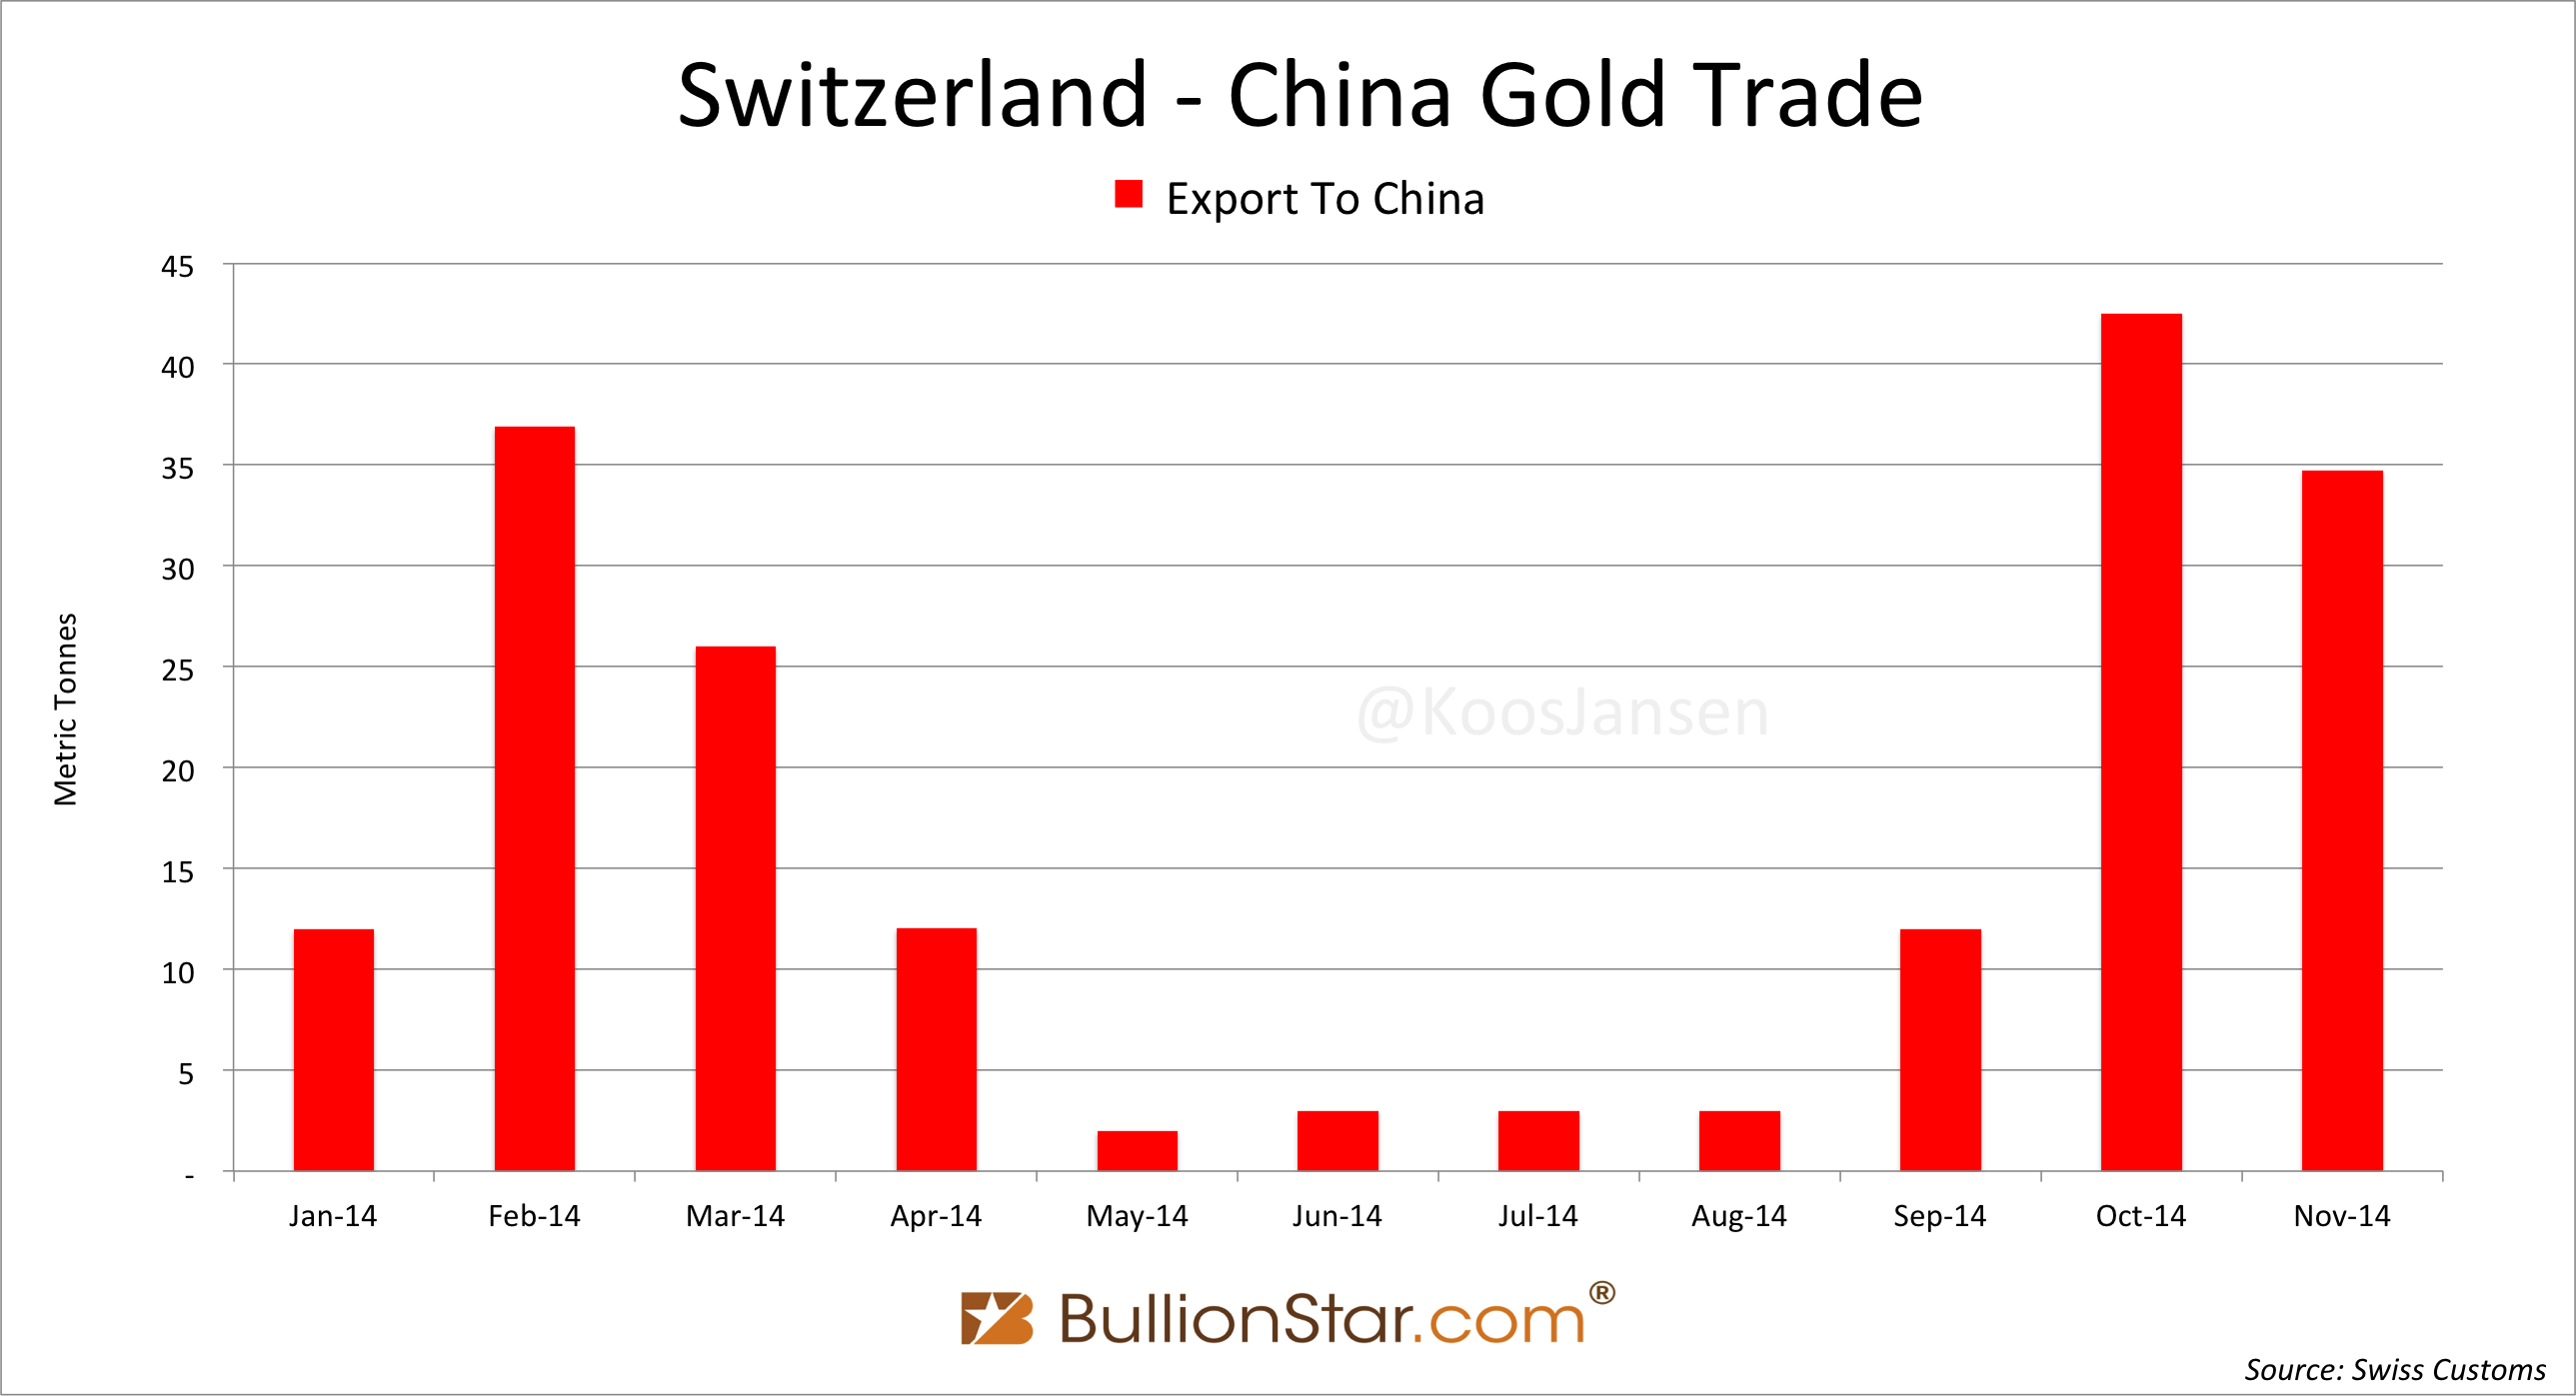
In November Swiss gold export to China was 35 tonnes, down 18 % m/m. Switzerland net gold export January – November heading for China was 187 tonnes.
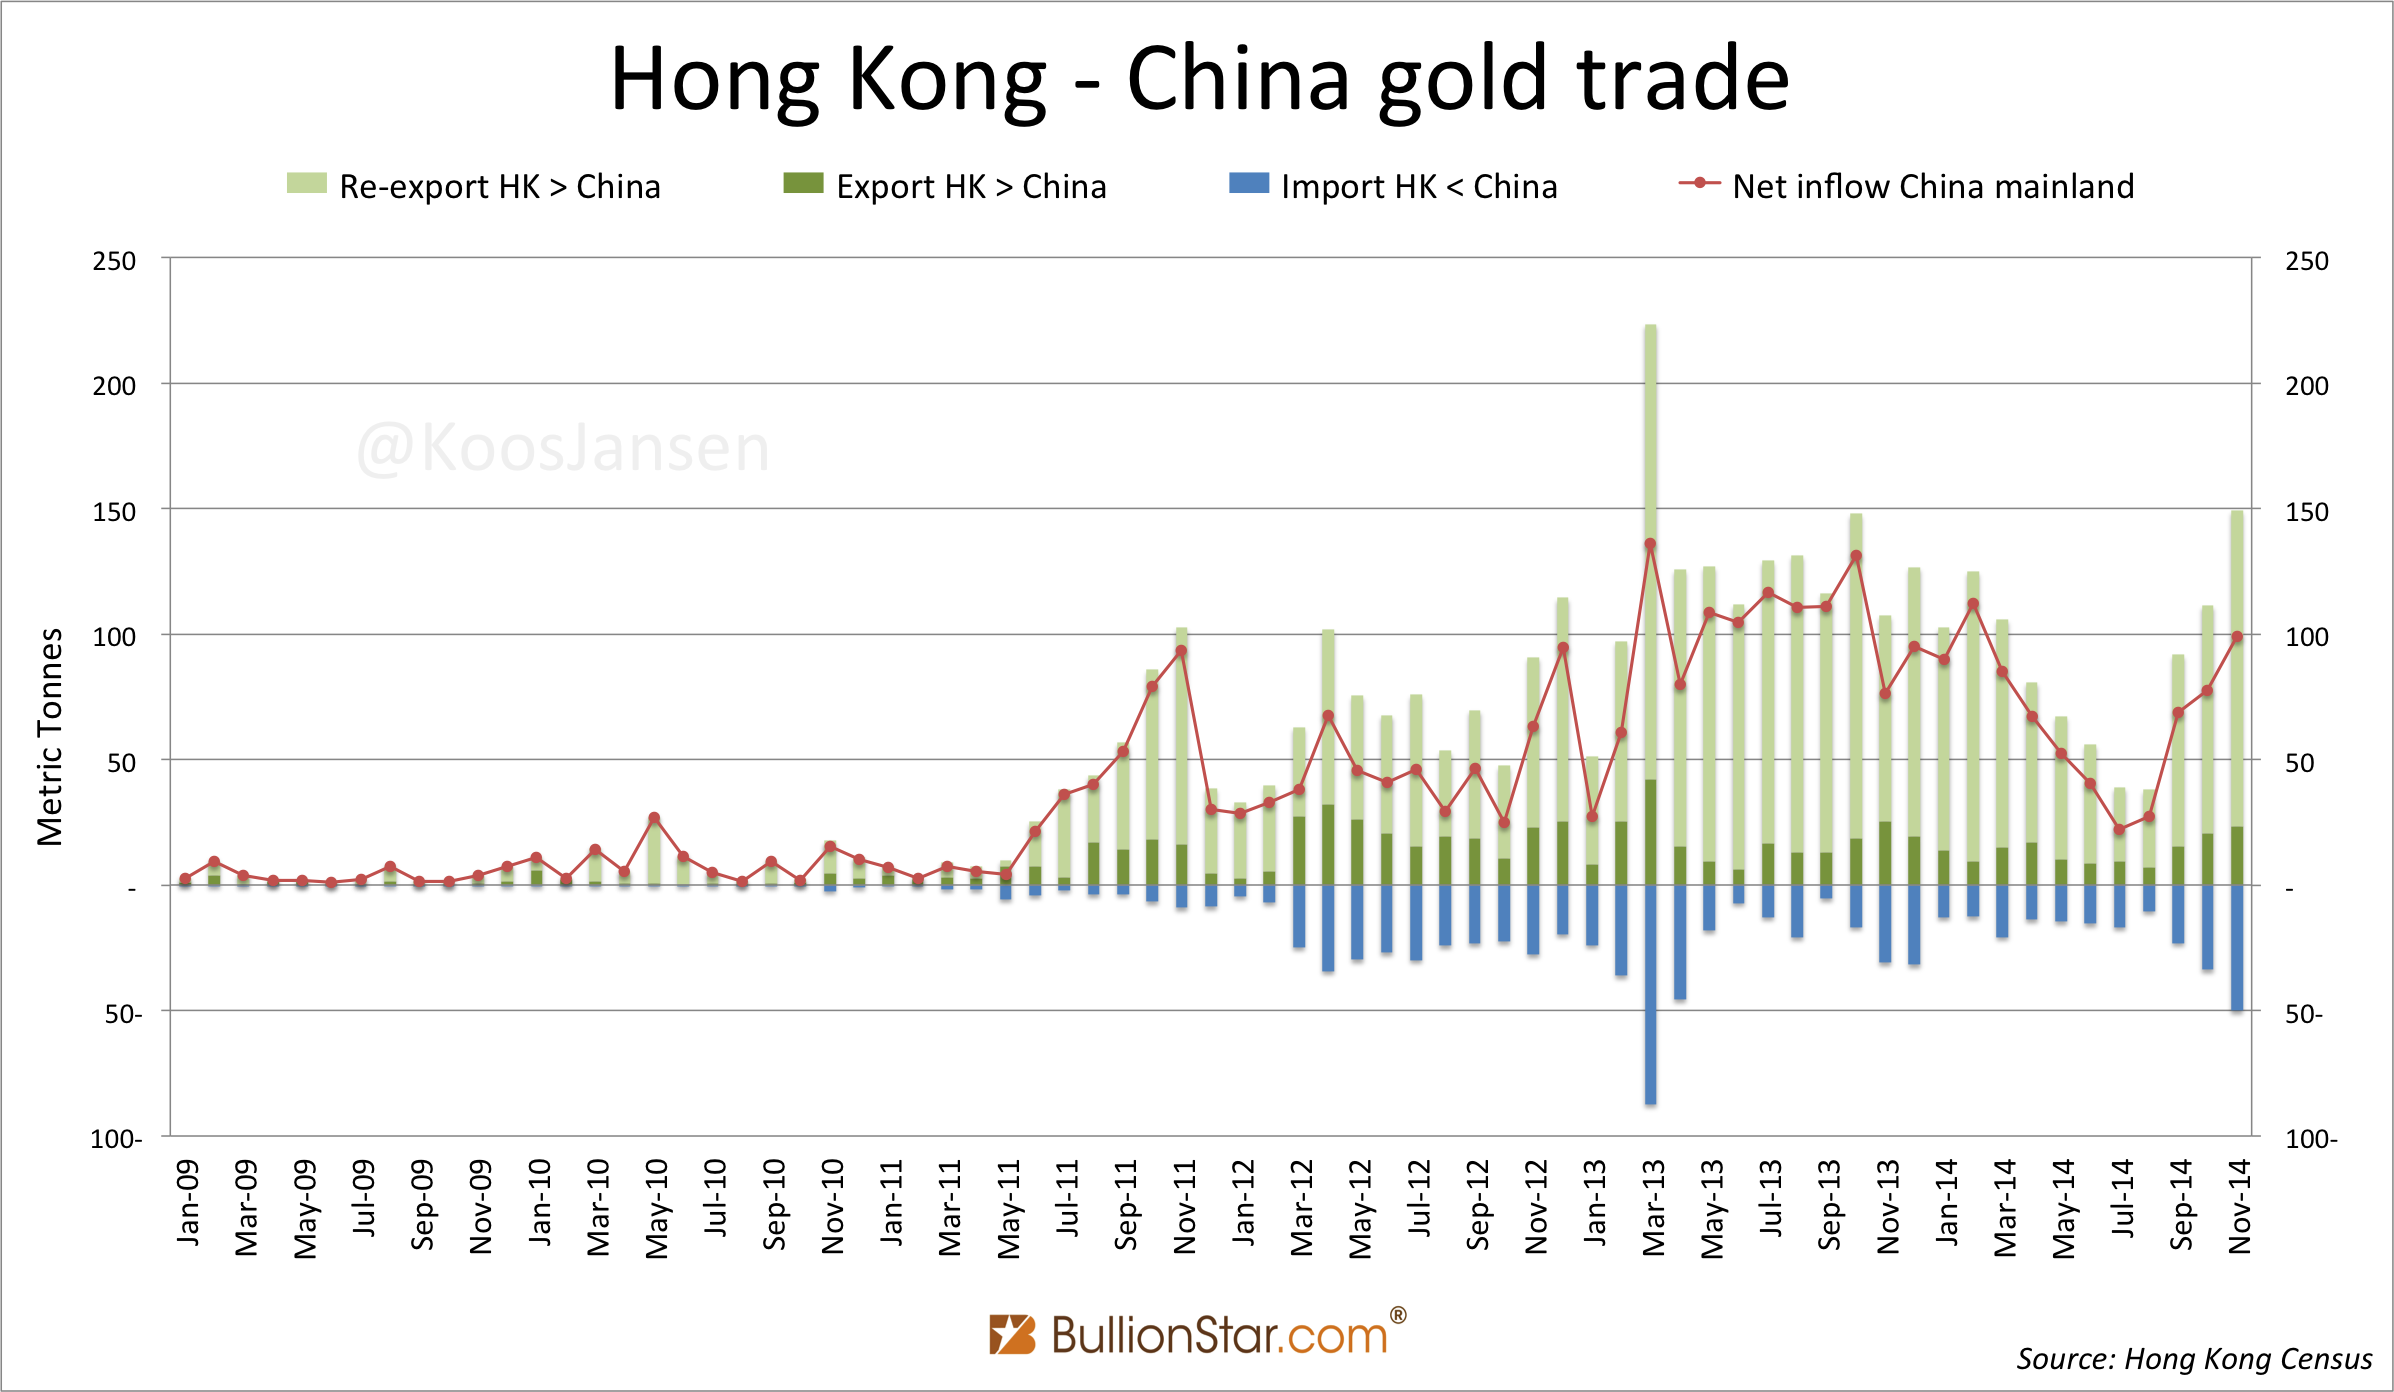
Hong Kong
Hong Kong is Asia’s main trading hub. Gigantic amounts of gold are imported, most of which is destined for the mainland, though Hong Kong has also net imported hundreds of tonnes itself since 2013.
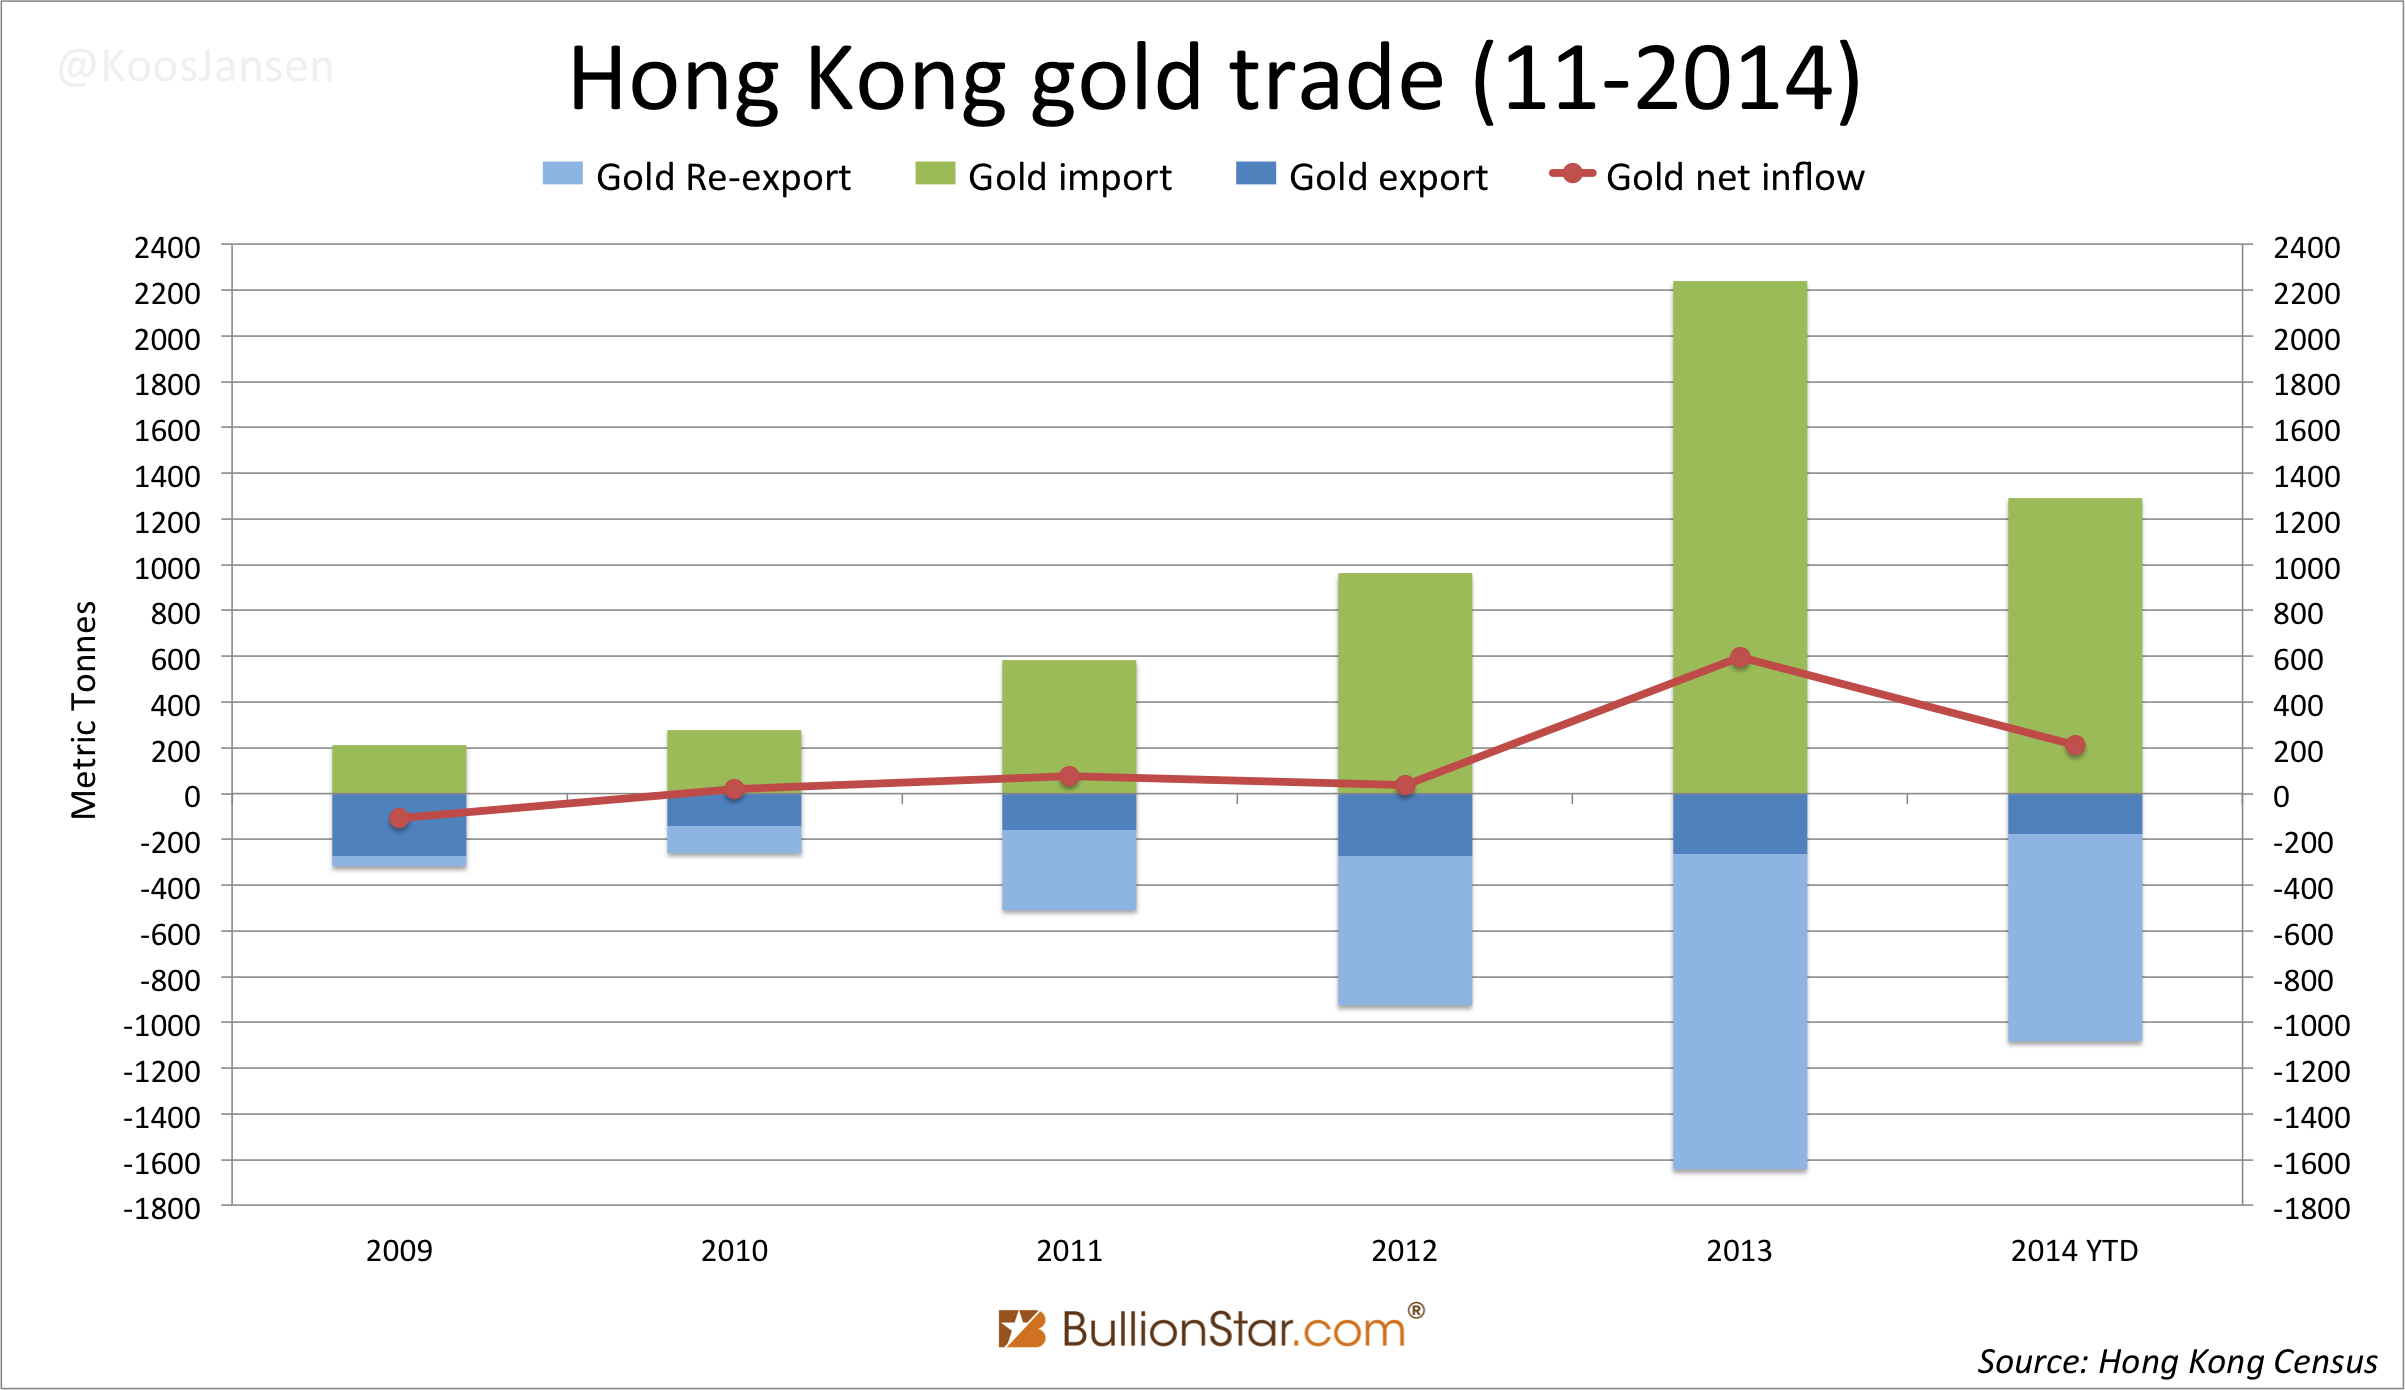
I’ve been excepting most of Hong Kong’s stock will ultimately be drained by China. From Koos Jansen, June 21, 2014:
In 2013, the year Chinese demand for physical gold exploded, Hong Kong gross gold import was 2239 metric tonnes. The bulk of this was exported to China mainland (net 1158 tonnes), but a staggering 597 tonnes was left behind.
… It will be interesting when Hong Kong becomes a net exporter.
Not by staggering amounts, but Hong Kong is currently a net exporter for four months in a row.
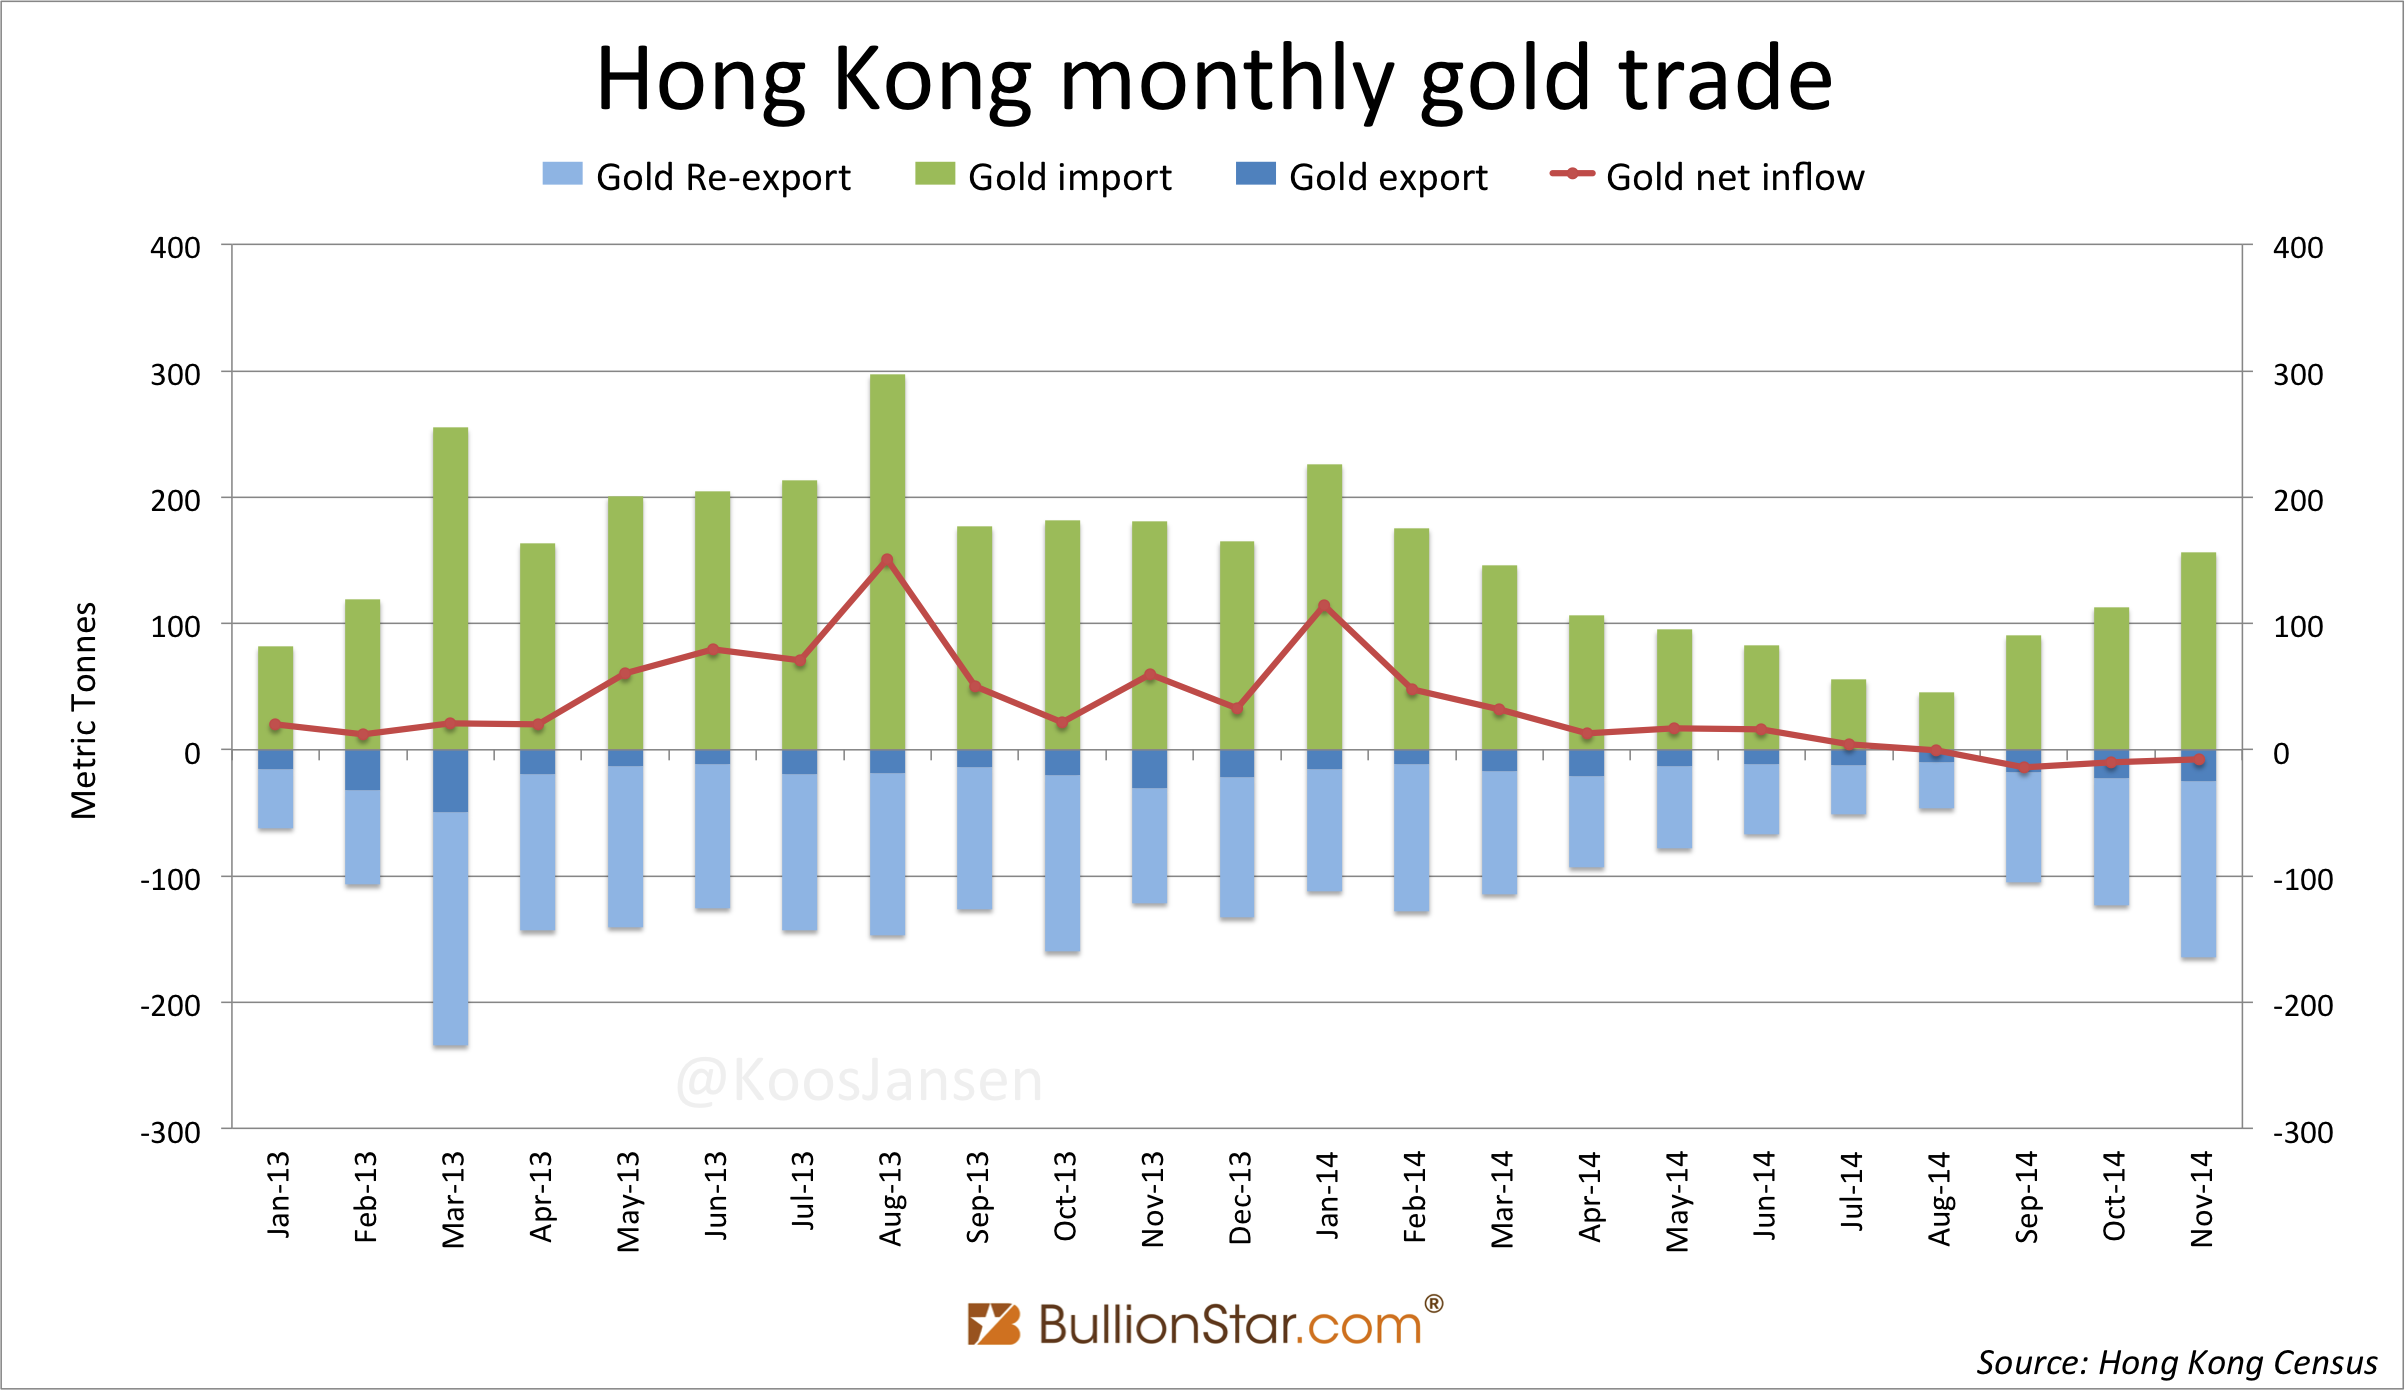
Hong Kong started net exporting in August when demand in China was relatively weak; I expect these net exports to further increase, as Chinese demand accelerated in September through December.
In the first eleven months of 2014 Hong Kong net exported 742 tonnes to mainland China – down 30 % y/y.
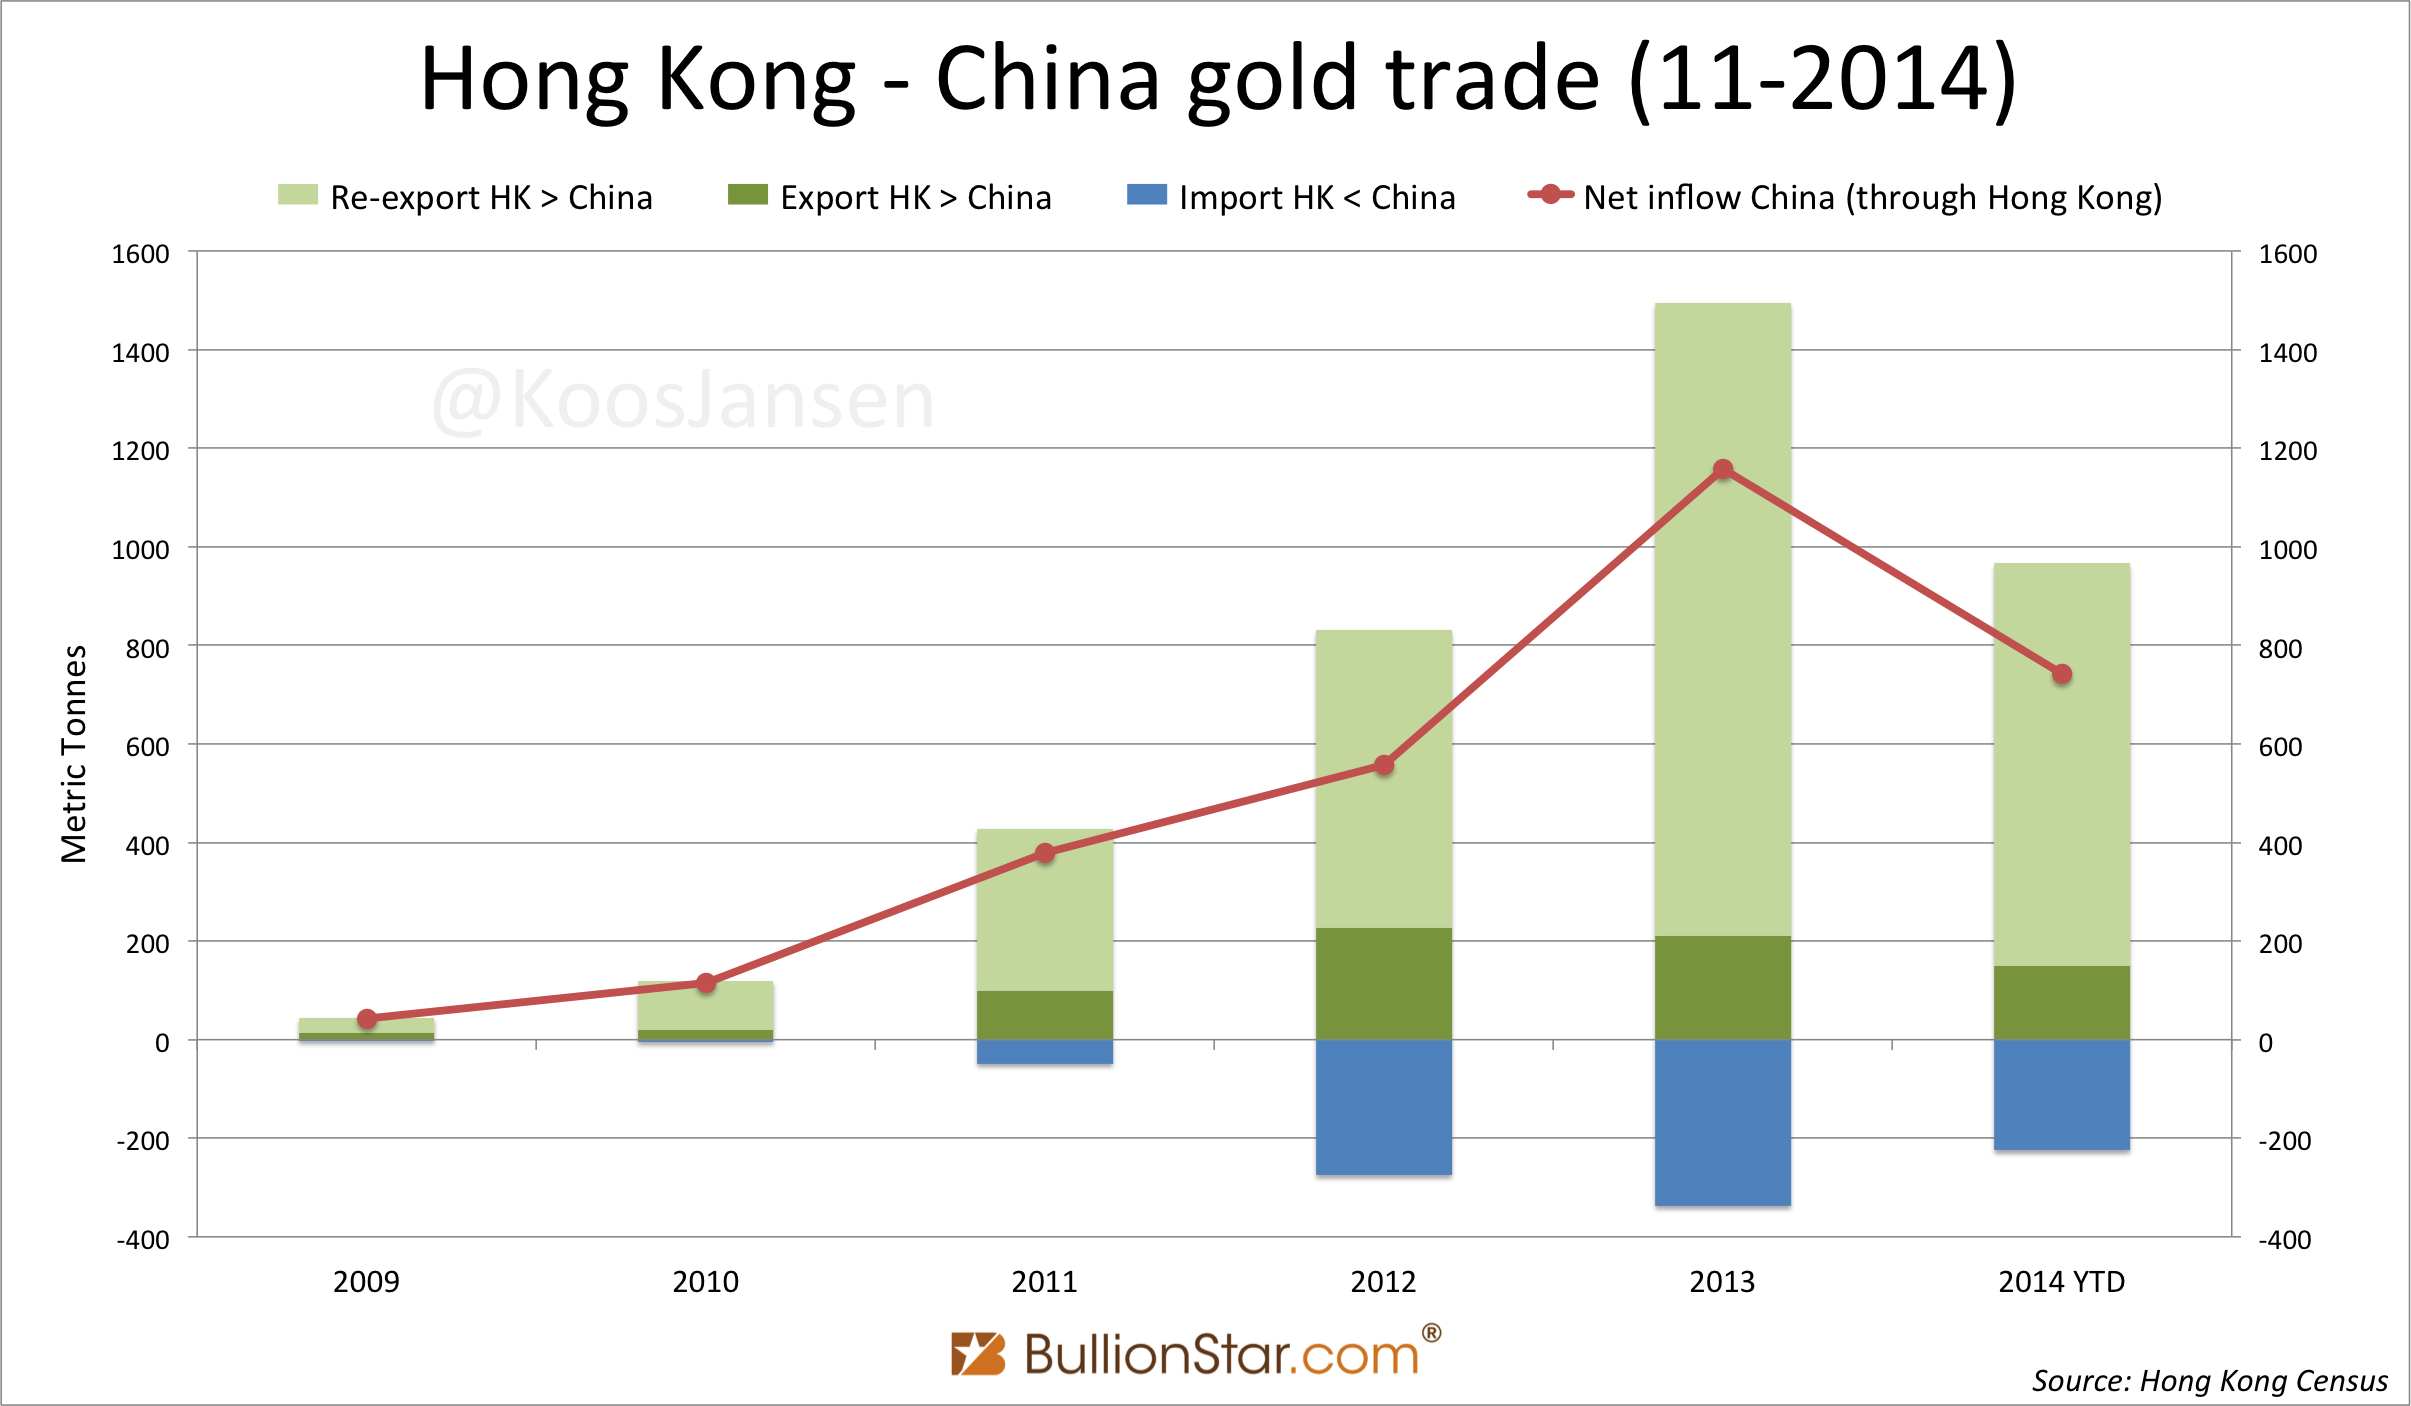
In November net export to China was 99 tonnes, up 28 % m/m, a record since February. Note, again, the SGE withdrawal pattern in exports.
Australia
Australia is the second largest miner in the world, producing roughly 250 tonnes a year. Gold that is nearly all exported, as the ozzies themselves do not have an appetite for yellow metal comparable to Indians or Chinese.
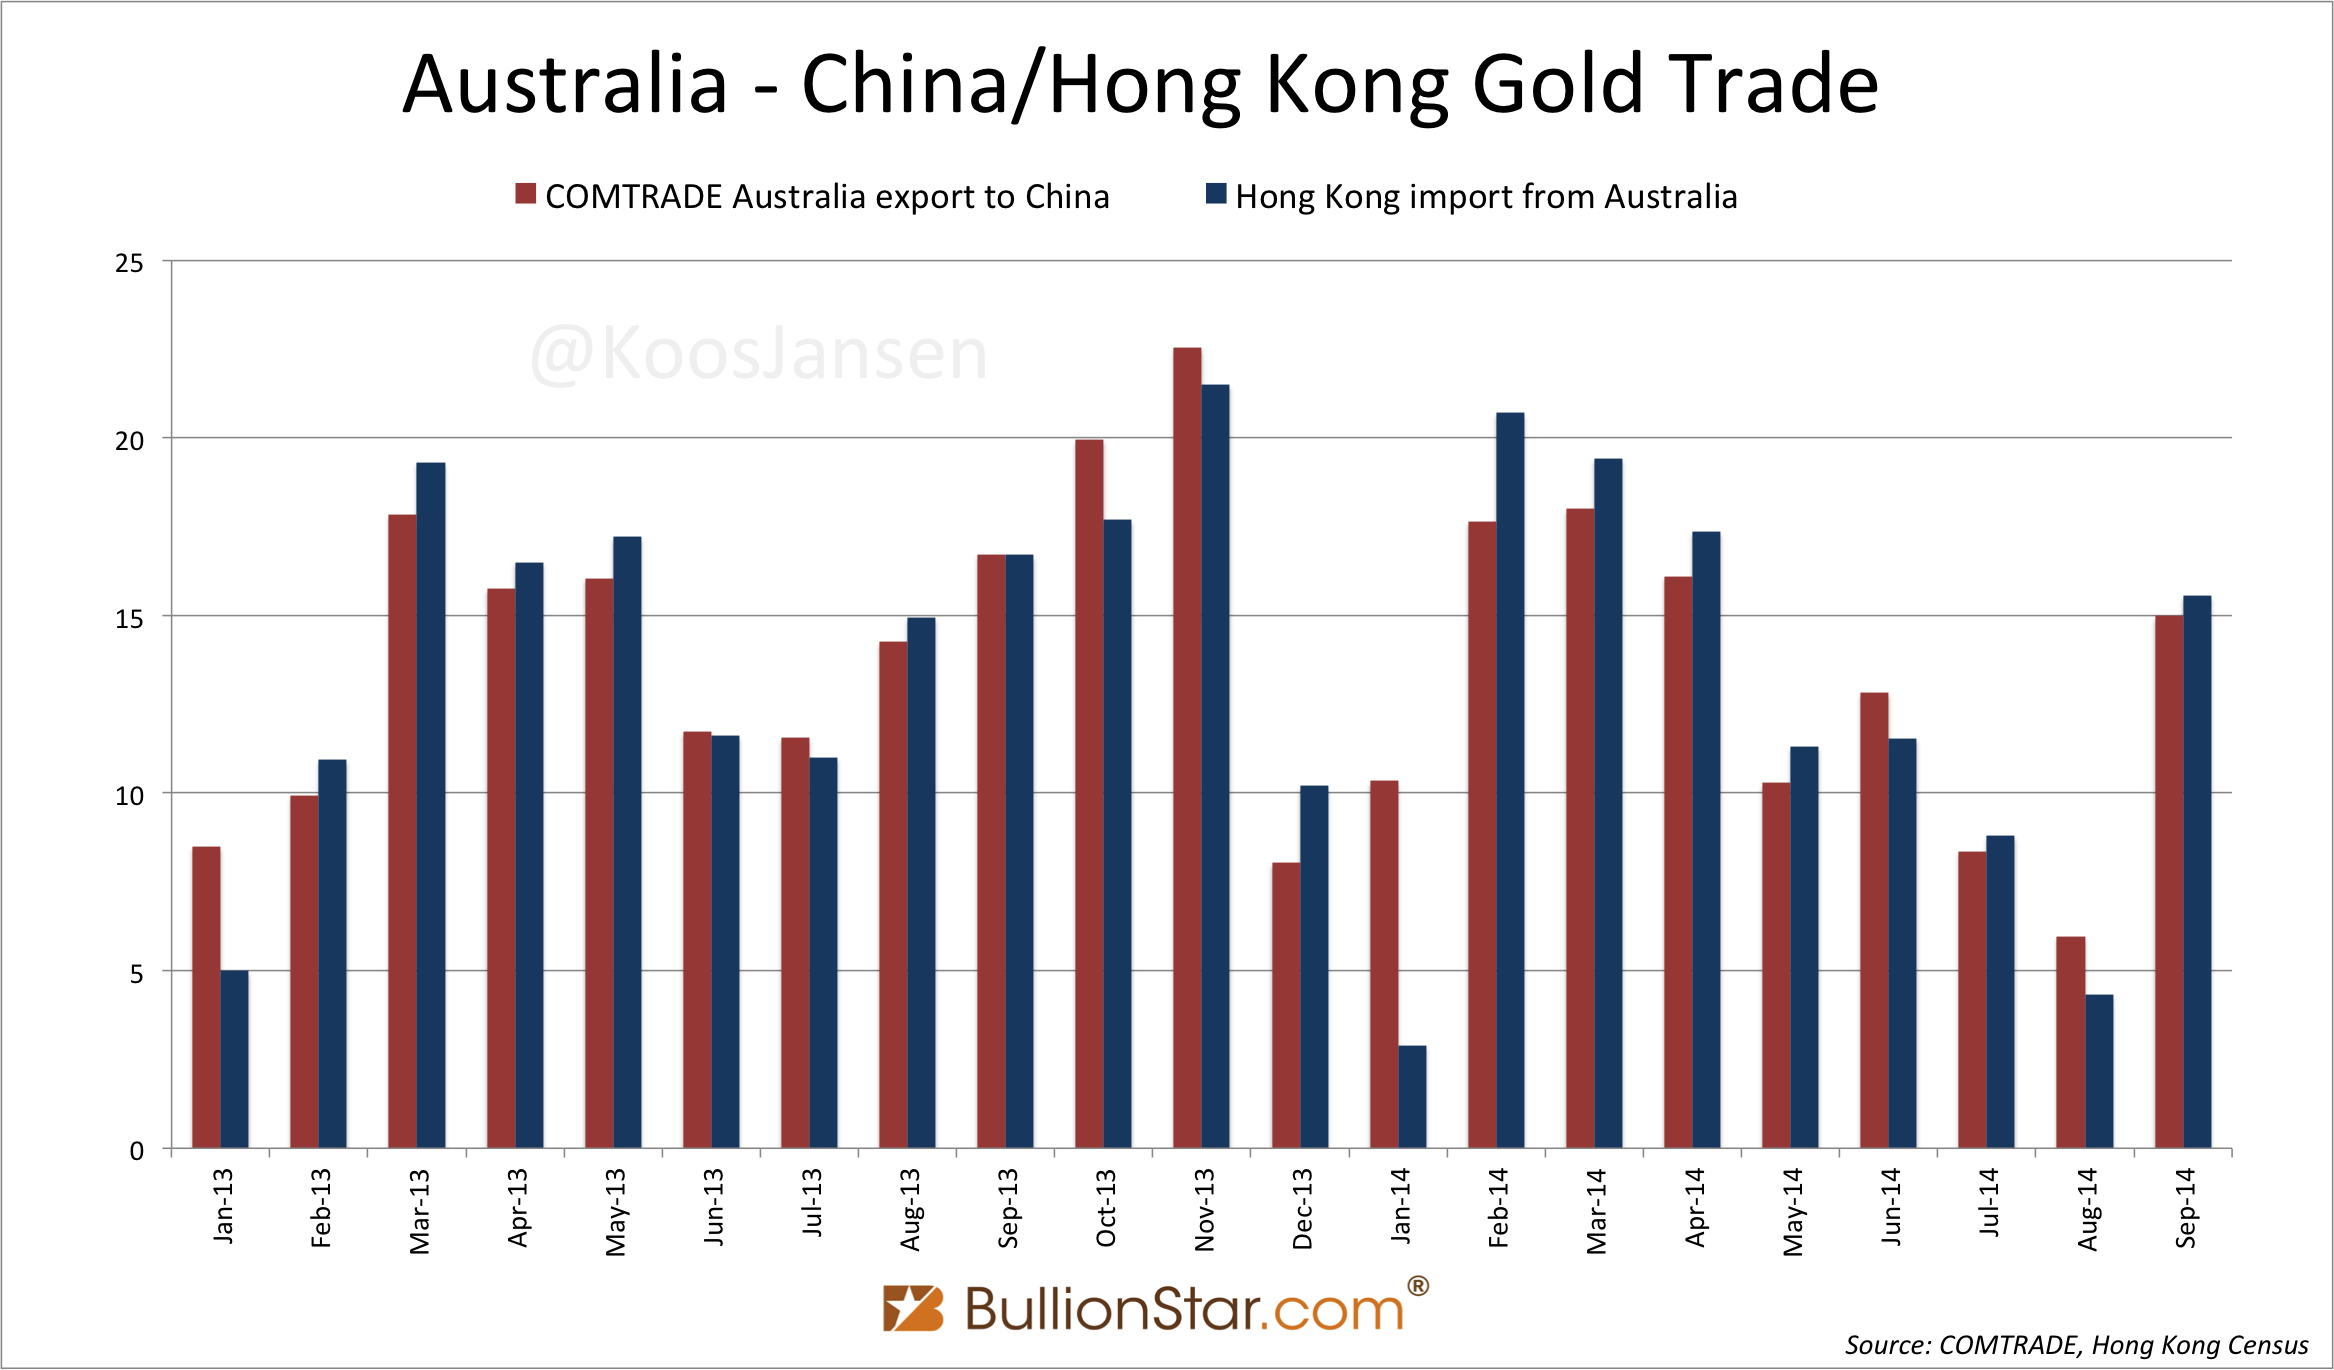
Export data of the land of down under can be tracked through COMTRADE – that copies its data from the Australian Bureau Of Statistics. This data is deceiving though, as I’ve just found out. Australia discloses gold export to China, also when it’s shipped via Hong Kong. This results in double counting, as Hong Kong counts this gold as exported to China as well.
When I compared Australia’s export to China data from COMTRADE with Hong Kong’s import from Australia data from the Hong Kong Census And Statistics Department, I noticed they are nearly the same. This is an accounting inaccuracy by the Australian Bureau Of Statistics in my opinion.
To make sure the COMTRADE numbers are reliable I double-checked them with numbers from GTIS – that copies its data from the Australian Bureau Of Statistics as well.
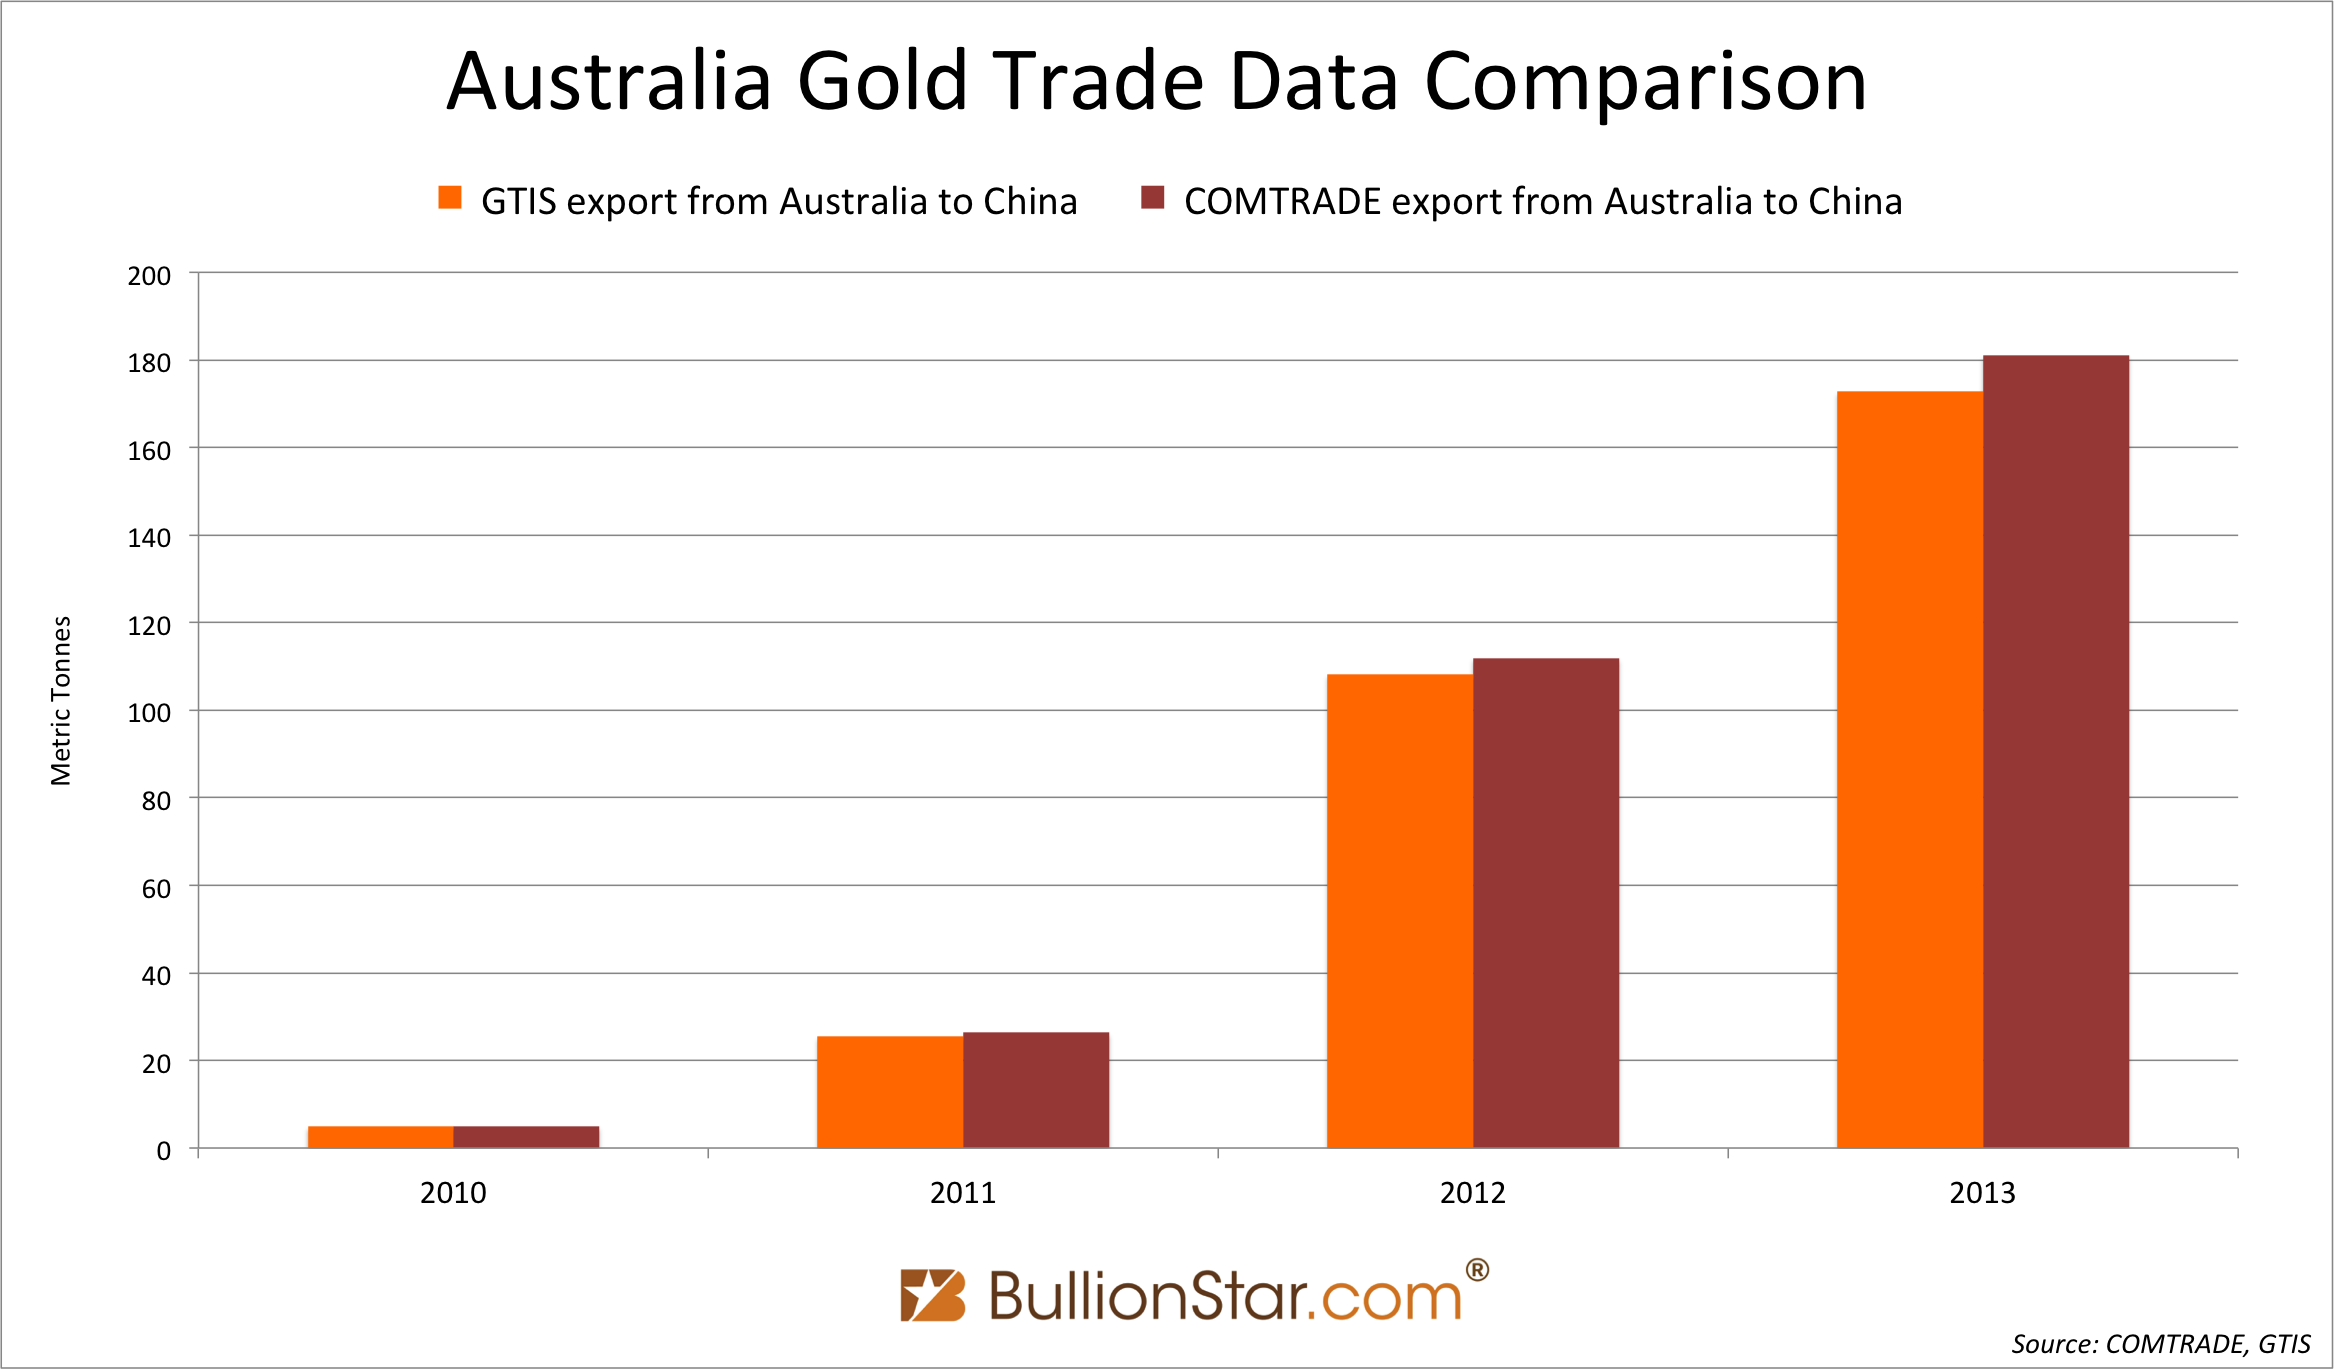
These data sets are the same – the differences are negligible.
I asked Bron Suchecki, manager at the Perth Mint in Australia, if he knew whether his company sends gold destined for China always via Hong Kong or not. He replied (published with permission):
Generally, little of what gets shipped from the Perth Mint to Hong Kong would stay there – most would be in transit to China. There are many reasons for why Chinese bound metal would transit through Hong Kong, including logistics (more flights Perth to Hong Kong than Perth to China) and the breaking up of the usual one tonne plus sized deals we do with bullion banks into smaller shipments for their end customers.
In another email he explained the Perth Mint mostly sells to Bullion Banks, who are subsequently the legal exporters from Australia to China or Hong Kong. There for he doesn’t know how gold destined for China is shipped.
This comment Bron posted at his own blog, he stated about Perth Mint shipments to China in 2013…
The Perth Mint probably accounted for 15% of that 1500t China import.
The 15 % (225 tonnes) doesn’t reflect a precise tonnage, however I think it shows Australia exports more gold to China than is disclosed by COMTRADE/GTIS (180 tonnes).
Conclusion: the numbers I used in this post for gold export from Australia to China have been double counted (I’ll put a link in to this post for clarity). Although we know Australia exports huge quantities to China, we don’t know how much is shipped in addition to what travels via Hong Kong. I don’t feel comfortable, therefor, using any of Australia’s export numbers at this stage.
The US
Right, so what’s the score? We are chasing 1,100 tonnes, thus far we’ve got 105 tonnes from the UK, 187 tonnes from Switzerland and 752 tonnes from Hong Kong, all added up makes 1,044 tonnes. Where could the remaining 56 tonnes could have come from? Not from the US, according to data from USGS.
The US exports substantial amounts of gold to Switzerland and Hong Kong, but very little to China itself. Worth mentioning, however, is that in September the US for the first time exported a few tonnes of bullion directly to China.
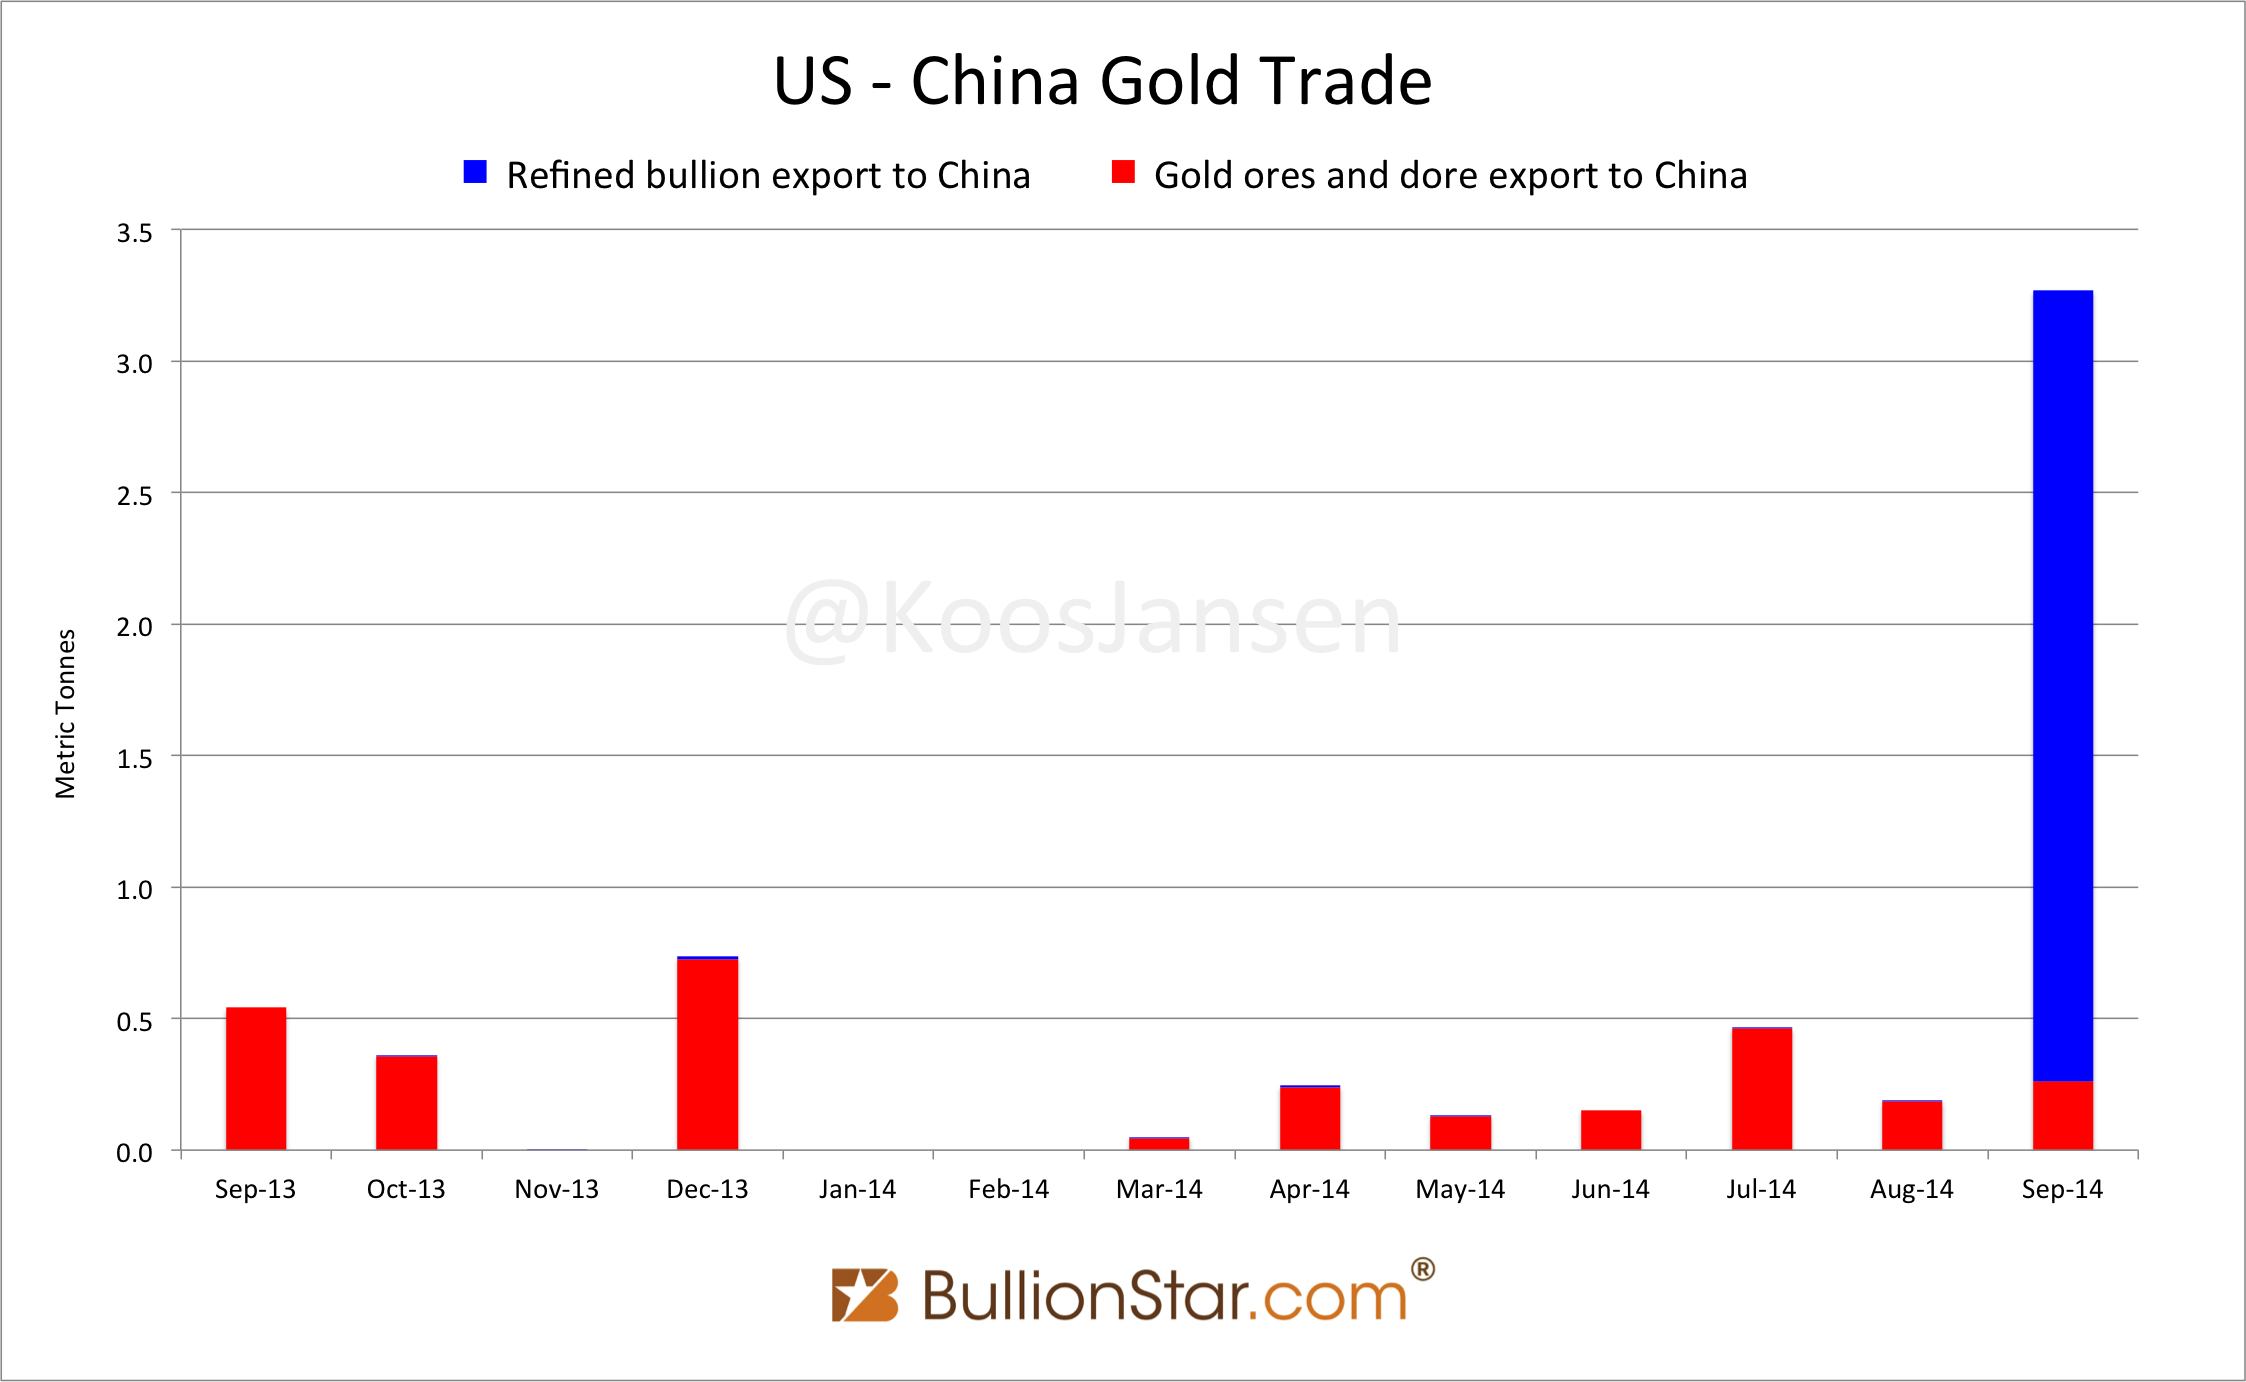
Needless to say the 6 fine tonnes that were exported from the US do not fill the 56 tonnes gap. Were the remaining 50 tonnes came from I don’t know. It can be from mines in Africa or central Asia.
Popular Blog Posts by Koos Jansen
 China’s Secret Gold Supplier is Singapore
 Audits of U.S. Monetary Gold Severely Lack Credibility
 China Gold Import Jan-Sep 797t. Who’s Supplying?
 The Gold-Backed-Oil-Yuan Futures Contract Myth
 Estimated Chinese Gold Reserves Surpass 20,000t
 PBOC Gold Purchases: Separating Facts from Speculation
 U.S. Mint Releases New Fort Knox Audit Documentation
 China Net Imported 1,300t of Gold in 2016
 Why SGE Withdrawals Equal Chinese Gold Demand and Why Not