

March 2017 Gold Market Charts

 Gold Market Charts
 0 Comments
This monthly chart wrap-up from BullionStar profiles a selection of charts from the GOLD CHARTS R US website so as to illustrate notable developments in gold demand, gold supply and physical gold movements across the world’s major gold markets. Charts covered below include Swiss gold trade flows, Russian gold reserve changes, and Chinese gold demand.
For BullionStar’s own gold and silver price charts, see BullionStar’s website under the Charts menu, where, for example, currencies, equity market indices and commodities can be charted and measured in terms of gold, silver, and other precious metals.
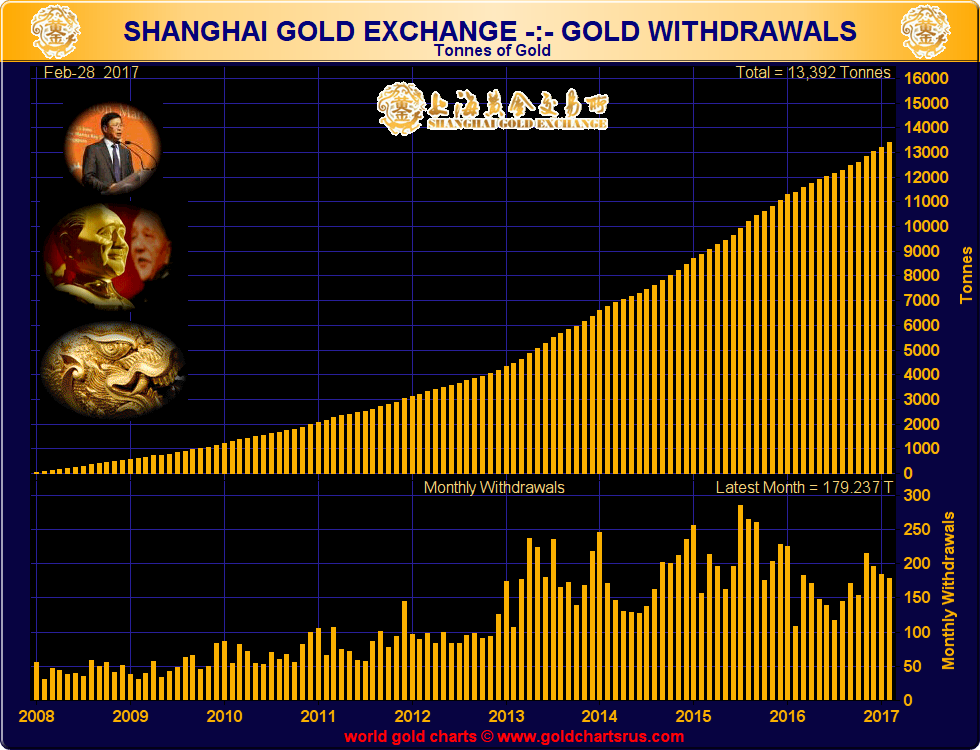
Shanghai Gold Exchange (SGE) – Gold Withdrawals
The below chart features monthly physical gold withdrawals from the Shanghai Gold Exchange (SGE). Given that all gold imported into China and most gold mined and recycled in China passes through the vaults of the SGE, the monthly gold withdrawals from the SGE serve as a useful proxy for overall monthly Chinese wholesale gold demand. Note that SGE gold withdrawals most probably do not reflect gold purchases by the People’s Bank of China (PBoC) since the PBoC is not thought to buy any gold at the SGE, preferring instead to purchase gold in international gold market centres such as London.
In February 2017, SGE gold withdrawals totalled 179 tonnes, which was slightly lower than the previous month’s total of 184 tonnes. Year-to-date, withdrawals of gold from the Shanghai gold bourse have now reached 363 tonnes, which on an annualised basis would be nearly 2,200 tonnes. This would equate to about 70% of annual global gold mining supply.
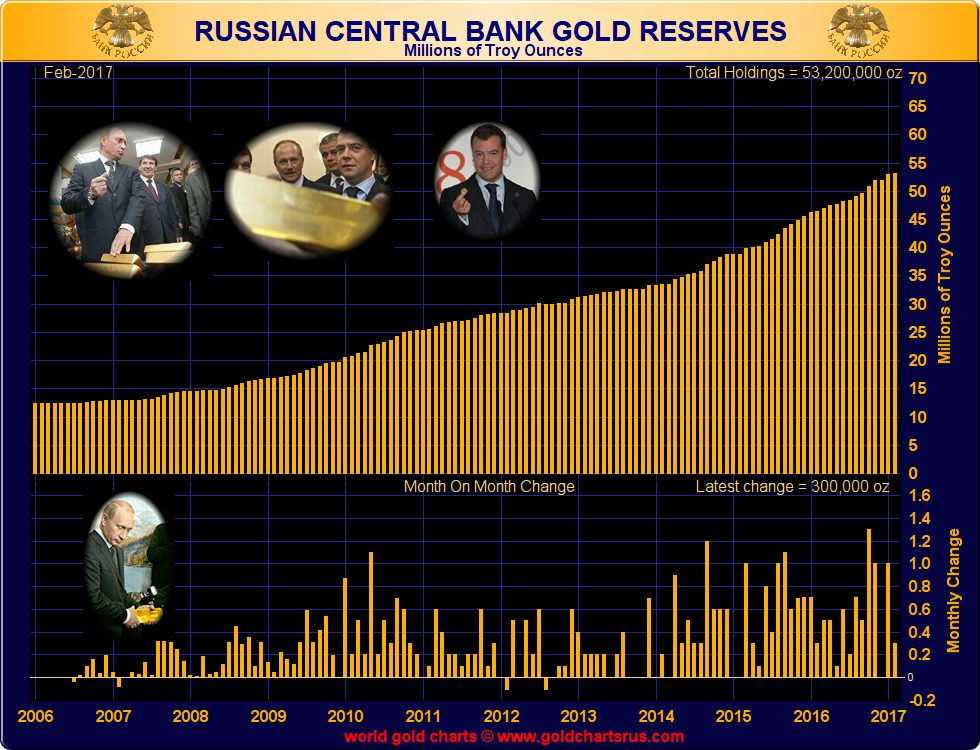
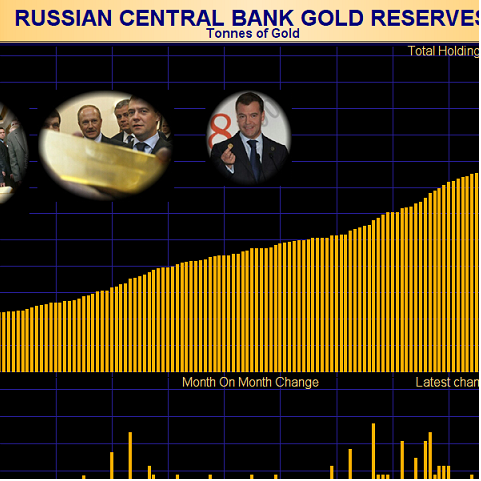
Russian Gold Reserves
Official gold reserves of the Russian Federation as held by the Bank of Russia rose by 9.3 tonnes (300,000 ozs) during February as the Russian central bank continued its gold reserve accumulation strategy into 2017. This follows the Bank of Russia’s purchase of a sizeable 31.1 tonnes (1,000,000 ozs) of gold in January, bringing its year-to-date accumulation to over 40 tonnes, which on an annualized basis equates to 240 tonnes.
Because the Bank of Russia buys its gold from Russian commercial banks – which in turn source the gold from Russian gold mines – the central bank has a lot of flexibility in pacing its gold purchases through the calendar year. In 2016, the Bank of Russia did not report any gold purchases for December since it had already reached its full-year target of 200 tonnes by the end of November. It remains to be seen if a similar pattern will play out in 2017.
Having bought 200 tonnes in 2016, 208 tonnes in 2015 and 177 tonnes in 2014, the central bank will probably again aim for aggregate additions of at least 200 tonnes during 2017, which would mean another 160 tonnes of gold buying between now and December. According to its official reporting line, the Bank of Russia now holds 1,655 tonnes (53,200,000 ozs) of gold.
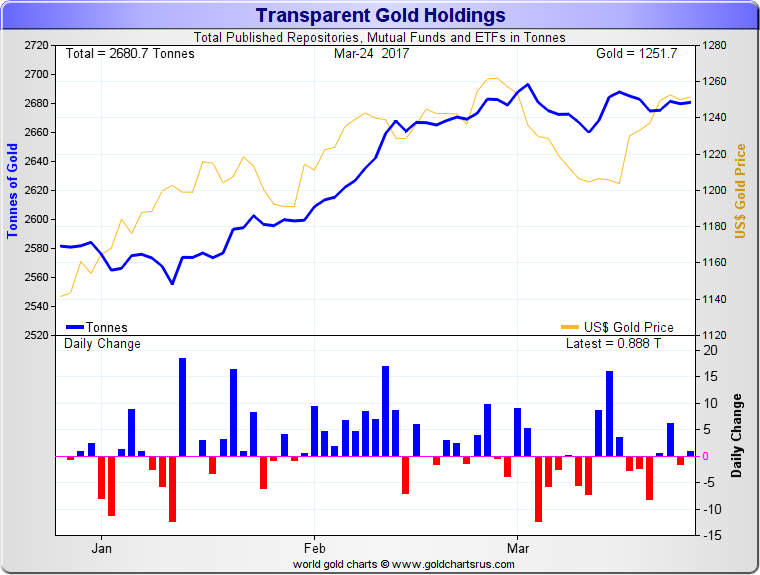
Transparent Gold Holdings – ETFs and Others
the US dollar gold price declined during the first half of March, retrenching from the $1260 to the $1200 range. This was followed by a rebound beginning mid-month which saw the US dollar price again trade in the $1260 area.
The group of gold-backed ETFs and similar vehicles tracked in the below chart saw near-zero net inflows of physical gold during the first 3 weeks of March. The total combined holdings of these vehicles and products remain near the 2680 tonnes mark and on a monthly view would appear to be flat-lining.
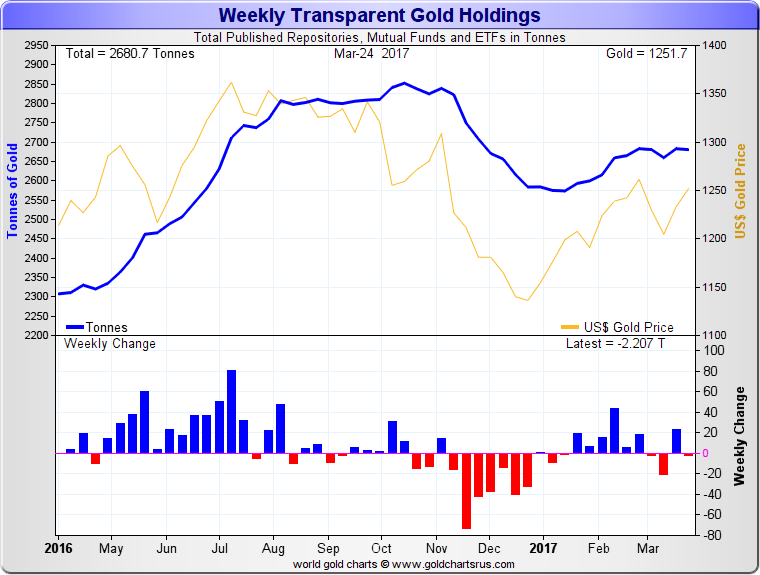
However, these net-zero inflows mask a shifting pattern of alternating daily inflows and outflows throughout March, with daily inflows and outflows often in the 5 – 10 tonne range.
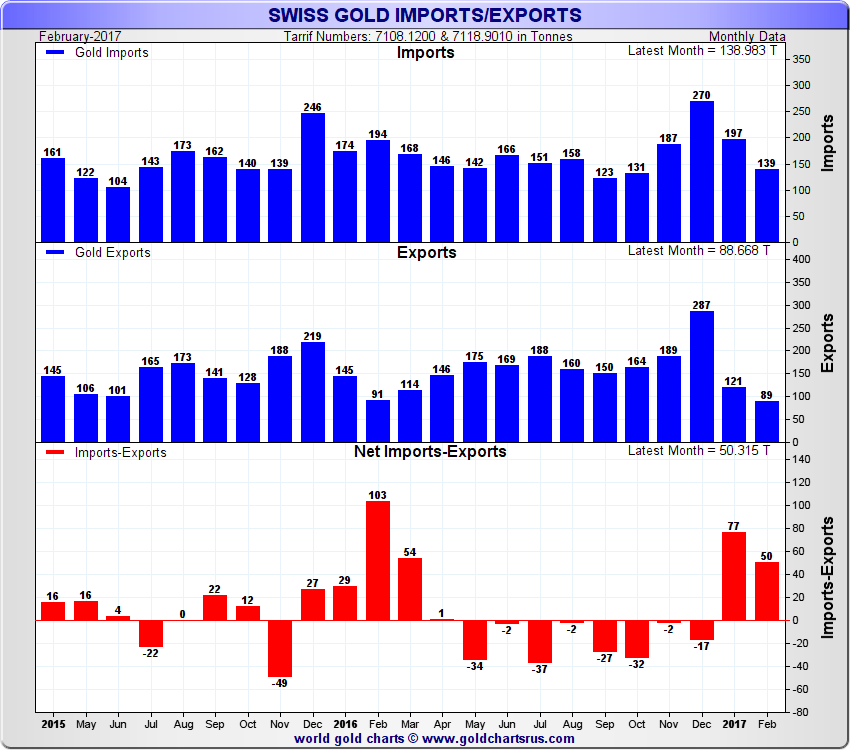
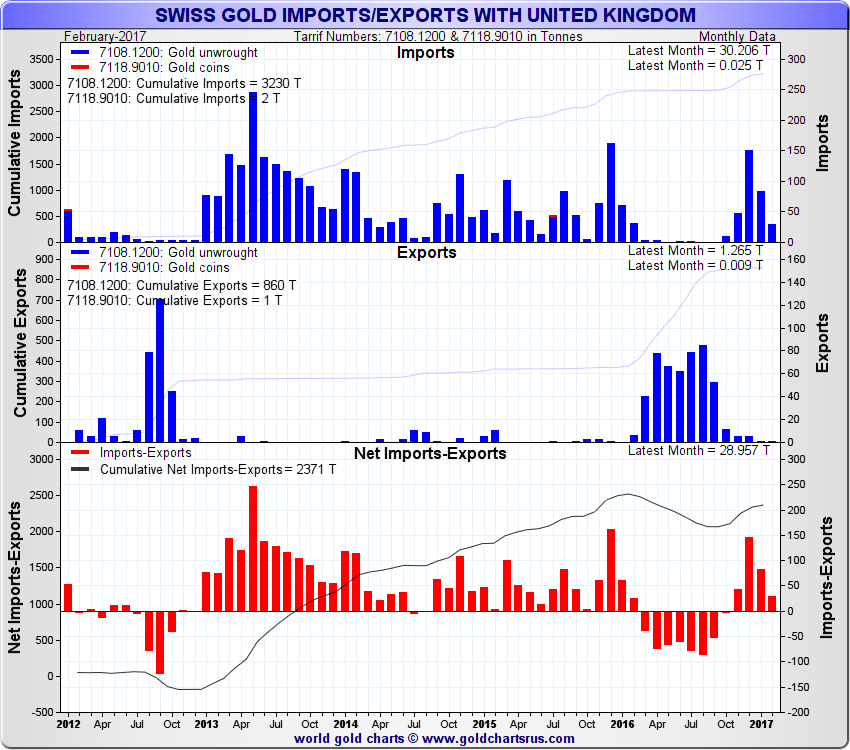
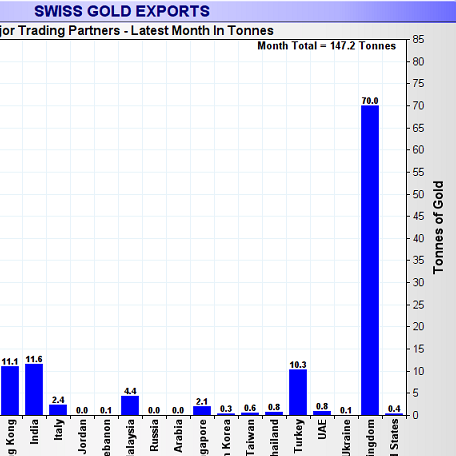
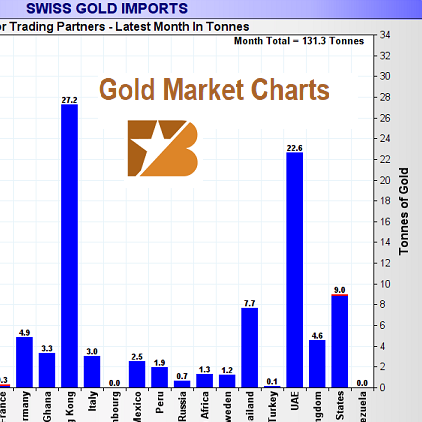
Swiss Gold Imports and Gold Exports
Non-monetary gold imports into Switzerland totalled 139 tonnes in February 2017. This figure was substantially lower than the corresponding gold import flows during each of the prior three months. Swiss non-monetary gold exports were also relatively subdued in February, totalling only 89 tonnes. Interestingly, February was also the quietest month for Swiss gold exports in 2016 when only 91 tonnes were exported out of the country.
Given that Swiss gold imports have now exceeded Swiss gold exports for the past 2 months, this implies a year-to-date net build in gold inventories of 127 tonnes to the world’s largest gold refining centre.
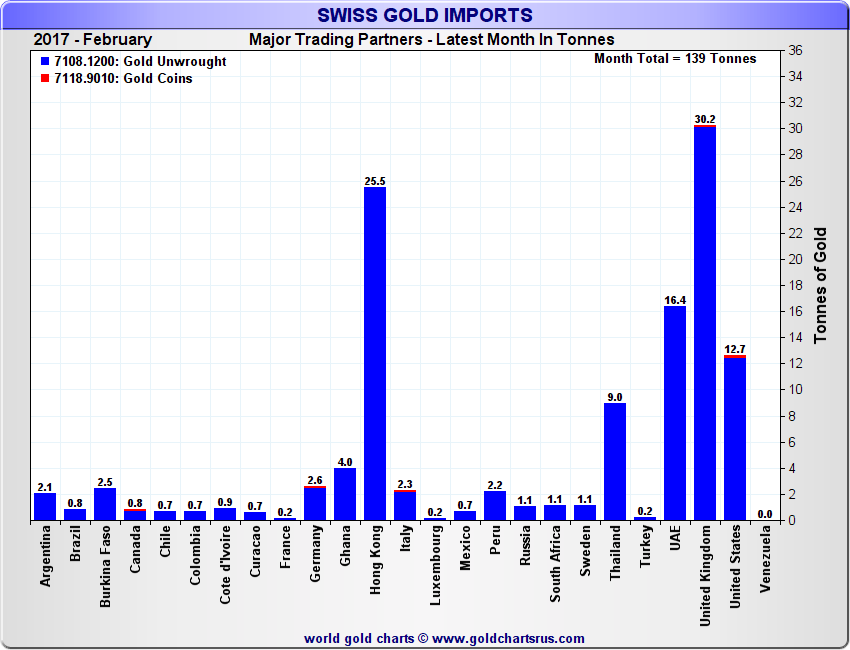
Switzerland’s gold imports during January predominantly came from 5 import sources, namely the UK (London), Hong Kong, UAE (Dubai), US and Thailand. Each of these sources has been a noted exporter of gold to Switzerland on and off over the last 3-4 months. The presence of Hong Kong, Thailand and the UAE on the list is interesting and shows that global gold supply is dynamic and changeable since these centers would usually be considered export destinations of Swiss gold, not supply sources. Some of the flows from Thailand and UAE may represent processing scrap (e.g. gold jewellery reprocessing).
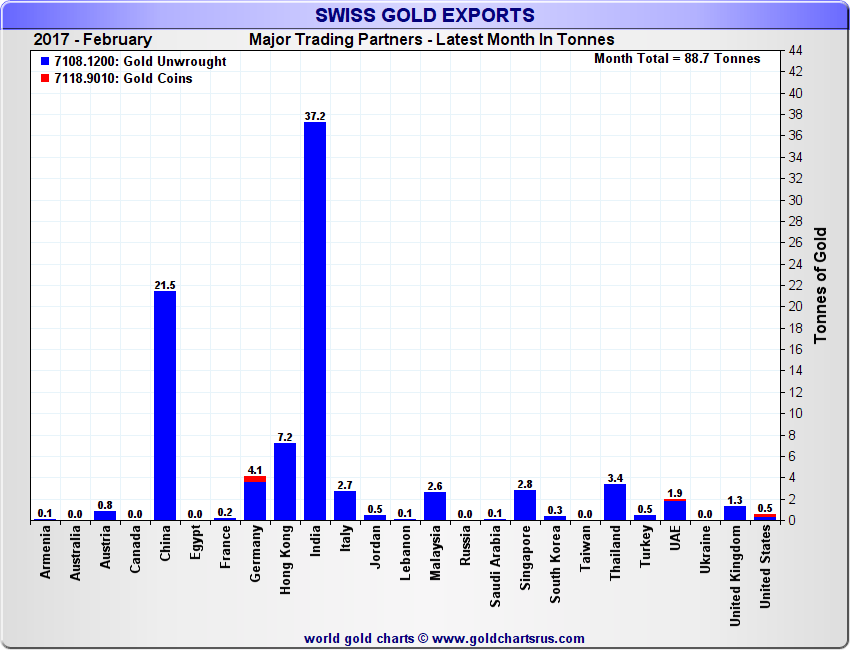
On the export side, India was again the top destination for Swiss non-monetary gold exports in February, which was also the case in January 2017. In February, India took in 37.2 tonnes of gold from Switzerland. In 2nd place was China which absorbed 21.5 tonnes. In a distant third place was Hong Kong which received 7.2 tonnes. Together these 3 destinations represented 75% of Switzerland’s February gold exports (non-monetary gold).
The 30 tonnes of non-monetary gold which the UK (London) sent to Switzerland in February reinforces a trend which began last October when London turned from a net importer of gold from Switzerland into a net-exporter of gold to Switzerland. On an accumulated basis over the last 5 consecutive months, there has been a net movement of 300 tonnes of non-monetary gold out of London and onward to Switzerland, most of which is destined for Switzerland’s gold refineries but perhaps also for Swiss-based gold-backed ETFs and other wealth management holdings.
Popular Blog Posts by Gold Market Charts
 November 2018 Gold Market Charts
 May 2018 Gold Market Charts
 December 2017 Gold Market Charts
 November 2017 Gold Market Charts
 October 2017 Gold Market Charts
 September 2017 Gold Market Charts
 August 2017 Gold Market Charts
 July 2017 Gold Market Charts
 June 2017 Gold Market Charts
 May 2017 Gold Market Charts